Comprehensive Financial Analysis Report of Funtastic Limited
VerifiedAdded on 2024/05/15
|16
|1597
|74
Report
AI Summary
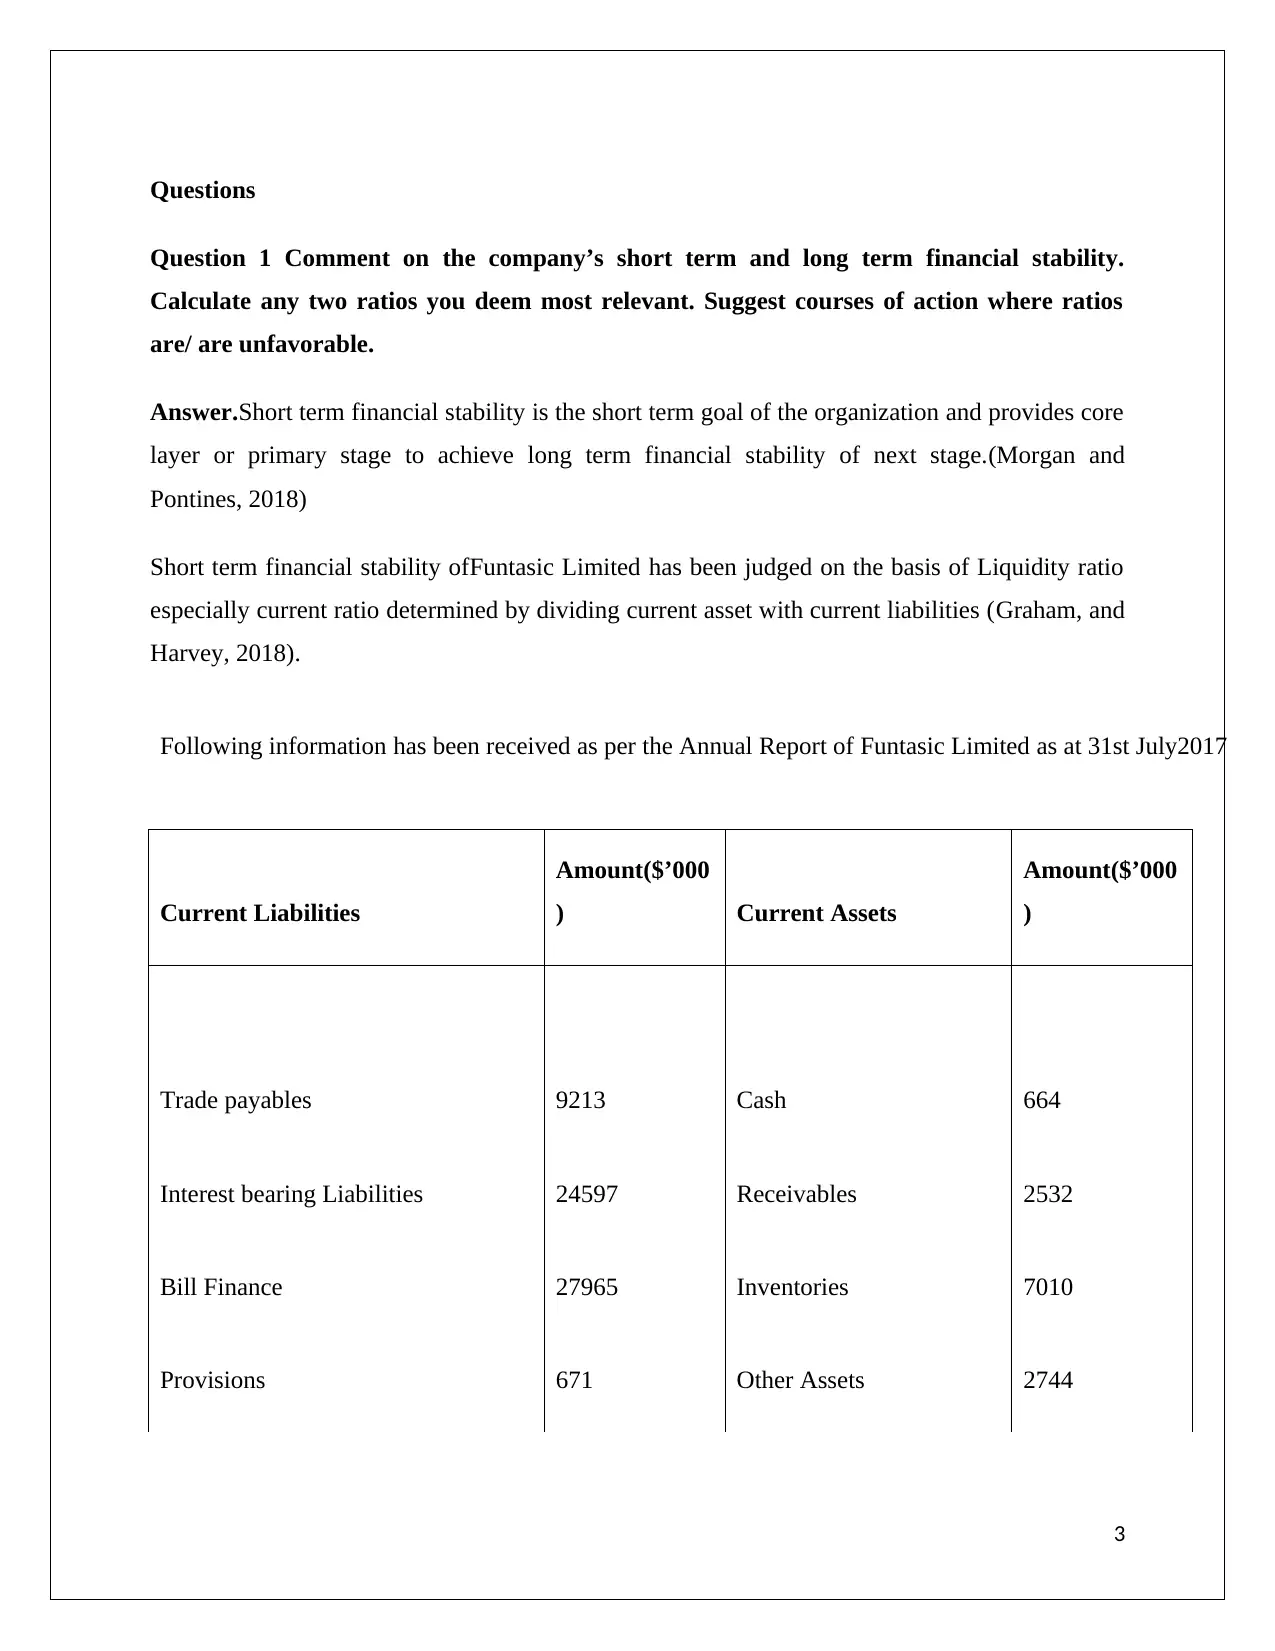
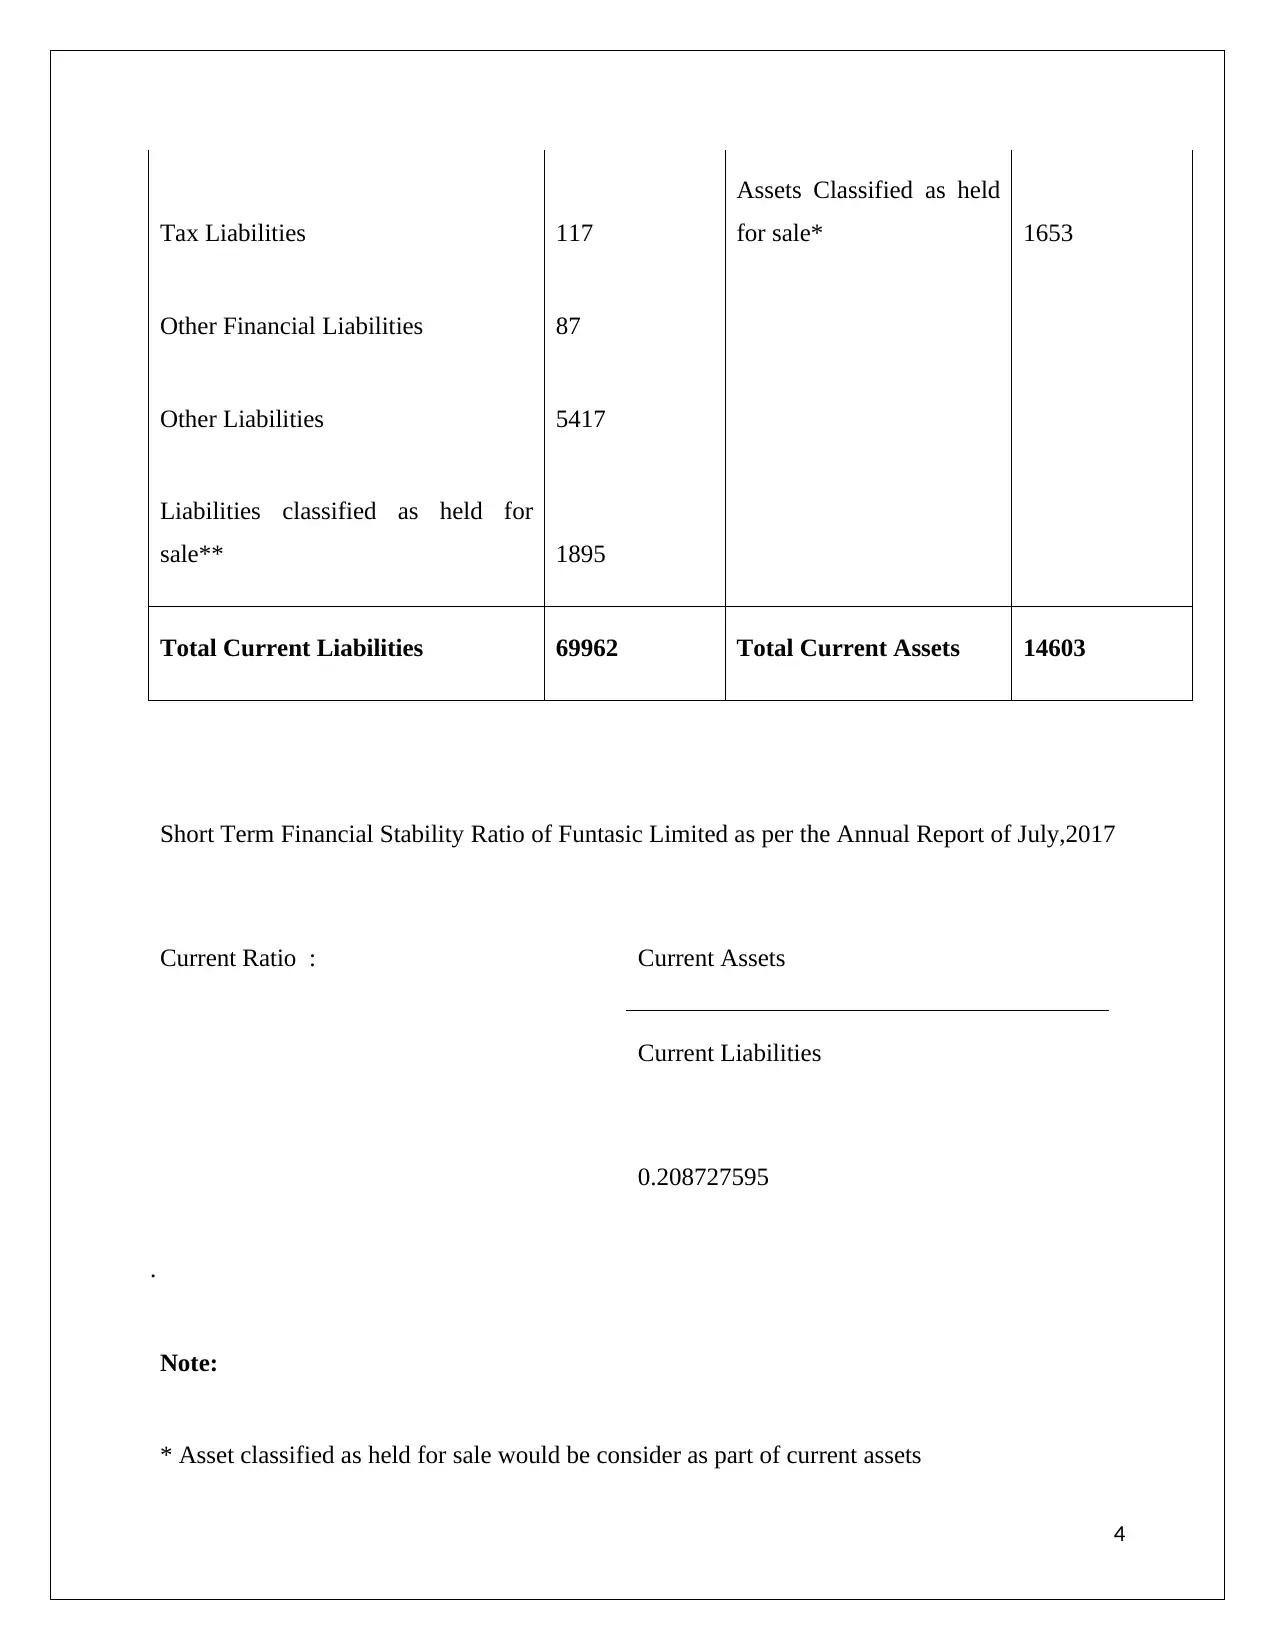
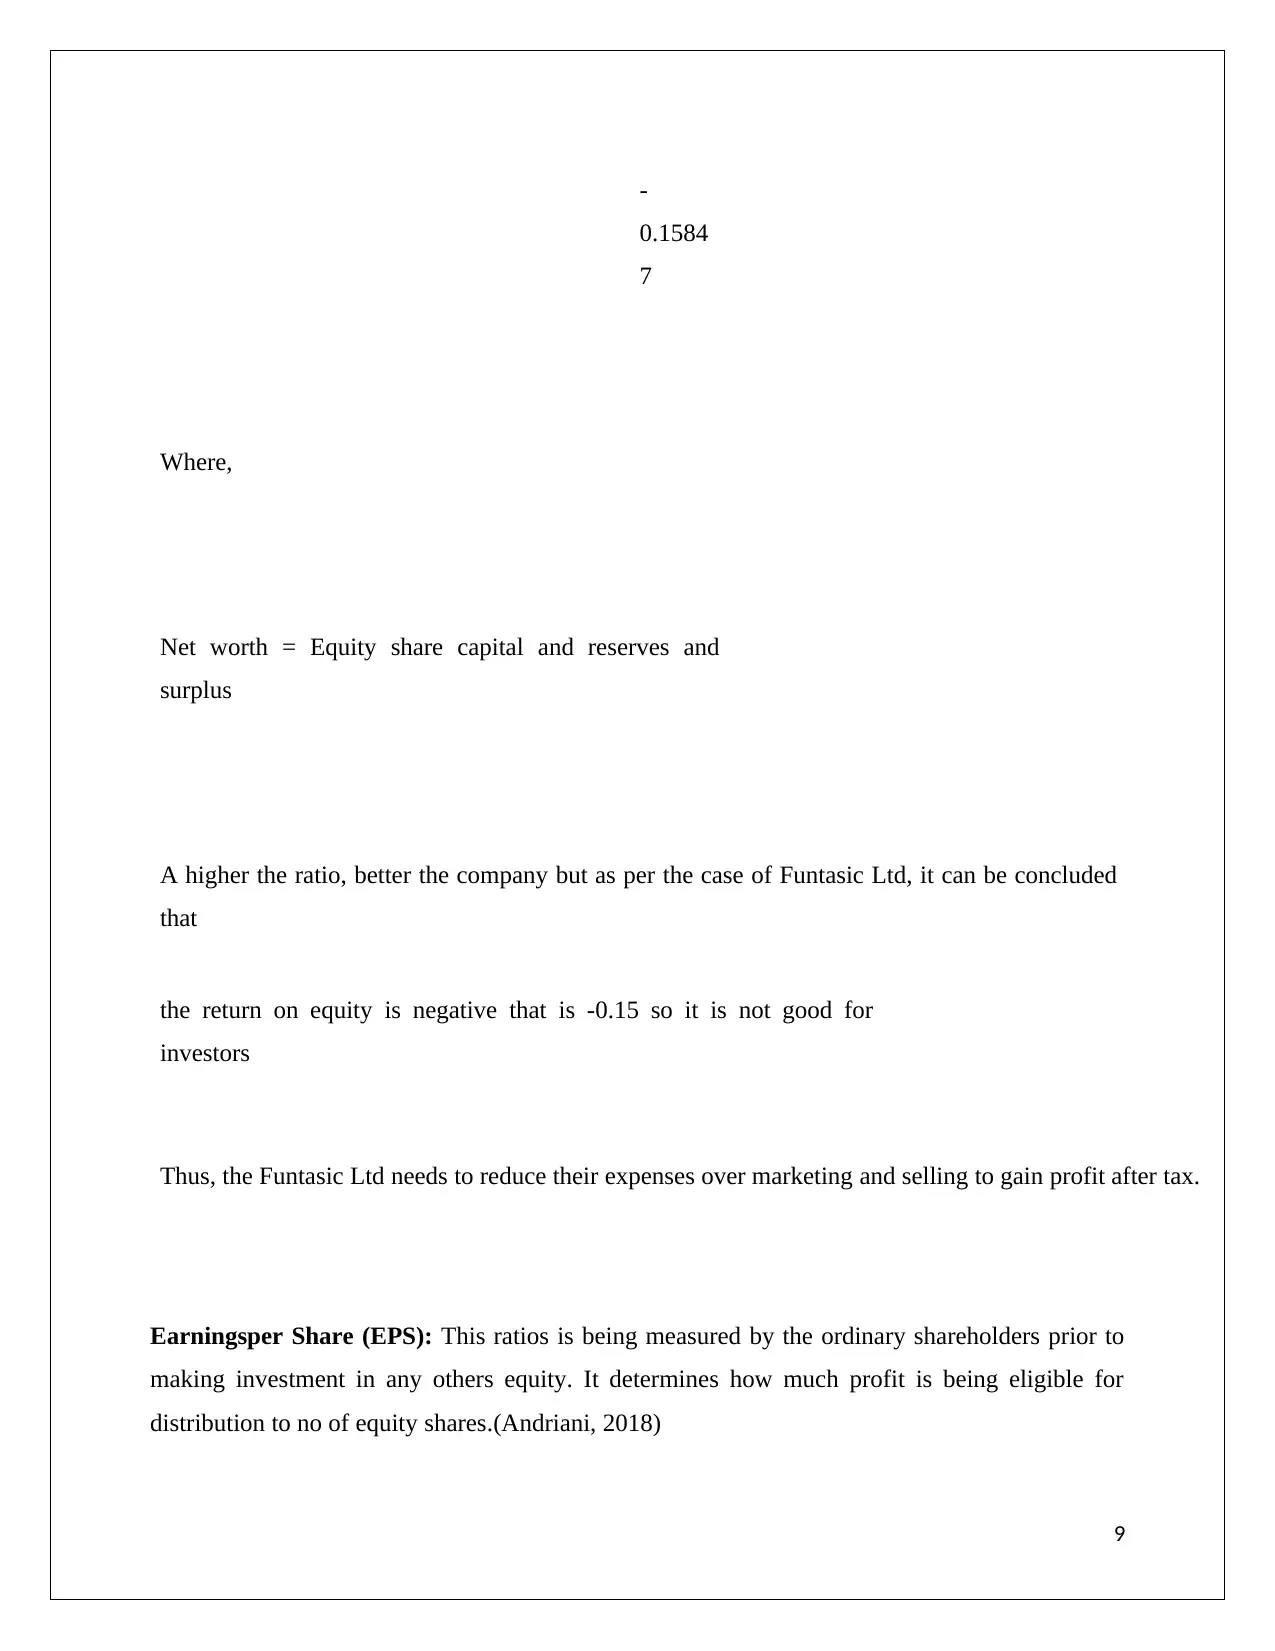
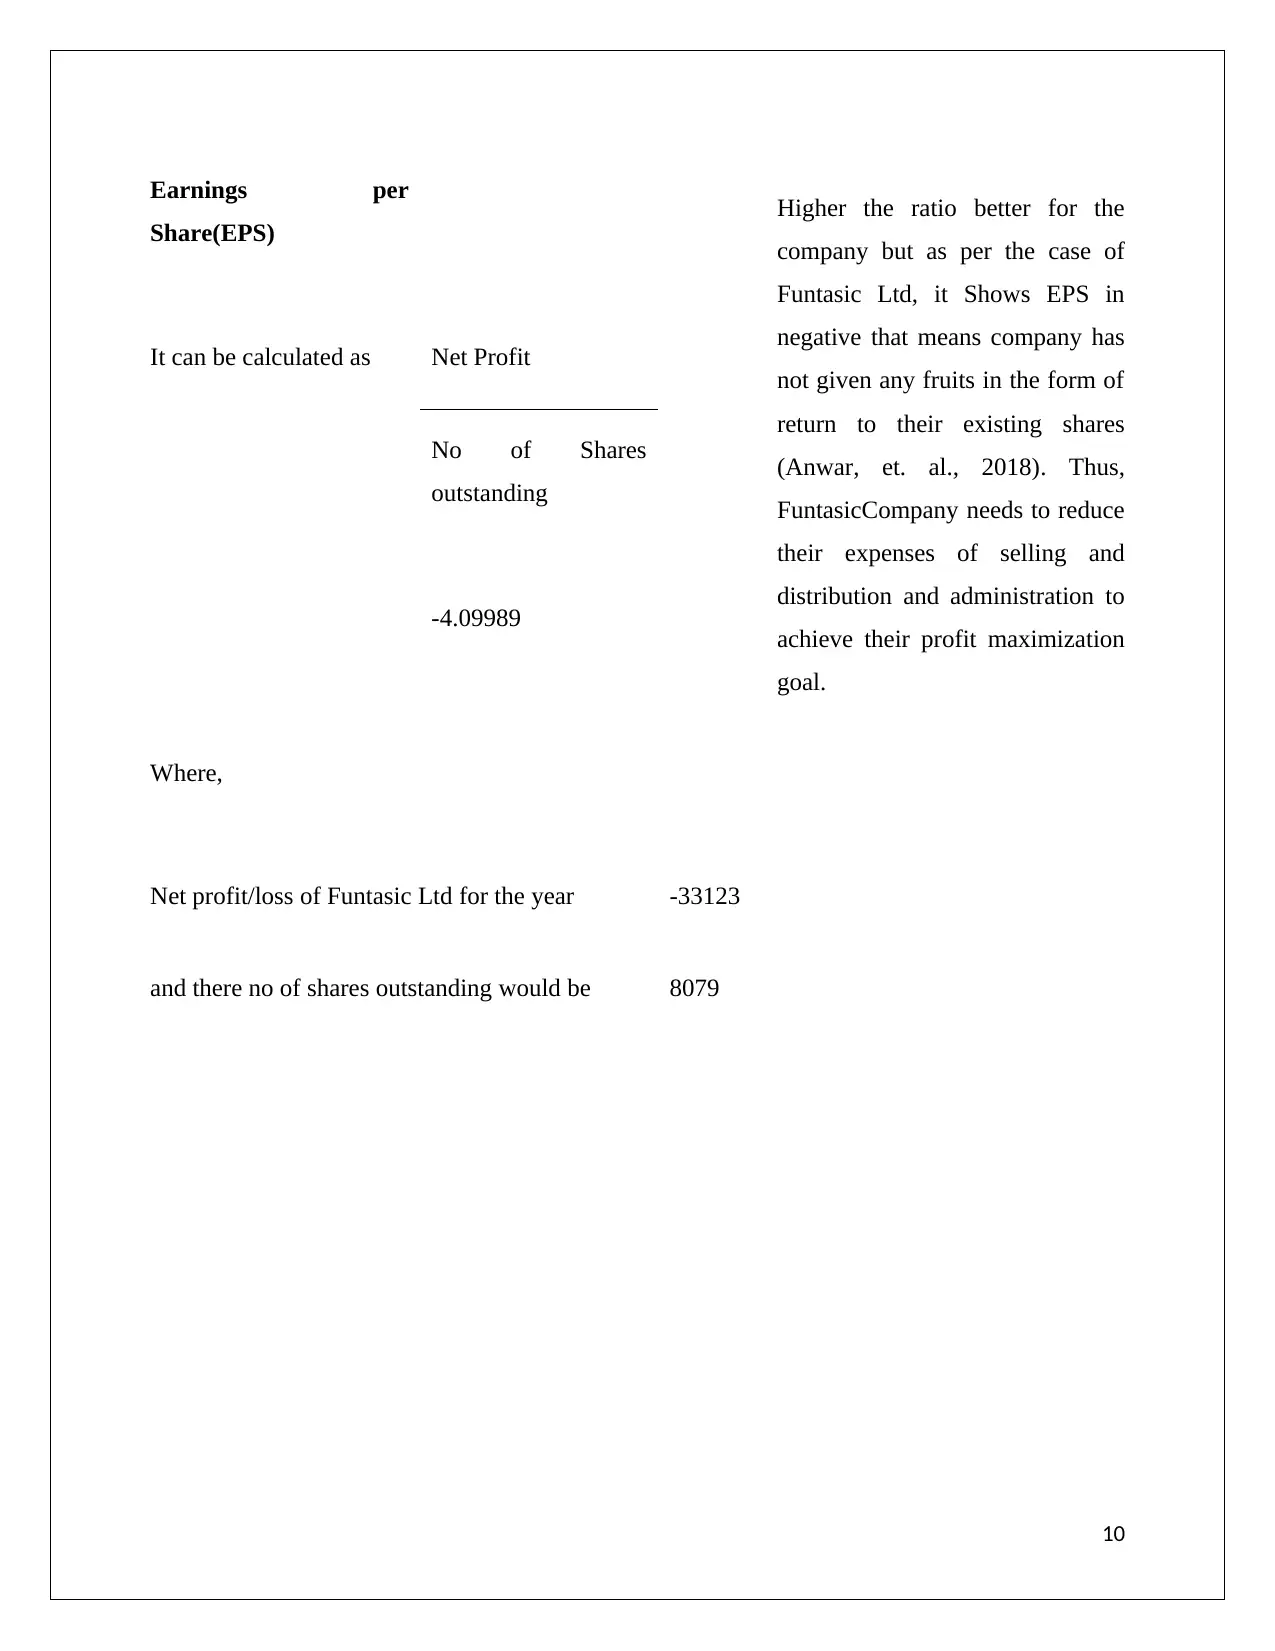
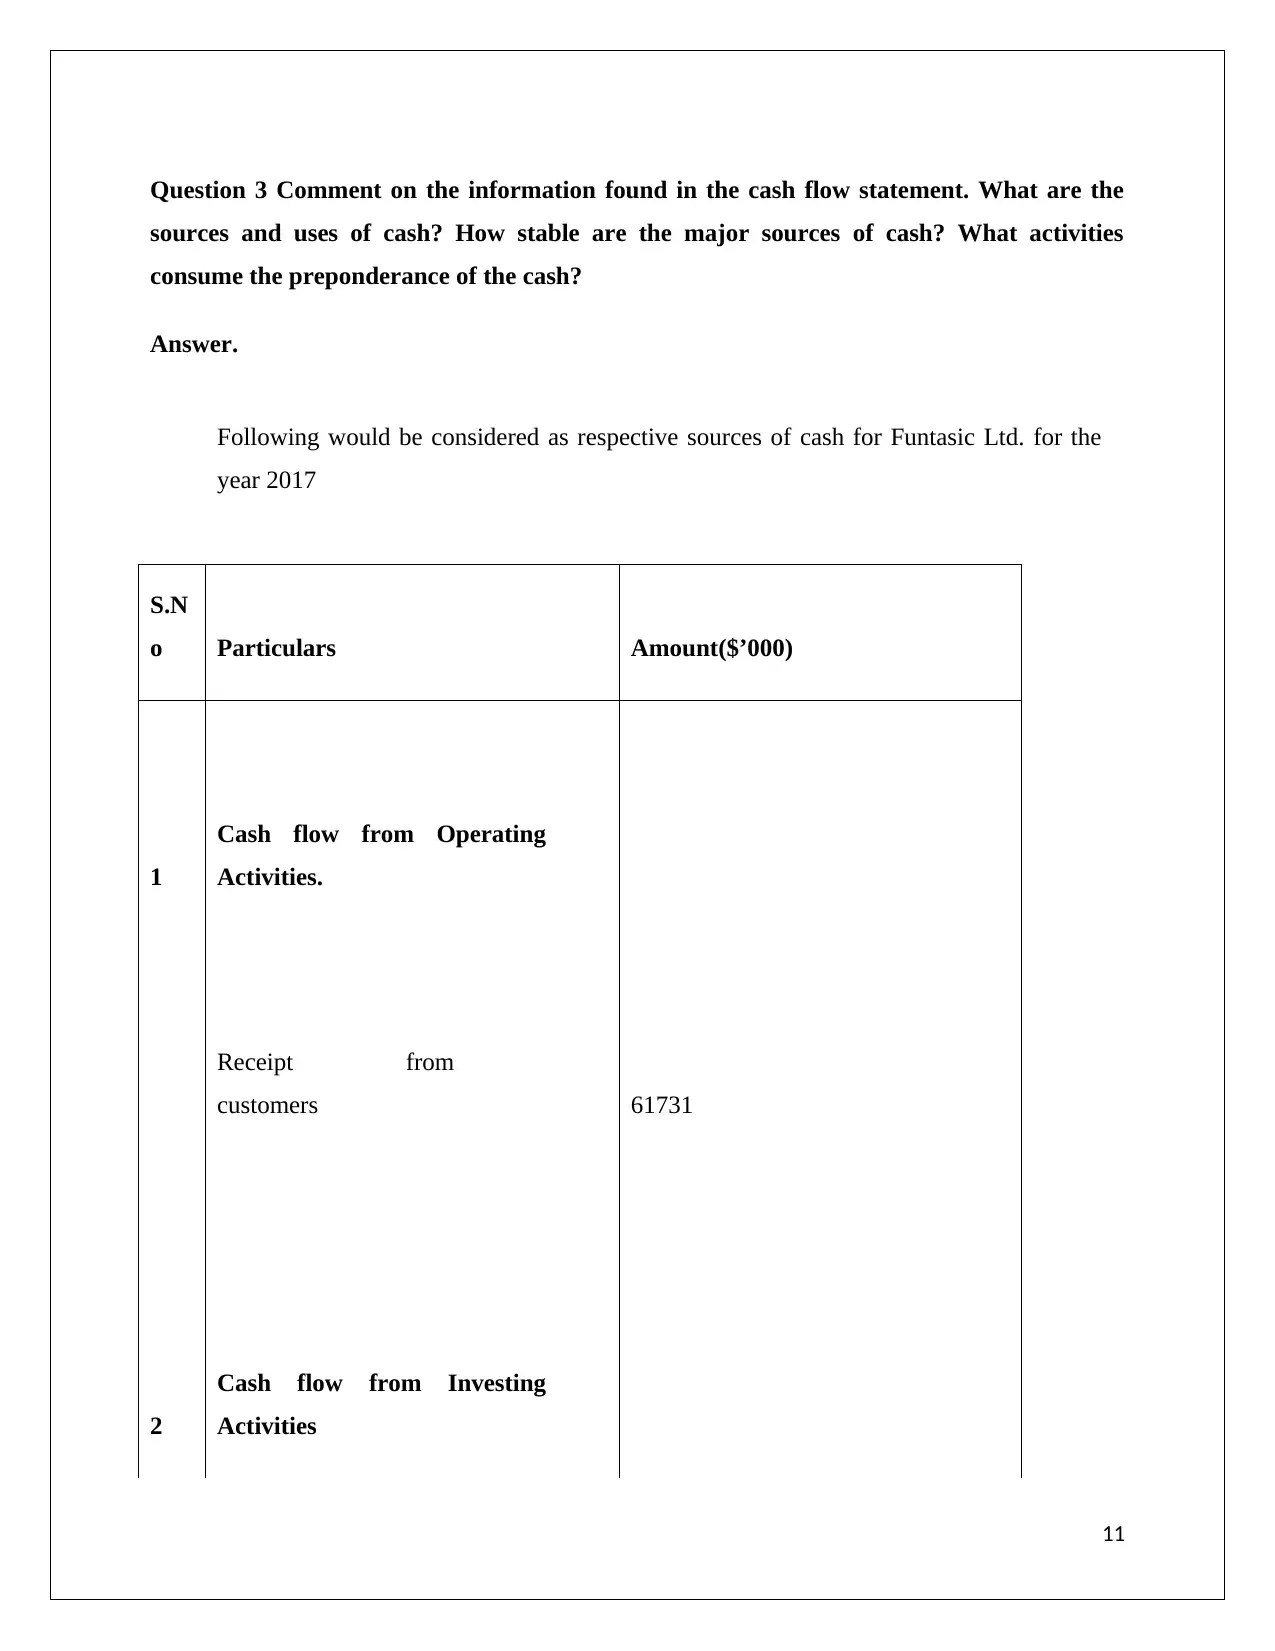
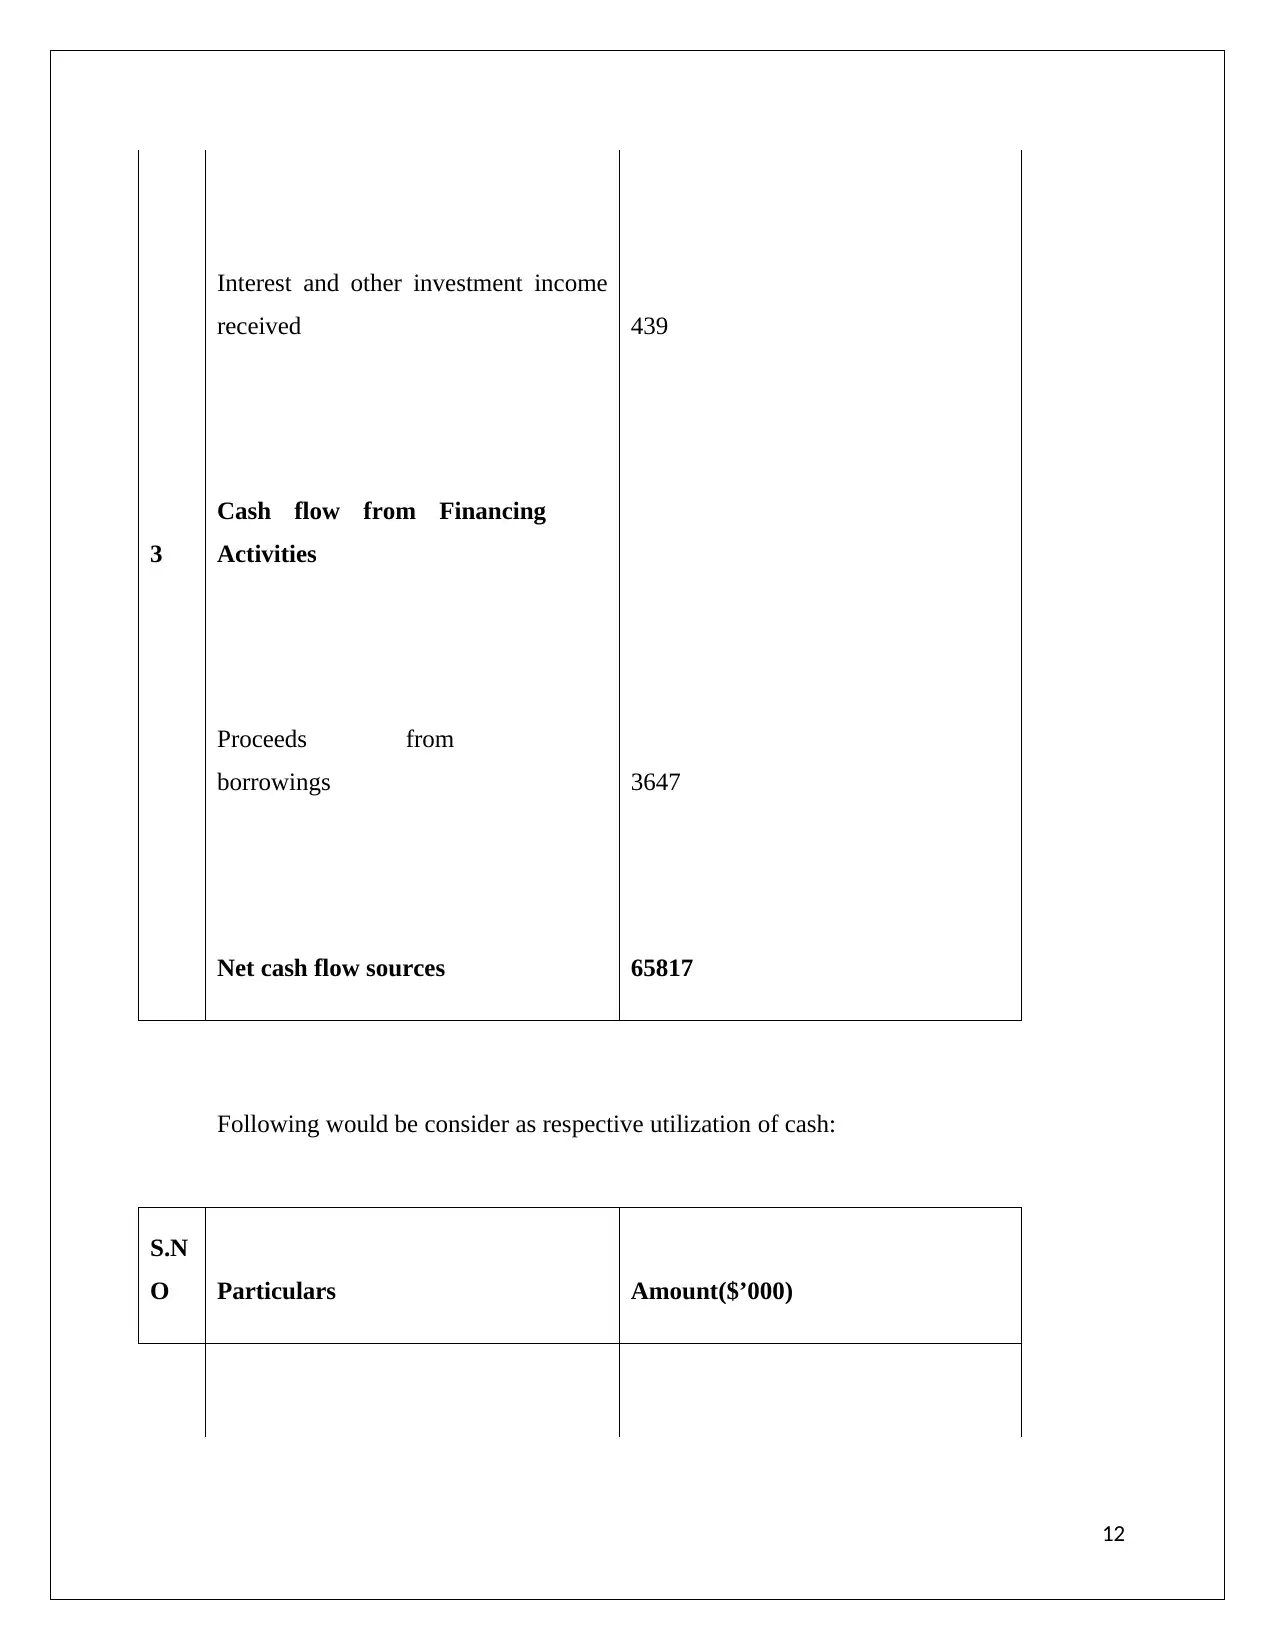
This report provides a financial analysis of Funtastic Limited, assessing its short-term and long-term financial stability, profitability for shareholders, and cash flow statement. Key ratios such as the current ratio, debt-equity ratio, return on equity (ROE), and earnings per share (EPS) are calculated and interpreted to determine the company's financial health. The analysis identifies weaknesses in short-term stability and profitability, leading to a recommendation against investing in the company due to negative ROE and EPS, and concerning current ratio. The report also examines the sources and uses of cash, highlighting the preponderance of cash consumption by payments to suppliers and employees. Desklib offers more solved assignments for students.

ASSIGNMENT
1
1
Secure Best Marks with AI Grader
Need help grading? Try our AI Grader for instant feedback on your assignments.

Table of Contents
Question 1........................................................................................................................................3
Question 2........................................................................................................................................6
Question 3........................................................................................................................................9
Question 4......................................................................................................................................12
References:....................................................................................................................................13
2

Questions
Question 1 Comment on the company’s short term and long term financial stability.
Calculate any two ratios you deem most relevant. Suggest courses of action where ratios
are/ are unfavorable.
Answer.Short term financial stability is the short term goal of the organization and provides core
layer or primary stage to achieve long term financial stability of next stage.(Morgan and
Pontines, 2018)
Short term financial stability ofFuntasic Limited has been judged on the basis of Liquidity ratio
especially current ratio determined by dividing current asset with current liabilities (Graham, and
Harvey, 2018).
Following information has been received as per the Annual Report of Funtasic Limited as at 31st July2017
Current Liabilities
Amount($’000
) Current Assets
Amount($’000
)
Trade payables 9213 Cash 664
Interest bearing Liabilities 24597 Receivables 2532
Bill Finance 27965 Inventories 7010
Provisions 671 Other Assets 2744
3

Tax Liabilities 117
Assets Classified as held
for sale* 1653
Other Financial Liabilities 87
Other Liabilities 5417
Liabilities classified as held for
sale** 1895
Total Current Liabilities 69962 Total Current Assets 14603
Short Term Financial Stability Ratio of Funtasic Limited as per the Annual Report of July,2017
Current Ratio : Current Assets
Current Liabilities
0.208727595
.
Note:
* Asset classified as held for sale would be consider as part of current assets
4
Secure Best Marks with AI Grader
Need help grading? Try our AI Grader for instant feedback on your assignments.

** Liabilities classified as held for sale would be consider as part of current liabilities
The above Current ratios indicate the companies’ ability to pay its short term liabilities. It
should be at least greater than 1 that means companies have the ability to pay current liabilities.
(Gagah ., et. al. 2018)
But as per the Funtasic Ltd data , it shows their current ratio of 0.20 ( Less than 1)
To get recovery from short term financial instability, Funtasic Ltd must have to either paying down their
Debts get their receivables faster as quick as possible or converting their short term borrowing into Long
term borrowing (Graham, and Harvey, 2018).
Long term financial stability of Funtasic Ltd has been judged on the basis of debt- equity ratio by
dividing their debt with equity. It can be consider as safer if it has low debt equity ratio that
means company has higher proportion of own capital.(Koskinen and Laakkonen , 2018)
Details of debt and equity of Funtasic Ltd given
below:
Debts Amount ($’000) Equity Amount($’000)
5

Other Liabilities* 101 Issued Capital 209483
Total Debt 101 Total Equity 209483
Note:
Other liabilities consider as long term borrowings of Funtasic Ltd
Debt/Equity ratio: Debt
Equity
0.000482139
It can be concluded that Funtasic Ltd gets faith towards owner capital rather than long
termborrowing
It is being considered as favorable as company as low risk of paying borrowed amount with fixed interest
6

rate.
Question 2 Comment on the company’s profitability for its shareholders. Calculate any two
ratios you deem most relevant. Suggest courses of action where ratios are/ are unfavorable.
Answer. Shareholders prior to making any investment on any company shares. They outlook
towards profitability ratios that works on financial metrics to show how well company improvise
their earnings with their associated expenses.
Following two profitability ratios are used to indicate the financial performance of Funtasic ltd as
below:
ROE (Return on Equity): It is the most commonly used profitability ratio by investors to
calculate how much return is earned by the company with respect to the equity investment of the
shareholders.(Graham and Harvey, 2018)
Equity share capital of Funtasic Ltd. as per Financial Statement as at 31st July,2017
Particulars Amount($’000)
Issued Capital 209483
Add: Reserves and surplus -470
7
Paraphrase This Document
Need a fresh take? Get an instant paraphrase of this document with our AI Paraphraser

Net Worth 209013
Profit after tax of Funtasic Ltd as per their Profit and Loss Statement as on 31st
July,2017
Profit/Loss after tax -33123
Return on Equity
(ROE) :
It can be calculated as: Profit After Tax
Net worth
8
Profit after tax of Funtasic Ltd as per their Profit and Loss Statement as on 31st
July,2017
Profit/Loss after tax -33123
Return on Equity
(ROE) :
It can be calculated as: Profit After Tax
Net worth
8

-
0.1584
7
Where,
Net worth = Equity share capital and reserves and
surplus
A higher the ratio, better the company but as per the case of Funtasic Ltd, it can be concluded
that
the return on equity is negative that is -0.15 so it is not good for
investors
Thus, the Funtasic Ltd needs to reduce their expenses over marketing and selling to gain profit after tax.
Earningsper Share (EPS): This ratios is being measured by the ordinary shareholders prior to
making investment in any others equity. It determines how much profit is being eligible for
distribution to no of equity shares.(Andriani, 2018)
9

Higher the ratio better for the
company but as per the case of
Funtasic Ltd, it Shows EPS in
negative that means company has
not given any fruits in the form of
return to their existing shares
(Anwar, et. al., 2018). Thus,
FuntasicCompany needs to reduce
their expenses of selling and
distribution and administration to
achieve their profit maximization
goal.
10
Earnings per
Share(EPS)
It can be calculated as Net Profit
No of Shares
outstanding
-4.09989
Where,
Net profit/loss of Funtasic Ltd for the year -33123
and there no of shares outstanding would be 8079
Secure Best Marks with AI Grader
Need help grading? Try our AI Grader for instant feedback on your assignments.

Question 3 Comment on the information found in the cash flow statement. What are the
sources and uses of cash? How stable are the major sources of cash? What activities
consume the preponderance of the cash?
Answer.
Following would be considered as respective sources of cash for Funtasic Ltd. for the
year 2017
S.N
o Particulars Amount($’000)
1
Cash flow from Operating
Activities.
Receipt from
customers 61731
2
Cash flow from Investing
Activities
11

Interest and other investment income
received 439
3
Cash flow from Financing
Activities
Proceeds from
borrowings 3647
Net cash flow sources 65817
Following would be consider as respective utilization of cash:
S.N
O Particulars Amount($’000)
12
received 439
3
Cash flow from Financing
Activities
Proceeds from
borrowings 3647
Net cash flow sources 65817
Following would be consider as respective utilization of cash:
S.N
O Particulars Amount($’000)
12

1
Cash flow from operating
Activities
Payment to suppliers and
employees 60897
Income taxes
paid 25
Interest and other cost of finance 3559
2
Cash flow from Investing
Activities
Payment for Plant and
equipment 888
13
Cash flow from operating
Activities
Payment to suppliers and
employees 60897
Income taxes
paid 25
Interest and other cost of finance 3559
2
Cash flow from Investing
Activities
Payment for Plant and
equipment 888
13
Paraphrase This Document
Need a fresh take? Get an instant paraphrase of this document with our AI Paraphraser

Payment for other intangible
assets 540
3
Cash flow from Financing
Activities Nil
Net cash flow
utilization 65909
Receipt from customers, Interest and other investment income received and proceeds from
borrowing are the most stable income sources of Funtasic Ltd from previous year (2016) to
current year (2017).
Payment to suppliers and employees are the most expensive category of utilization of cash.
14

Question 4Would you invest your personal or corporate assets in the company? Why or
Why not? Discuss how you can use your evaluation of financial statements for your
decision-making as well as limitations.
Answer. As an investor, I will not prefer to utilize my personal as well as corporate asset as an
investment to the Funtasic Ltd due to the following reasons.
1. There short term financial stability is very weak as indicated in current ratio of just 0.20
which is being is lesser than 1 that means Funtasic Ltd is not able to meet out their day to
day working capital requirement (Anwar, et. al., 2018).
2. Funtasic Ltd. suffered from losses from last 2 years i.e. Current year Loss is (33123)
whereas previous year loss is (23478).
3. Return on Equity (ROE) is negative i.e. -0.15.
4. Earnings per share (EPS) of Fantastic Ltd are -4.09 that means it will not give any returns
to their existing shareholders.
15

References:
Andriani, R., 2018 PENGARUH DEBT TO EQUITY RATIO (DER), EARNING PER
SHARE (EPS) DAN RETURN ON ASSETS (ROA) TERHADAP HARGA SAHAM
PADA PERUSAHAAN MANUFAKTUR YANG TERDAFTAR DI BURSA EFEK
INDONESIA (BEI) TAHUN 2013-2016 (Doctoral dissertation,
UniversitasMuhammadiyahSidoarjo)
Anwar, S., Fathoni, A. and Gagah, E., 2018. ANALYSIS OF THE EFFECT OF
CURRENT RATIO, TOTAL TURN OVER ASSETS, DEBT TO EQUITY RATIO AND
NET PROFIT MAGRIN ON CHANGES OF PROFIT WITH ON EQUITY RETURN
AS INTERVENING VARIABLES ON PHARMACEUTICAL COMPANIES LISTED
IN INDONESIA STOCK EXCHANGE (BEI) 2013-2017 PERIOD. Journal of
Management, 4(4).
Graham, J.R. and Harvey, C.R., 2018. The equity risk premium in 2018.
Koskinen, K. and Laakkonen, H., 2018. Repricing of securities markets’ risk premia still
most significant threat to global financial stability.
Morgan, P.J. and Pontines, V., 2018. Financial stability and financial inclusion: The case
of SME lending. The Singapore Economic Review, 63(01), pp.111-124.
16
1 out of 16
Related Documents

Your All-in-One AI-Powered Toolkit for Academic Success.
+13062052269
info@desklib.com
Available 24*7 on WhatsApp / Email
Unlock your academic potential
© 2024 | Zucol Services PVT LTD | All rights reserved.