ACCT868: Kathmandu Holdings Financial Statement Analysis Report
VerifiedAdded on 2023/04/22
|17
|3433
|356
Report
AI Summary
This report provides a financial analysis of Kathmandu Holdings Limited, an Australian-based company dealing in travel equipment exported to New Zealand. The analysis includes ratio analysis, share price movements, and dividend policy evaluations. The report compares the company's current share price with previous years, revealing volatile share trend lines that exceed market returns. Recommendations are offered to address shortcomings and improve business operations. Key areas assessed include profitability ratios (EBITDA, net profit ratio, gross profit ratio), liquidity (current ratio, quick ratio), financial structure (debt and equity), share price movement compared to the All Ords Index, and dividend policy. The analysis indicates increasing return on equity but highlights concerns about net profit margins and operating expenses. The report suggests strategies for improving P/E ratio and earnings per share, and concludes that while the company maintains a stable debt-to-equity ratio, improvements are needed in liquidity and market value ratios.

Running Head: KATHMANDU HOLDINGS 0
Kathmandu Holdings
Kathmandu Holdings
Paraphrase This Document
Need a fresh take? Get an instant paraphrase of this document with our AI Paraphraser
KATHMANDU HOLDINGS 1
Executive Summary
Kathmandu Holdings Limited is the Australian based company which is dealing in the travel
based equipment and the same are exported in the New Zealand. This report is basically made to
determine the financial analysis of the Kathmandu holdings on the basis of the ratio analysis the
share price movements and according to the dividend policy. The currents share price of the
company is compared with the previous years and the results state that the share trend lines of
the company are volatile, more volatile than the market returns. Also the recommendations are
provided to the company to rectify there mistakes and focus their attention on the sick areas of
the business operations.

KATHMANDU HOLDINGS 2
Table of Contents
Executive Summary.........................................................................................................................1
Introduction......................................................................................................................................3
Profitability Ratios...........................................................................................................................3
Liquidity.......................................................................................................................................6
Financial structure...........................................................................................................................7
Share Price Movement.....................................................................................................................8
Dividend Policy.............................................................................................................................10
Conclusion and Recommendations................................................................................................11
References......................................................................................................................................12
⊘ This is a preview!⊘
Do you want full access?
Subscribe today to unlock all pages.
Trusted by 1+ million students worldwide

KATHMANDU HOLDINGS 3
Introduction
Kathmandu Holdings Limited is a transnational chain of retail stores and selling the
travel adventure and the outdoor apparels, and also the necessary equipment’s. The Kathmandu
holdings are a leading retailer for the equipment’s of the travel and the adventure. Presently the
stores are situated in 163 stores at the end of the July 2017. The chief executive officer of the
Kathmandu Holdings is Xavier Simonet yet it was founded by the JOHN Pawson and Jan
Cameron in 1987. The company first set up all of its first outlets in Australia and manufacturing
the maximum clothes in the New Zealand. Currently the income of the company is NZ$34
million against the revenue of NZ$445.35 million. The company has its headquarters at
Christchurch, New Zealand (Kathmandu Holdings, 2018).
In the year 2006, the company is fully acquired by Australian Private Equity for NZ$275
million. Further in the year 2018, the Kathmandu acquired Oboz Footwear in March 2018. Oboz
is a footwear brand based in the Montana USA.
Profitability Ratios
The profitability ratios of the company are calculated to analyze the final performance of
the company along with the earnings per share which are left for the investors and the
shareholders. The major ratios that form the part of the profitability ratios are the EBITDA, net
profit ratio, gross profit ratio and from the point of view of the brokers all these ratios are of
critical and core importance as the major earnings of the brokers are dependent on the
profitability ratios of the company.
Paraphrase This Document
Need a fresh take? Get an instant paraphrase of this document with our AI Paraphraser

KATHMANDU HOLDINGS 4
2015 2016 2017 2018
0.00%
20.00%
40.00%
60.00%
80.00%
100.00%
120.00%
140.00%
Profitability ratios
Gross Profit Ratio
Return on Equity
Net Profit
(Source: By Author)
From the graph above and the table below the performance of the company can be
reflected as to increase in the return on equity which is the positive impact on the performance of
the company and the shareholders and the brokers are getting a good return on the investments
made, furthermore the net profit of the company is not even 20% of the net sales over the period
of the four years. Though the position improved a bit as it can be seen from the table yet the
company needs to cut down the operating expenses and other irrelevant costs that are creating
the havoc for the company. Henceforth it is advised to the company to get rid of the unwanted
costs immediately to give the return towards the shareholders (Kathmandu Holdings, 2018).
Return on equity is the ratio that determines the returns received by the shareholders and
the investors against the investments made by them. The report also suggests the fact that the
return on equity where the return on equity is increasing in comparison to the year 2015 to 2018.
The performance of the company is sound in terms of the return on equity.

KATHMANDU HOLDINGS 5
Profitability
2015 2016 2017 2018
Gross Profit Ratio
Gross Profit * 100 6.15% 6.26% 6.20% 6.34%
Net Sales
Return on Equity
Net Income 65% 108% 117% 120%
Equity Shareholders
Net Profit
Net Profit Ratio *
100 4.99% 7.88% 8.55% 10.16%
Net Sales
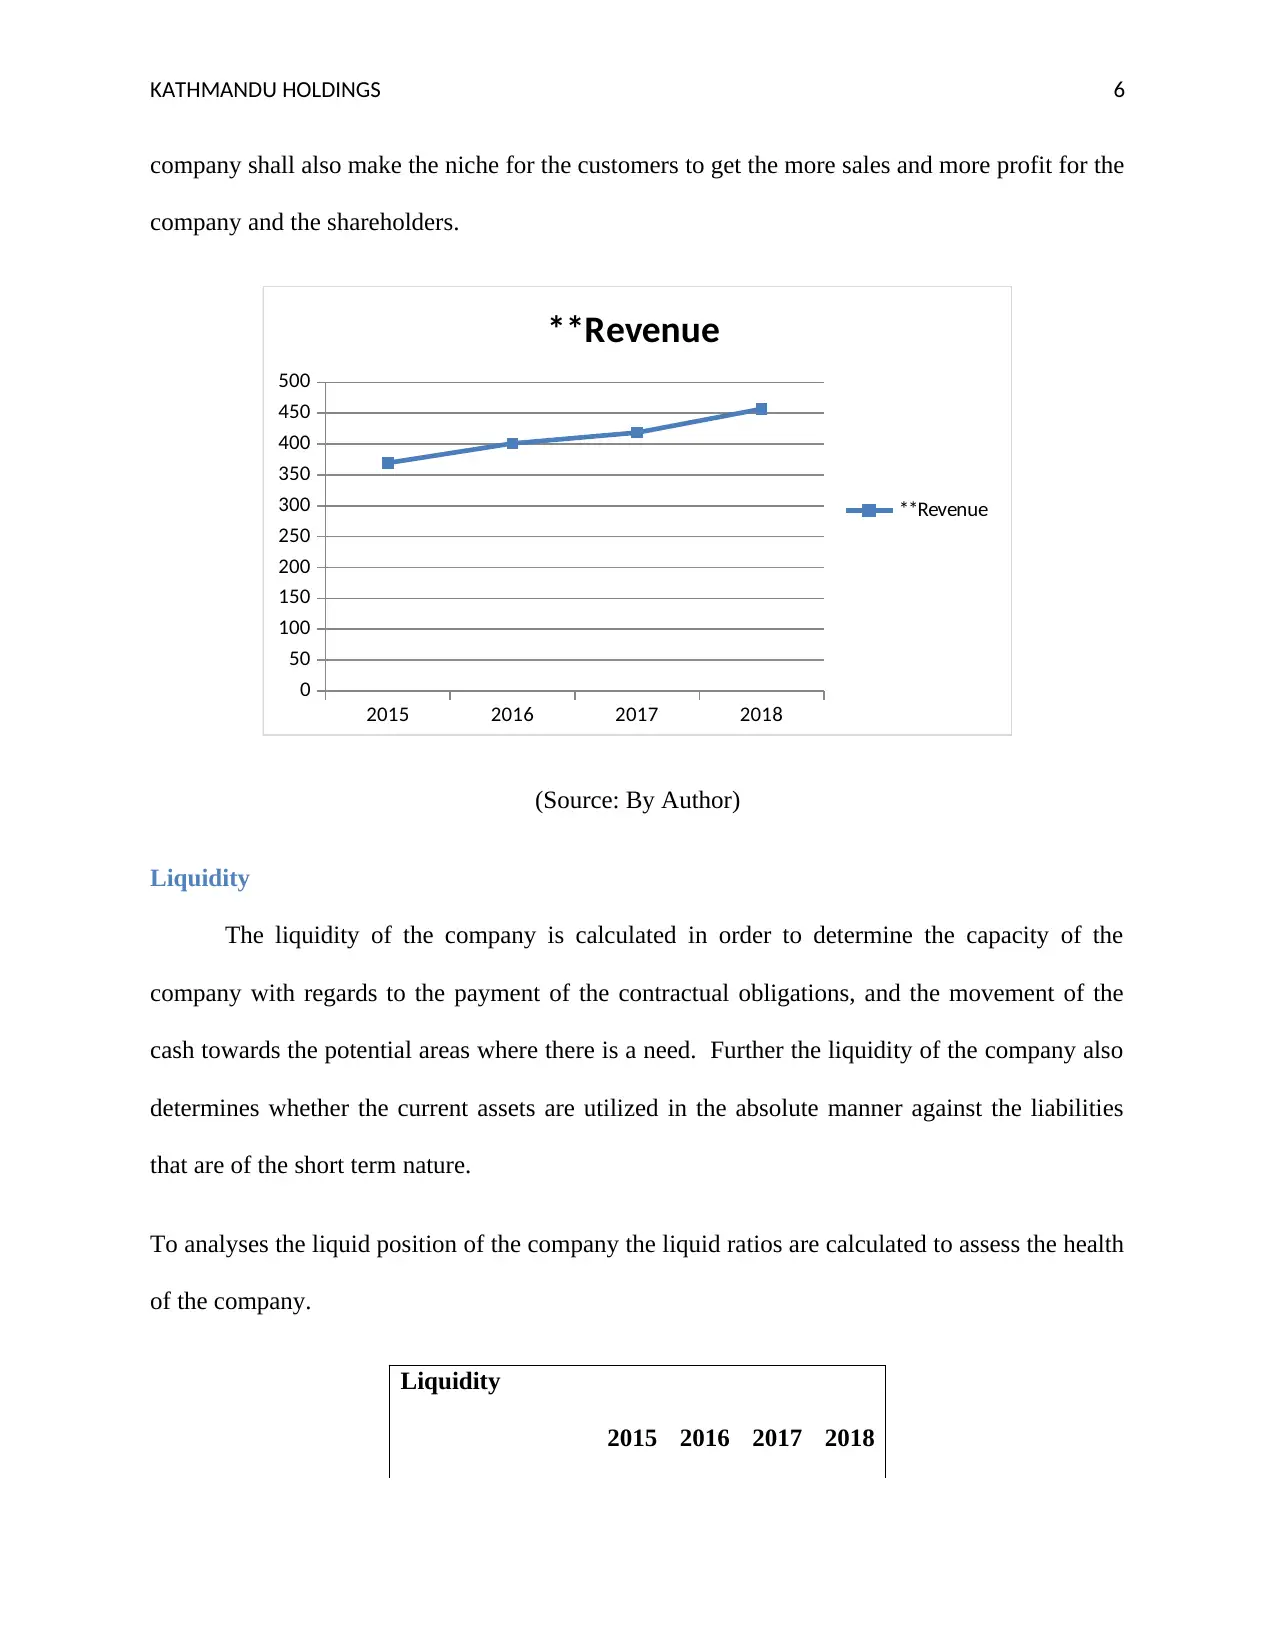
**Revenue 369.57 401.16 418.64 456.99
Revenue is the major class that determines the position of the business in terms of the
number of products sold or the services provided to the clients and the customers on the basis of
the monetary value. The revenue of the company can be observed form the relevant graphical
representation and it indicates that the revenue of the company is consistently increasing but
increasing with the slow pace as compared over the period of four years from 2015 to 2018. For
the purpose of better understanding the graphical representation is also presented below. To
increase the revenue of the company shall increase the sales in the diversified range. The
Profitability
2015 2016 2017 2018
Gross Profit Ratio
Gross Profit * 100 6.15% 6.26% 6.20% 6.34%
Net Sales
Return on Equity
Net Income 65% 108% 117% 120%
Equity Shareholders
Net Profit
Net Profit Ratio *
100 4.99% 7.88% 8.55% 10.16%
Net Sales
**Revenue 369.57 401.16 418.64 456.99
Revenue is the major class that determines the position of the business in terms of the
number of products sold or the services provided to the clients and the customers on the basis of
the monetary value. The revenue of the company can be observed form the relevant graphical
representation and it indicates that the revenue of the company is consistently increasing but
increasing with the slow pace as compared over the period of four years from 2015 to 2018. For
the purpose of better understanding the graphical representation is also presented below. To
increase the revenue of the company shall increase the sales in the diversified range. The
⊘ This is a preview!⊘
Do you want full access?
Subscribe today to unlock all pages.
Trusted by 1+ million students worldwide
KATHMANDU HOLDINGS 6
company shall also make the niche for the customers to get the more sales and more profit for the
company and the shareholders.
2015 2016 2017 2018
0
50
100
150
200
250
300
350
400
450
500
**Revenue
**Revenue
(Source: By Author)
Liquidity
The liquidity of the company is calculated in order to determine the capacity of the
company with regards to the payment of the contractual obligations, and the movement of the
cash towards the potential areas where there is a need. Further the liquidity of the company also
determines whether the current assets are utilized in the absolute manner against the liabilities
that are of the short term nature.
To analyses the liquid position of the company the liquid ratios are calculated to assess the health
of the company.
Liquidity
2015 2016 2017 2018
Paraphrase This Document
Need a fresh take? Get an instant paraphrase of this document with our AI Paraphraser

KATHMANDU HOLDINGS 7
Current ratio
Current Assets 2.90 1.79 1.47 1.53
Current Liabilities
Quick Ratio
Quick Assets 0.24 0.30 0.18 0.09
Current Liabilities
Current ratio: The current ratio of the company is basically the liquid ratio that determines the
current assets and the current liabilities of the company. The main aim or the agenda for
calculating the current ratio is to gain the knowledge of the fact that the current assets are
sufficient or not to set off the current liabilities. The current ratio of the company is sound and
therefore the liquidity position in terms of the current ratio is sound in the year 2015 but
gradually decreased from 2.90 in the year 2015 to 1.53.
Quick ratio on the other hand is the ratio which indicates the acidity of the ratio. This ratio is
also known as the acid ratio because it showcases how well the company converts the assets into
the cash and uses the cash for the payment of the short term expenses. The quick ratio of the
company is low and it shall improve to reach till 1 as it will give the advantage to the company
and improve the cash conversion cycle of the company (Jacob & Michaely, 2017).
Market Value Ratios
2015 2016 2017 2018
P/E Ratio
Market Value 120.7 94.9 109.5 105.0

KATHMANDU HOLDINGS 8
EPS
Earnings Per Share
Net Income 0.010 0.017 0.019 0.025
Weighted Average Outstanding
Shares
The market value of the Kathmandu Limited discloses the earnings per share and the P/E
ratio of the Kathmandu holdings limited. Thereafter the situation from the perspective of the
broker is satisfactory as the earnings per share are low as compared to the ideal ratio. Moreover
the income tax payments are high in the company as can be observed form the annual reports and
the operating expenses are also building their castle against the slow aced revenue, hence the
market value ratios of the company are not sound and therefore, the company shall improve the
P/E ratio and the earnings per share by buy back of share which will reduce the denominator
value and gives a boost to the ratio. Since P/E ratio gives a better sense to the value of the
company and also it acts as the key element for the investors because the investors wants to
invest in the financially sound companies only. The earnings per share of the company from the
year 2015 to 2018 (Detzel & Strauss, 2017).
Financial structure
Capital structure of the company is basically determined through the financing of the debt
and the equity and this proportion of the debt and the equity and the weights are calculated
according to the total value of the debt and the equity (Friederich & Payne, 2015).
⊘ This is a preview!⊘
Do you want full access?
Subscribe today to unlock all pages.
Trusted by 1+ million students worldwide
KATHMANDU HOLDINGS 9
Capital
structure
Kathmandu Holdings Limited
2015 2016 2017 2018
WEIGH
TS
WEIGH
TS
WEIGH
TS
WEIGH
TS
DEBT
11713
7 37%
1041
20 34%
1119
67 36%
1942
35 44%
EQUITY
20019
1 63%
2001
91 66%
2002
09 64%
2498
82 56%
31732
8 100%
3043
11 100%
3121
76 100%
4441
17 100%
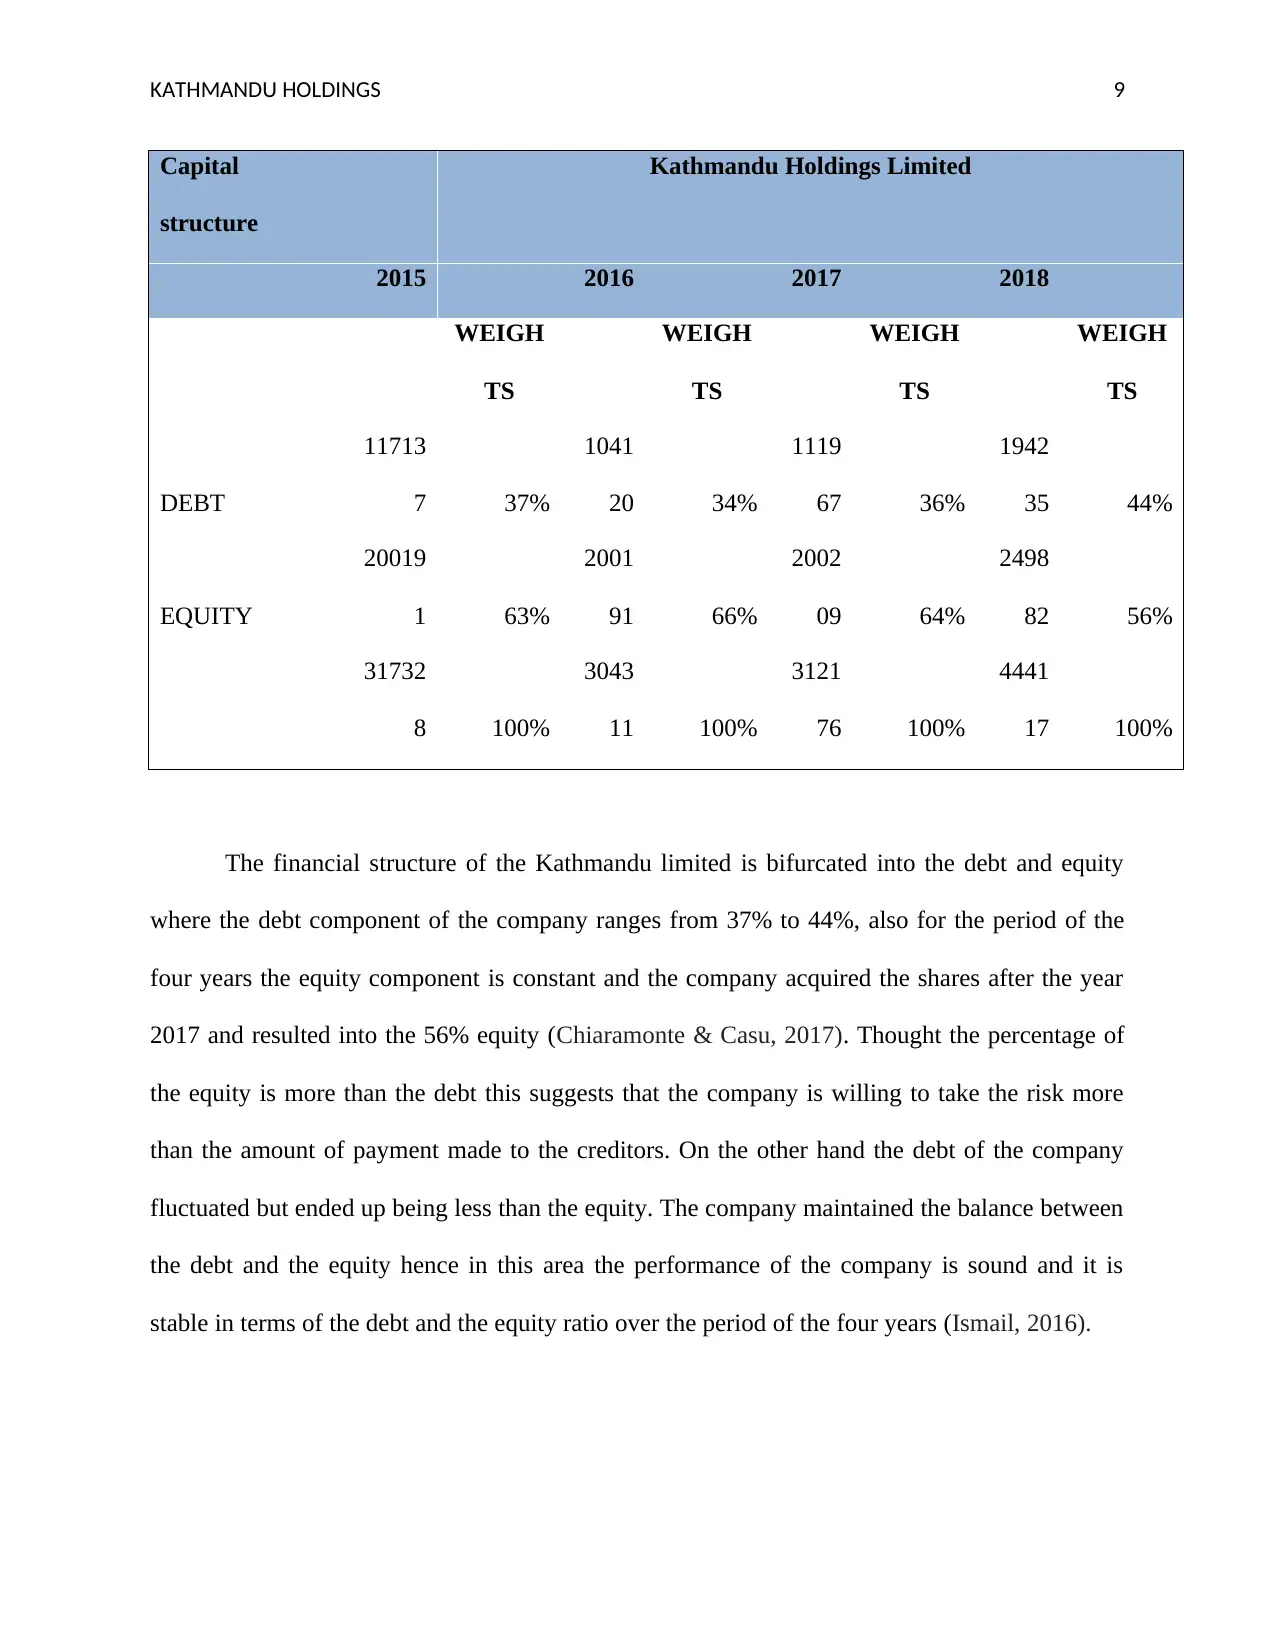
The financial structure of the Kathmandu limited is bifurcated into the debt and equity
where the debt component of the company ranges from 37% to 44%, also for the period of the
four years the equity component is constant and the company acquired the shares after the year
2017 and resulted into the 56% equity (Chiaramonte & Casu, 2017). Thought the percentage of
the equity is more than the debt this suggests that the company is willing to take the risk more
than the amount of payment made to the creditors. On the other hand the debt of the company
fluctuated but ended up being less than the equity. The company maintained the balance between
the debt and the equity hence in this area the performance of the company is sound and it is
stable in terms of the debt and the equity ratio over the period of the four years (Ismail, 2016).
Capital
structure
Kathmandu Holdings Limited
2015 2016 2017 2018
WEIGH
TS
WEIGH
TS
WEIGH
TS
WEIGH
TS
DEBT
11713
7 37%
1041
20 34%
1119
67 36%
1942
35 44%
EQUITY
20019
1 63%
2001
91 66%
2002
09 64%
2498
82 56%
31732
8 100%
3043
11 100%
3121
76 100%
4441
17 100%
The financial structure of the Kathmandu limited is bifurcated into the debt and equity
where the debt component of the company ranges from 37% to 44%, also for the period of the
four years the equity component is constant and the company acquired the shares after the year
2017 and resulted into the 56% equity (Chiaramonte & Casu, 2017). Thought the percentage of
the equity is more than the debt this suggests that the company is willing to take the risk more
than the amount of payment made to the creditors. On the other hand the debt of the company
fluctuated but ended up being less than the equity. The company maintained the balance between
the debt and the equity hence in this area the performance of the company is sound and it is
stable in terms of the debt and the equity ratio over the period of the four years (Ismail, 2016).
Paraphrase This Document
Need a fresh take? Get an instant paraphrase of this document with our AI Paraphraser

KATHMANDU HOLDINGS 10
Share Price Movement
Stock prices changes every day with respect to the changes in the market forces. The
changes in the share price are reflected by the change in the forces of the demand and supply. If
the demand is high then the selling price the stock price moves up, whereas if the cases scenario
is different than the price falls. The below graph is the representation of the Kathmandu Holdings
Limited against the All Ords Index of S & P 500. The share price of the company fluctuates due
to the various factors such as the economic, political factors and the other technical factors which
can readily affect the performance of the company. The factors affecting the performance and
stlyeof the share price (Meena & Dhar, 2016).
1/1/2015
4/1/2015
7/1/2015
10/1/2015
1/1/2016
4/1/2016
7/1/2016
10/1/2016
1/1/2017
4/1/2017
7/1/2017
10/1/2017
1/1/2018
4/1/2018
7/1/2018
10/1/2018
1/1/2019
-0.25
-0.20
-0.15
-0.10
-0.05
0.00
0.05
0.10
0.15
0.20
0.25
Kathmandu holdings Limited
Average return
All Ordinaries Index
Months
Average return
(Source: By Author)
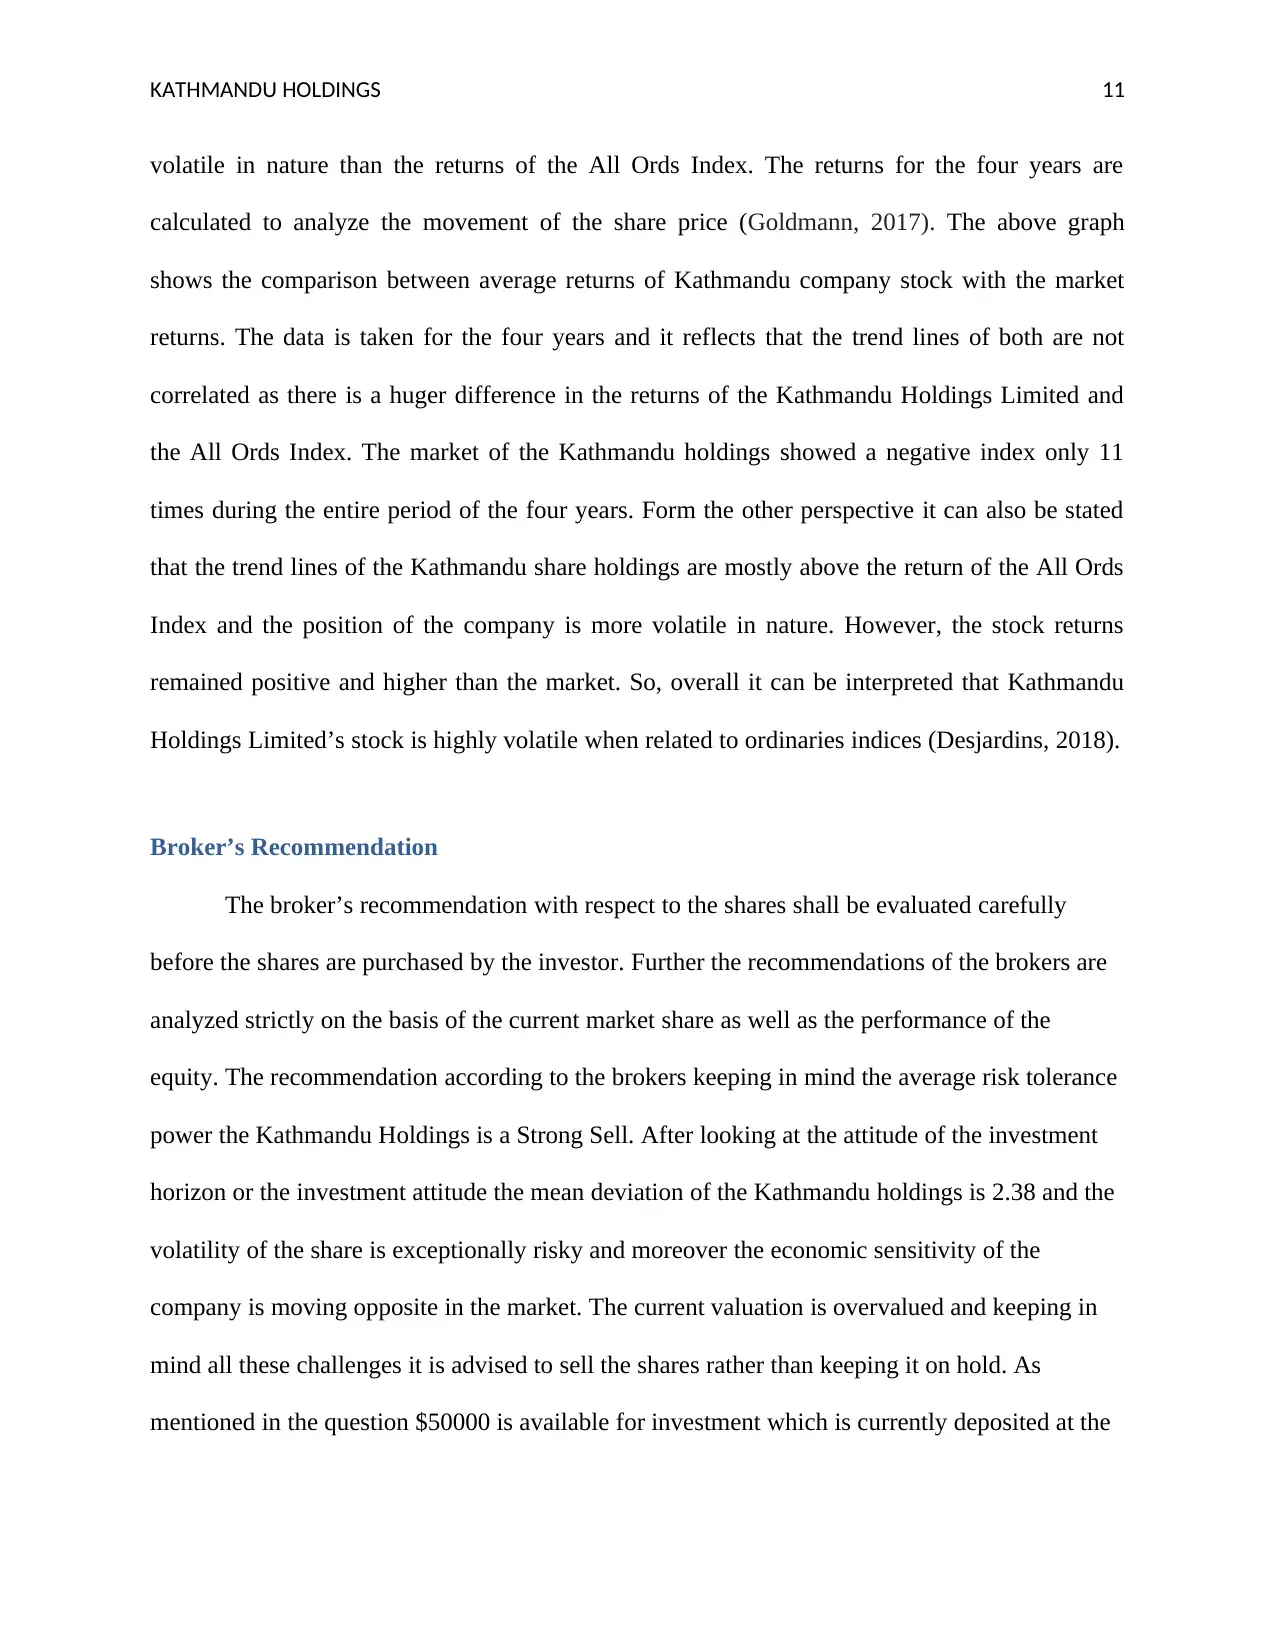
The share price movement of the Kathmandu Holdings has been analyzed with the
assistance of the graph and the calculation of the average return against the All Ords Index
reported as an appendix. The Average returns of the Kathmandu Holdings Limited are more
Share Price Movement
Stock prices changes every day with respect to the changes in the market forces. The
changes in the share price are reflected by the change in the forces of the demand and supply. If
the demand is high then the selling price the stock price moves up, whereas if the cases scenario
is different than the price falls. The below graph is the representation of the Kathmandu Holdings
Limited against the All Ords Index of S & P 500. The share price of the company fluctuates due
to the various factors such as the economic, political factors and the other technical factors which
can readily affect the performance of the company. The factors affecting the performance and
stlyeof the share price (Meena & Dhar, 2016).
1/1/2015
4/1/2015
7/1/2015
10/1/2015
1/1/2016
4/1/2016
7/1/2016
10/1/2016
1/1/2017
4/1/2017
7/1/2017
10/1/2017
1/1/2018
4/1/2018
7/1/2018
10/1/2018
1/1/2019
-0.25
-0.20
-0.15
-0.10
-0.05
0.00
0.05
0.10
0.15
0.20
0.25
Kathmandu holdings Limited
Average return
All Ordinaries Index
Months
Average return
(Source: By Author)
The share price movement of the Kathmandu Holdings has been analyzed with the
assistance of the graph and the calculation of the average return against the All Ords Index
reported as an appendix. The Average returns of the Kathmandu Holdings Limited are more
KATHMANDU HOLDINGS 11
volatile in nature than the returns of the All Ords Index. The returns for the four years are
calculated to analyze the movement of the share price (Goldmann, 2017). The above graph
shows the comparison between average returns of Kathmandu company stock with the market
returns. The data is taken for the four years and it reflects that the trend lines of both are not
correlated as there is a huger difference in the returns of the Kathmandu Holdings Limited and
the All Ords Index. The market of the Kathmandu holdings showed a negative index only 11
times during the entire period of the four years. Form the other perspective it can also be stated
that the trend lines of the Kathmandu share holdings are mostly above the return of the All Ords
Index and the position of the company is more volatile in nature. However, the stock returns
remained positive and higher than the market. So, overall it can be interpreted that Kathmandu
Holdings Limited’s stock is highly volatile when related to ordinaries indices (Desjardins, 2018).
Broker’s Recommendation
The broker’s recommendation with respect to the shares shall be evaluated carefully
before the shares are purchased by the investor. Further the recommendations of the brokers are
analyzed strictly on the basis of the current market share as well as the performance of the
equity. The recommendation according to the brokers keeping in mind the average risk tolerance
power the Kathmandu Holdings is a Strong Sell. After looking at the attitude of the investment
horizon or the investment attitude the mean deviation of the Kathmandu holdings is 2.38 and the
volatility of the share is exceptionally risky and moreover the economic sensitivity of the
company is moving opposite in the market. The current valuation is overvalued and keeping in
mind all these challenges it is advised to sell the shares rather than keeping it on hold. As
mentioned in the question $50000 is available for investment which is currently deposited at the
⊘ This is a preview!⊘
Do you want full access?
Subscribe today to unlock all pages.
Trusted by 1+ million students worldwide
1 out of 17
Related Documents


Your All-in-One AI-Powered Toolkit for Academic Success.
+13062052269
info@desklib.com
Available 24*7 on WhatsApp / Email
![[object Object]](/_next/static/media/star-bottom.7253800d.svg)
Unlock your academic potential
Copyright © 2020–2026 A2Z Services. All Rights Reserved. Developed and managed by ZUCOL.