Comprehensive Financial Statement Analysis of Origin Energy Ltd

Verified

Added on  2023/06/04

|5
|543
|368
Report
AI Summary
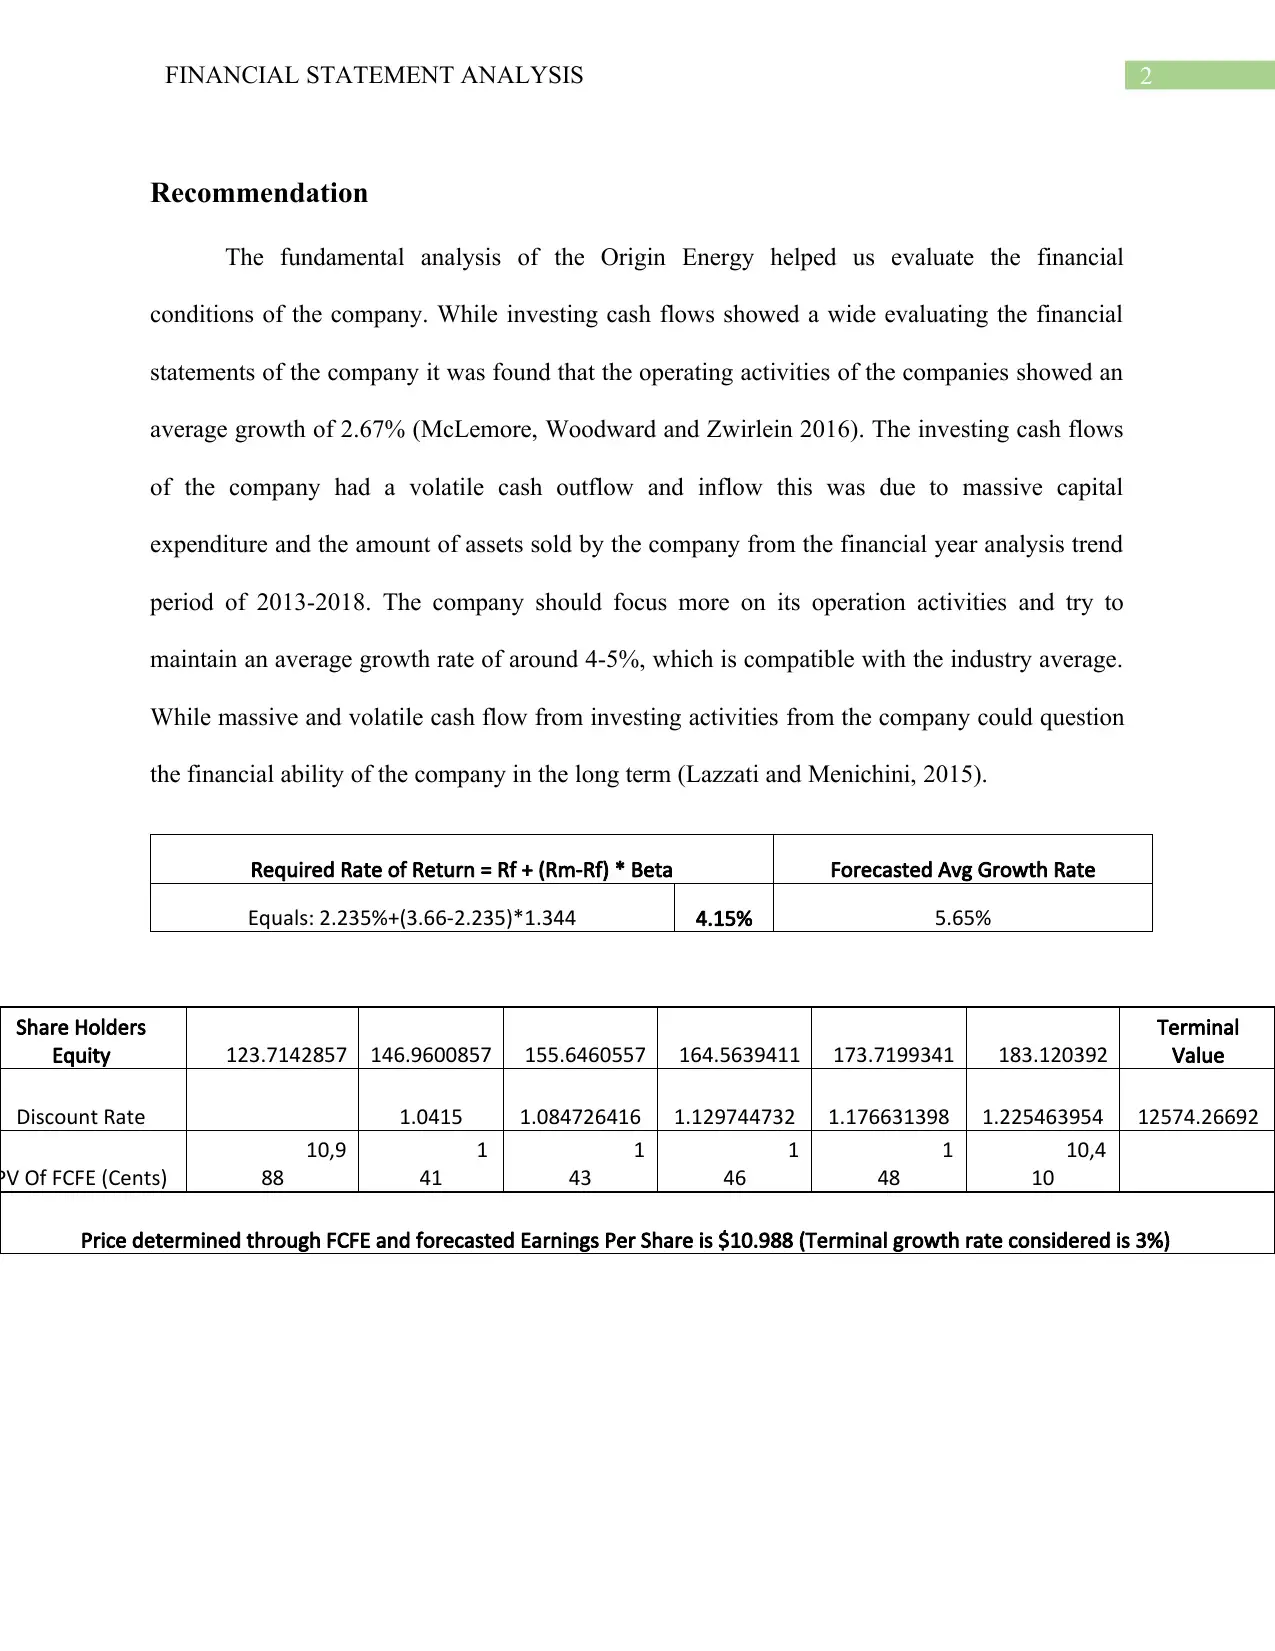
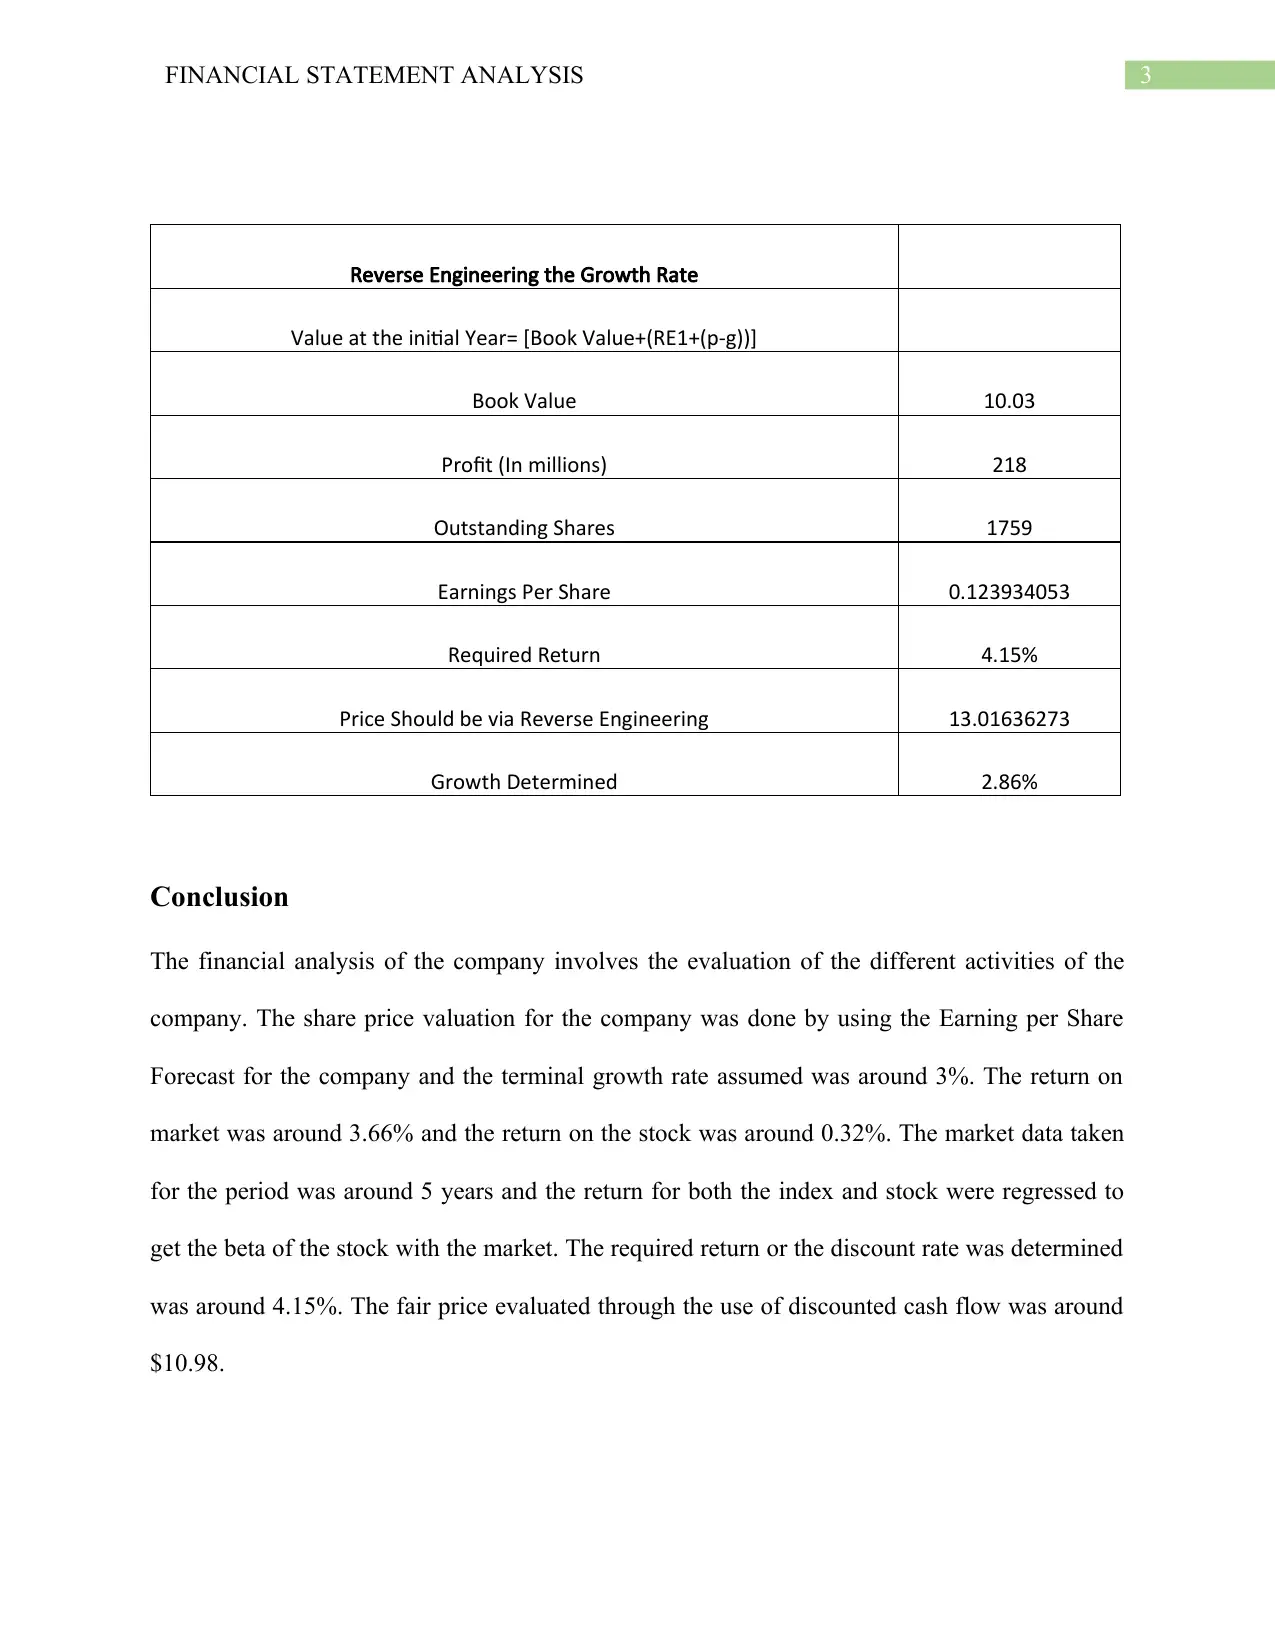
This report provides a financial statement analysis of Origin Energy Ltd, evaluating its financial condition through fundamental analysis. The operating activities show an average growth of 2.67%, while investing cash flows exhibit volatility due to capital expenditure and asset sales. The report recommends focusing on improving operational growth to 4-5% to align with industry averages. A discounted cash flow analysis, using the Free Cash Flow to Equity (FCFE) method, estimates a fair price of $10.98 per share. Reverse engineering the growth rate suggests a growth rate of 2.86%. The analysis incorporates a market return of 3.66% and a stock return of 0.32% to determine a required return of 4.15%. The share price valuation uses forecasted Earnings Per Share and assumes a terminal growth rate of 3%. This comprehensive analysis offers insights into Origin Energy's financial performance and investment potential, accessible on Desklib for further study.
Document Page
Running head: FINANCIAL STATEMENT ANALYSIS
Origin Energy Ltd
Name of the Student:
Name of the University:
Author’s Note:
tabler-icon-diamond-filled.svg

Secure Best Marks with AI Grader

Need help grading? Try our AI Grader for instant feedback on your assignments.
Document Page
1FINANCIAL STATEMENT ANALYSIS
Table of Contents
Recommendation.............................................................................................................................2
Conclusion.......................................................................................................................................2
Reference.........................................................................................................................................3
Document Page
2FINANCIAL STATEMENT ANALYSIS
Recommendation
The fundamental analysis of the Origin Energy helped us evaluate the financial
conditions of the company. While investing cash flows showed a wide evaluating the financial
statements of the company it was found that the operating activities of the companies showed an
average growth of 2.67% (McLemore, Woodward and Zwirlein 2016). The investing cash flows
of the company had a volatile cash outflow and inflow this was due to massive capital
expenditure and the amount of assets sold by the company from the financial year analysis trend
period of 2013-2018. The company should focus more on its operation activities and try to
maintain an average growth rate of around 4-5%, which is compatible with the industry average.
While massive and volatile cash flow from investing activities from the company could question
the financial ability of the company in the long term (Lazzati and Menichini, 2015).
Required Rate of Return = Rf + (Rm-Rf) * Beta Forecasted Avg Growth Rate
Equals: 2.235%+(3.66-2.235)*1.344 4.15% 5.65%
Share Holders
Equity 123.7142857 146.9600857 155.6460557 164.5639411 173.7199341 183.120392
Terminal
Value
Discount Rate 1.0415 1.084726416 1.129744732 1.176631398 1.225463954 12574.26692
PV Of FCFE (Cents)
10,9
88
1
41
1
43
1
46
1
48
10,4
10
Price determined through FCFE and forecasted Earnings Per Share is $10.988 (Terminal growth rate considered is 3%)
Document Page
3FINANCIAL STATEMENT ANALYSIS
Reverse Engineering the Growth Rate
Value at the initial Year= [Book Value+(RE1+(p-g))]
Book Value 10.03
Profit (In millions) 218
Outstanding Shares 1759
Earnings Per Share 0.123934053
Required Return 4.15%
Price Should be via Reverse Engineering 13.01636273
Growth Determined 2.86%
Conclusion
The financial analysis of the company involves the evaluation of the different activities of the
company. The share price valuation for the company was done by using the Earning per Share
Forecast for the company and the terminal growth rate assumed was around 3%. The return on
market was around 3.66% and the return on the stock was around 0.32%. The market data taken
for the period was around 5 years and the return for both the index and stock were regressed to
get the beta of the stock with the market. The required return or the discount rate was determined
was around 4.15%. The fair price evaluated through the use of discounted cash flow was around
$10.98.
tabler-icon-diamond-filled.svg

Secure Best Marks with AI Grader

Need help grading? Try our AI Grader for instant feedback on your assignments.
Document Page
4FINANCIAL STATEMENT ANALYSIS
Reference
Lazzati, N. and Menichini, A.A., 2015. A dynamic approach to the dividend discount model.
Review of Pacific Basin Financial Markets and Policies, 18(03), p.1550018.
McLemore, P., Woodward, G. and Zwirlein, T., 2016. Back-tests of the dividend discount model
using time-varying cost of equity.
chevron_up_icon
1 out of 5
circle_padding
hide_on_mobile
zoom_out_icon
[object Object]