Financial Statement Analysis and Free Cash Flow Valuation Homework

Verified

Added on  2020/05/28

|6
|481
|55
Homework Assignment
AI Summary
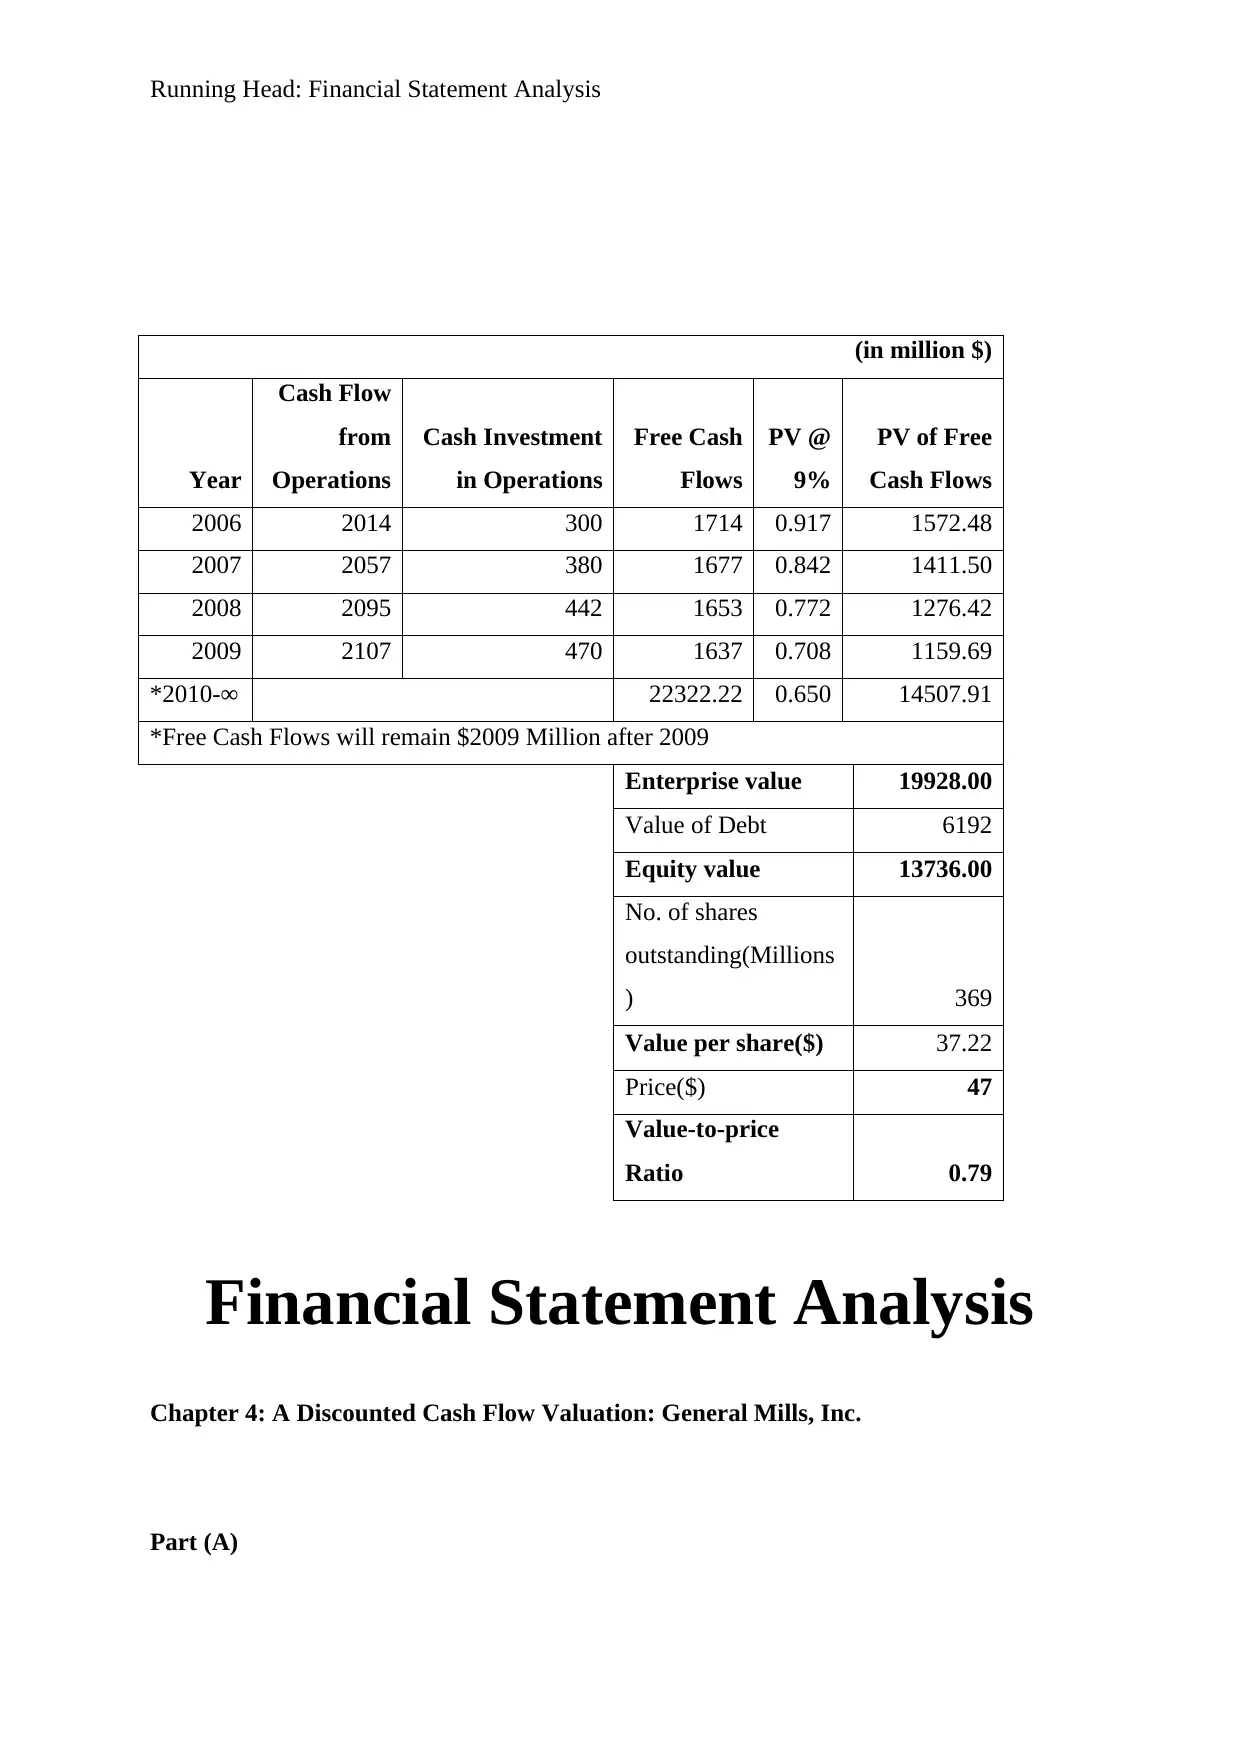
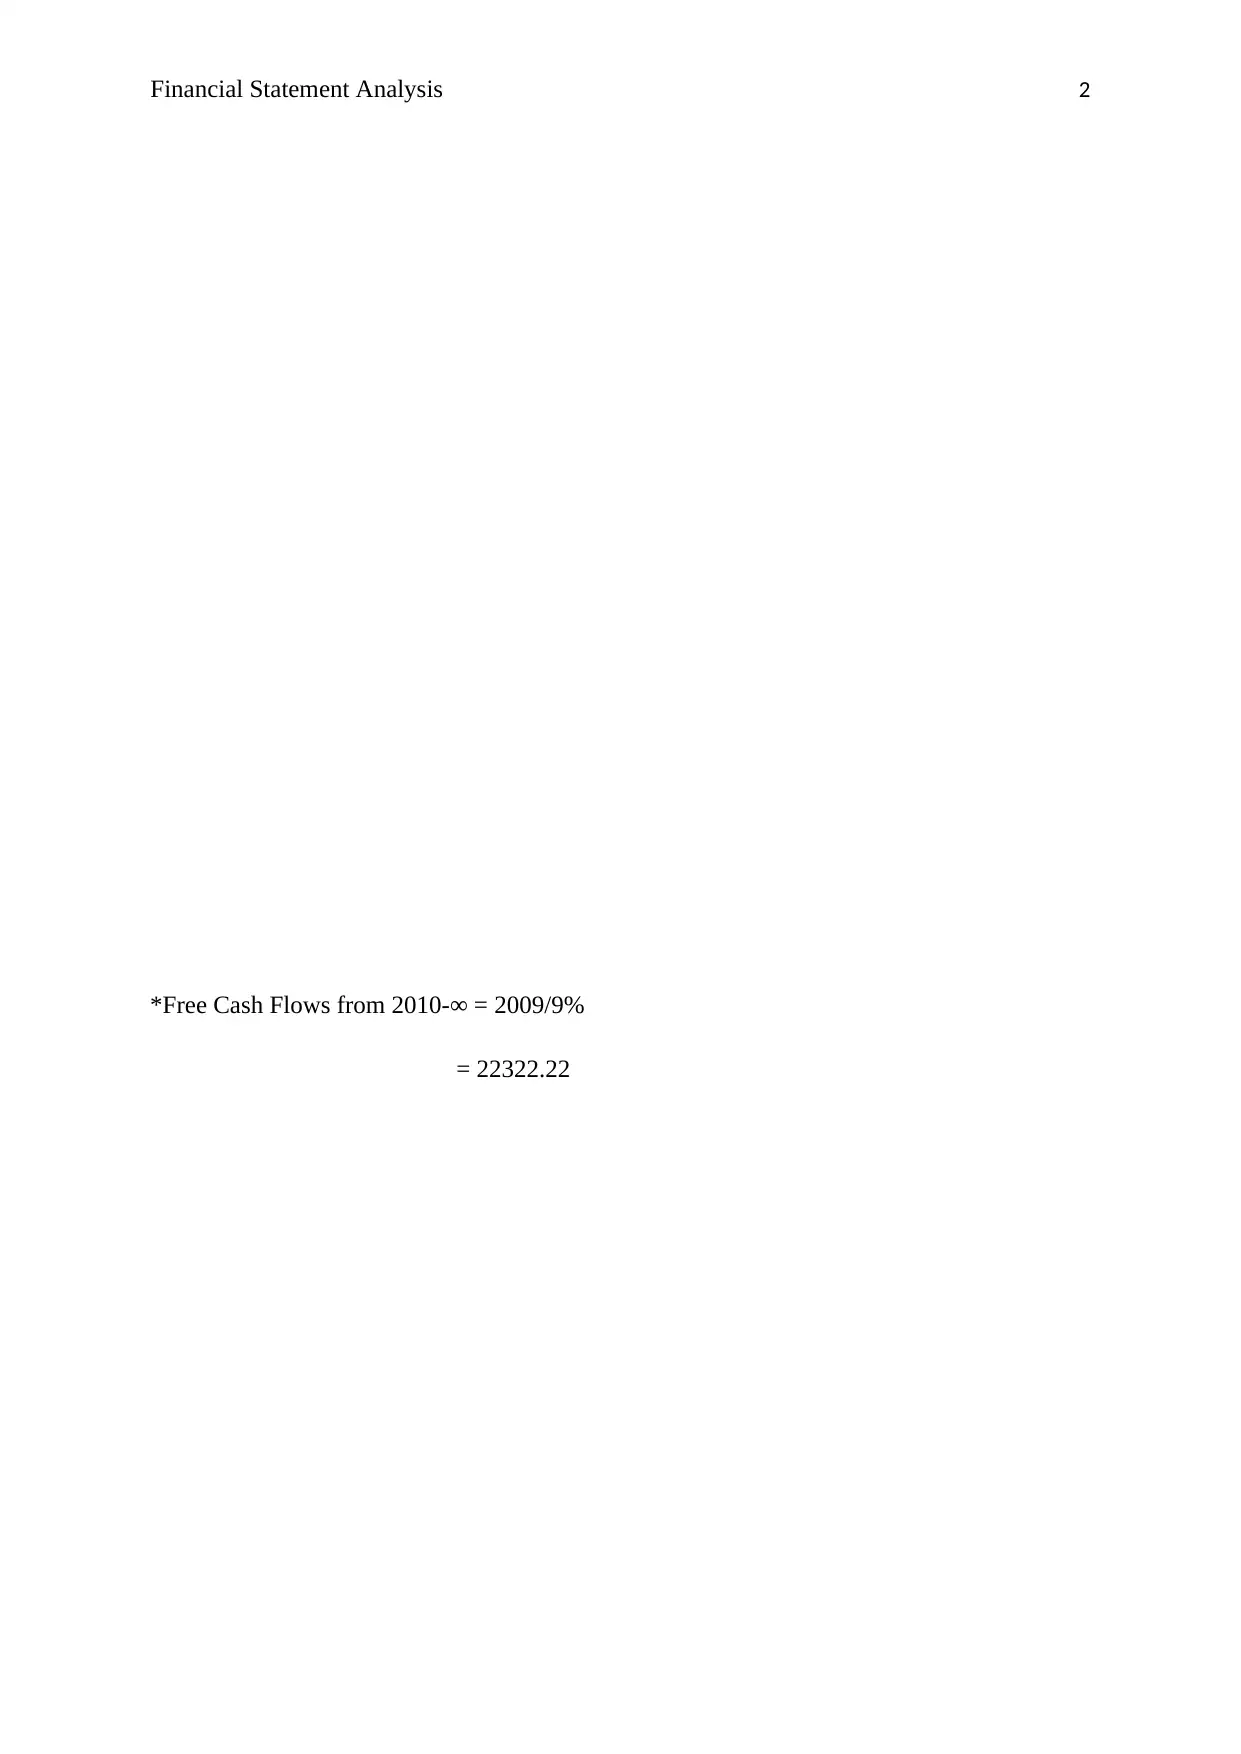
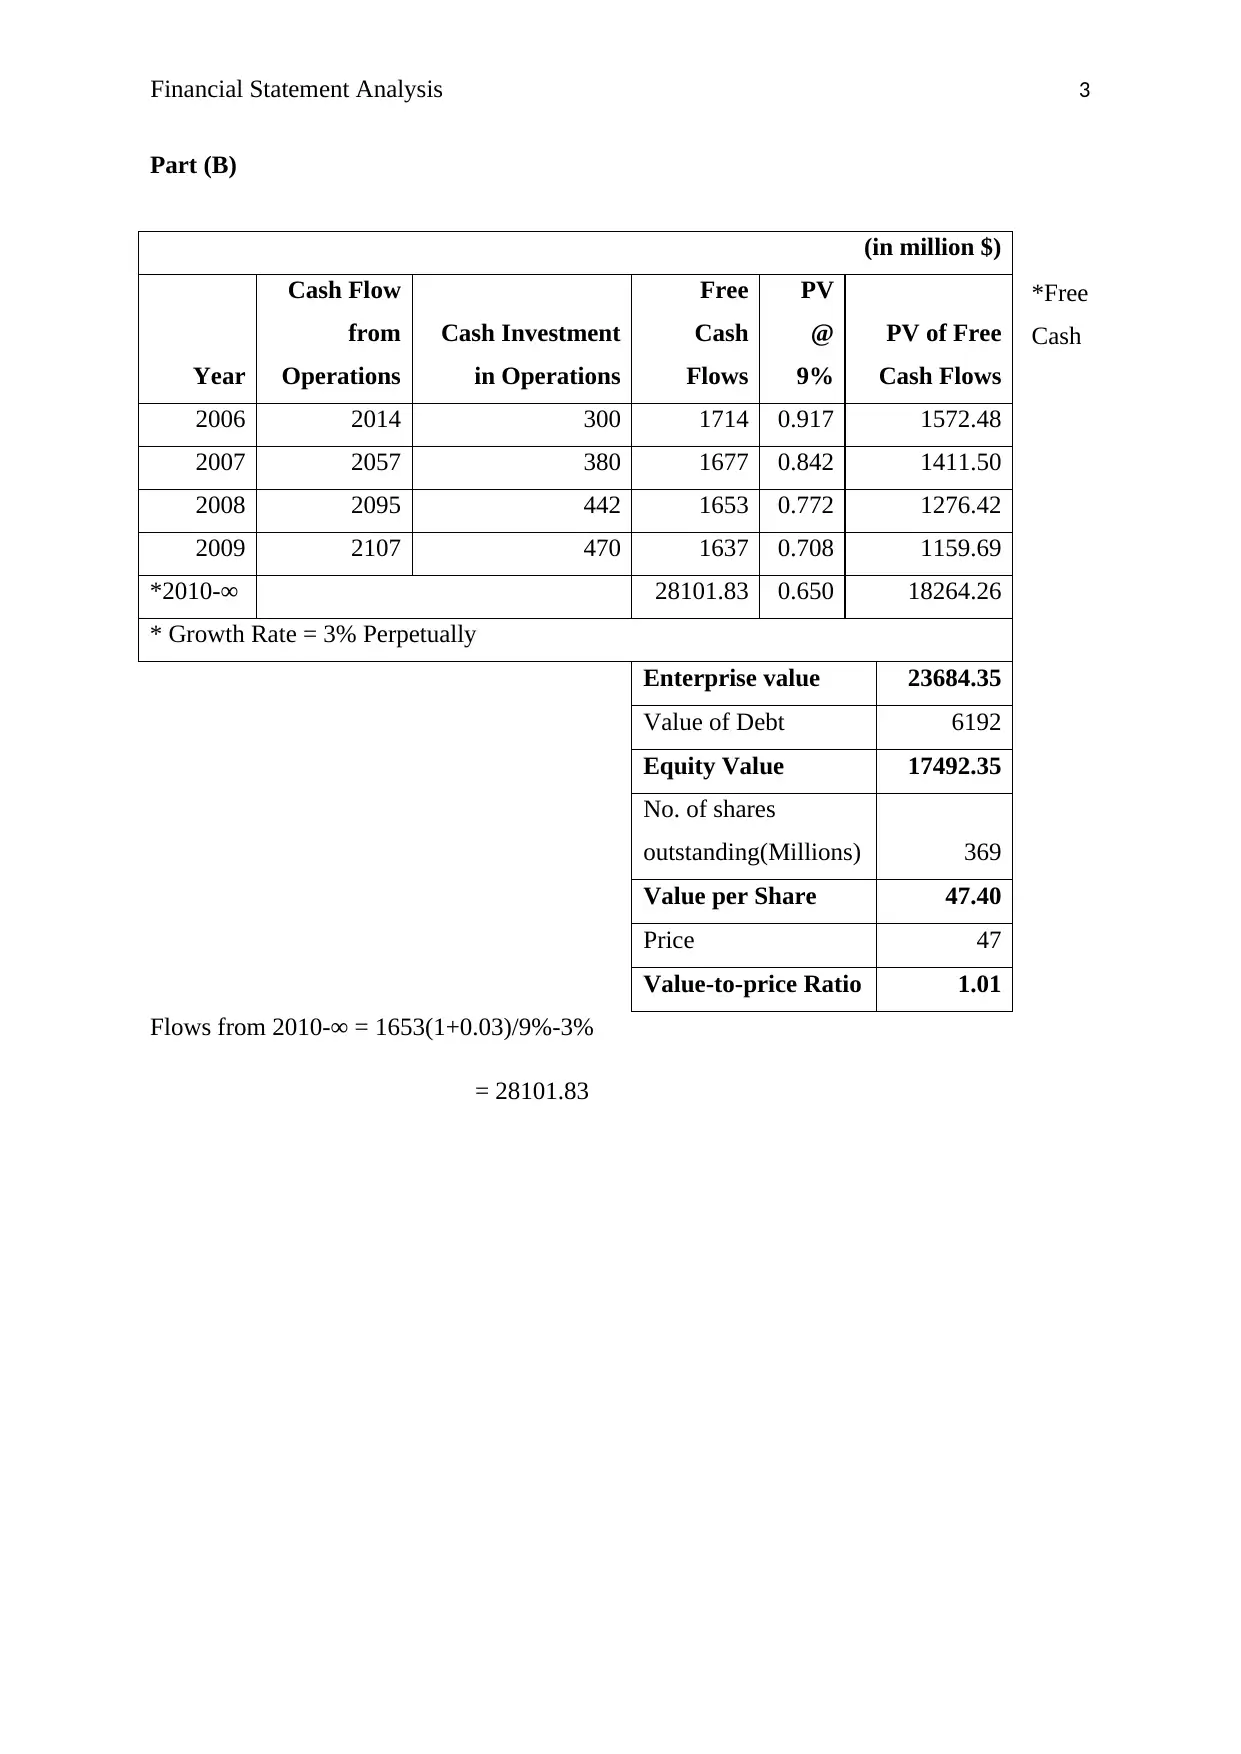
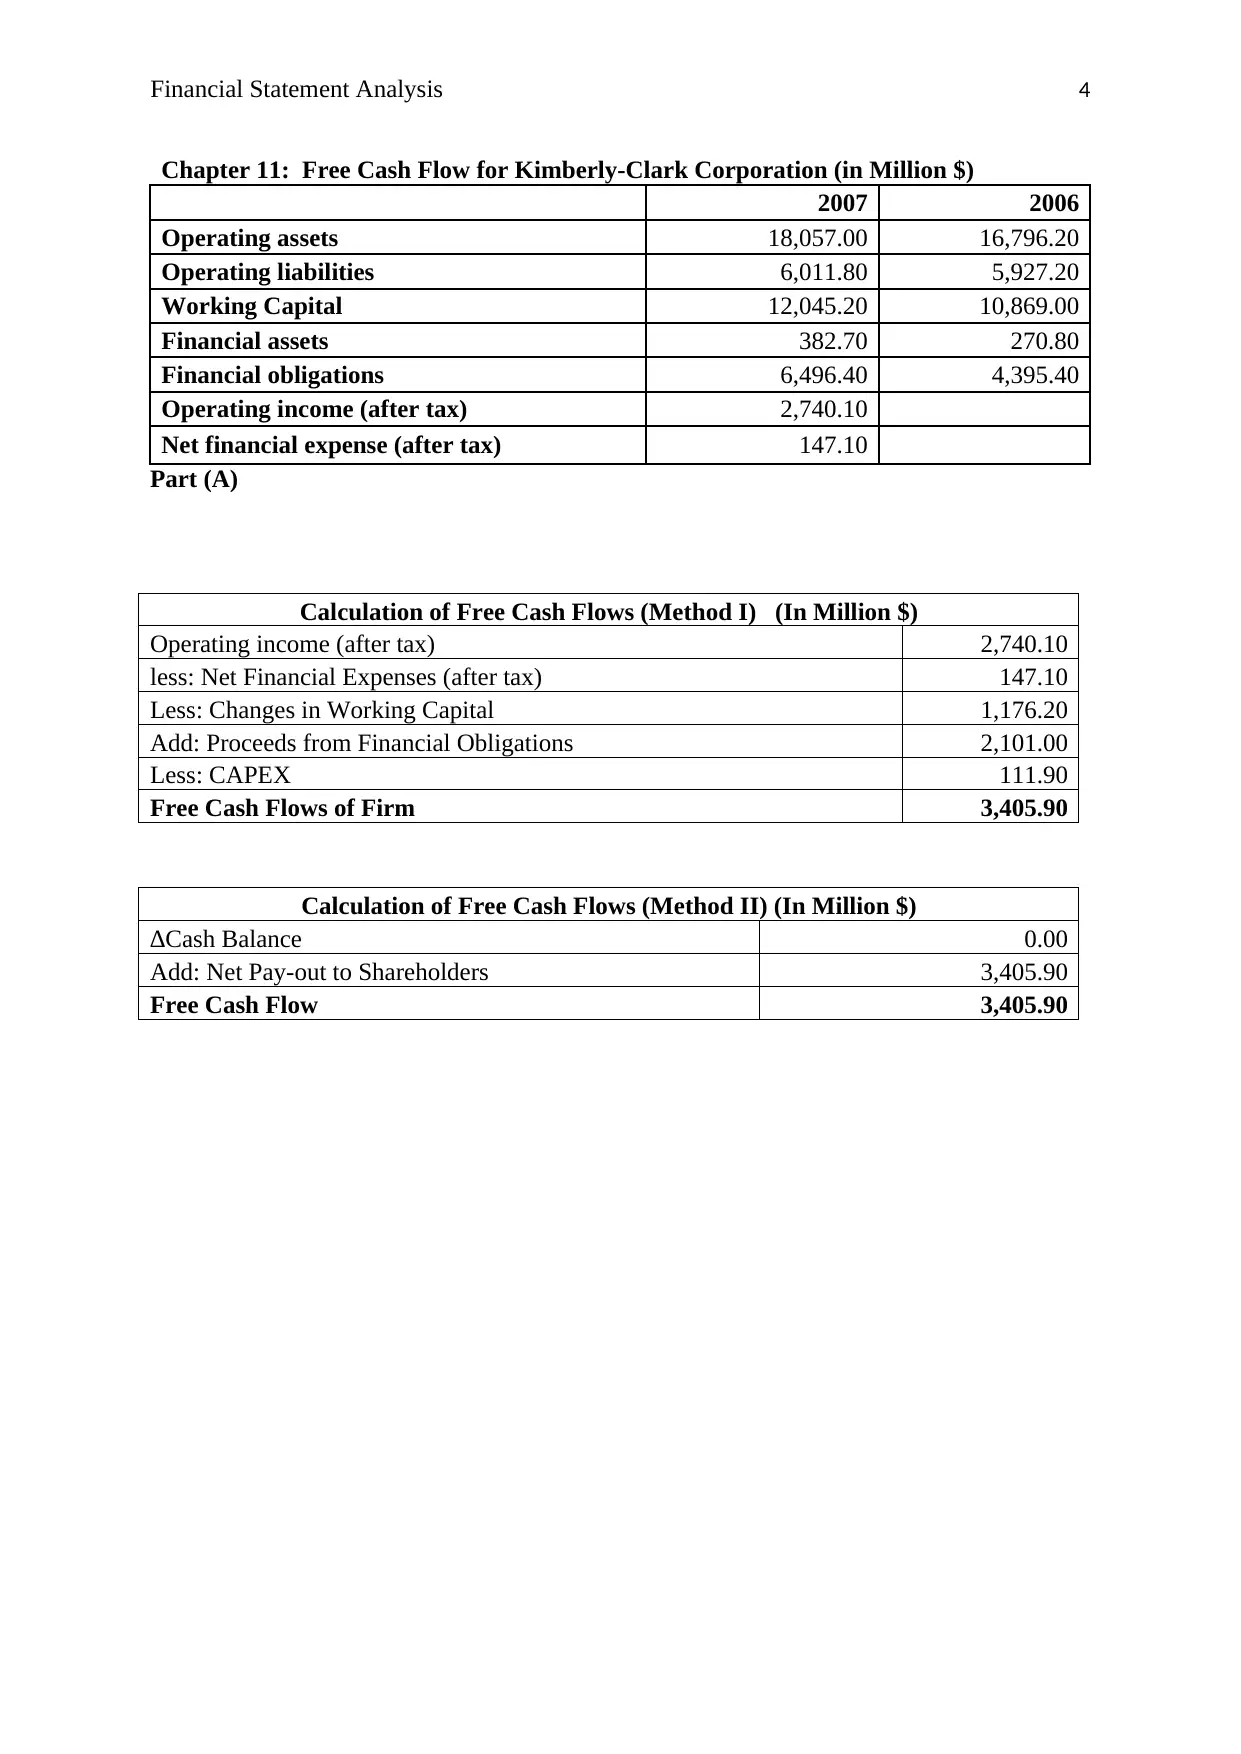
This document presents a comprehensive financial statement analysis, focusing on free cash flow valuation for various companies. The analysis includes discounted cash flow models, enterprise value calculations, and equity valuation. The solution examines free cash flow calculations using two different methods, analyzes working capital, operating income, and cash flow from operations. The document also provides calculations for free cash flow, including operating income after tax, changes in working capital, proceeds from financial obligations, and capital expenditures. Overall, the assignment provides a detailed analysis of financial statements and valuation techniques, demonstrating how to determine the value of a company.
Document Page
Running Head: Financial Statement Analysis
Financial Statement Analysis
Chapter 4: A Discounted Cash Flow Valuation: General Mills, Inc.
Part (A)
(in million $)
Year
Cash Flow
from
Operations
Cash Investment
in Operations
Free Cash
Flows
PV @
9%
PV of Free
Cash Flows
2006 2014 300 1714 0.917 1572.48
2007 2057 380 1677 0.842 1411.50
2008 2095 442 1653 0.772 1276.42
2009 2107 470 1637 0.708 1159.69
*2010-∞ 22322.22 0.650 14507.91
*Free Cash Flows will remain $2009 Million after 2009
Enterprise value 19928.00
Value of Debt 6192
Equity value 13736.00
No. of shares
outstanding(Millions
) 369
Value per share($) 37.22
Price($) 47
Value-to-price
Ratio 0.79
tabler-icon-diamond-filled.svg

Paraphrase This Document

Need a fresh take? Get an instant paraphrase of this document with our AI Paraphraser
Document Page
Financial Statement Analysis 2
*Free Cash Flows from 2010-∞ = 2009/9%
= 22322.22
Document Page
Financial Statement Analysis 3
Part (B)
*Free
Cash
Flows from 2010-∞ = 1653(1+0.03)/9%-3%
= 28101.83
(in million $)
Year
Cash Flow
from
Operations
Cash Investment
in Operations
Free
Cash
Flows
PV
@
9%
PV of Free
Cash Flows
2006 2014 300 1714 0.917 1572.48
2007 2057 380 1677 0.842 1411.50
2008 2095 442 1653 0.772 1276.42
2009 2107 470 1637 0.708 1159.69
*2010-∞ 28101.83 0.650 18264.26
* Growth Rate = 3% Perpetually
Enterprise value 23684.35
Value of Debt 6192
Equity Value 17492.35
No. of shares
outstanding(Millions) 369
Value per Share 47.40
Price 47
Value-to-price Ratio 1.01
Document Page
Financial Statement Analysis 4
Chapter 11: Free Cash Flow for Kimberly-Clark Corporation (in Million $)
2007 2006
Operating assets 18,057.00 16,796.20
Operating liabilities 6,011.80 5,927.20
Working Capital 12,045.20 10,869.00
Financial assets 382.70 270.80
Financial obligations 6,496.40 4,395.40
Operating income (after tax) 2,740.10
Net financial expense (after tax) 147.10
Part (A)
Calculation of Free Cash Flows (Method I) (In Million $)
Operating income (after tax) 2,740.10
less: Net Financial Expenses (after tax) 147.10
Less: Changes in Working Capital 1,176.20
Add: Proceeds from Financial Obligations 2,101.00
Less: CAPEX 111.90
Free Cash Flows of Firm 3,405.90
Calculation of Free Cash Flows (Method II) (In Million $)
∆Cash Balance 0.00
Add: Net Pay-out to Shareholders 3,405.90
Free Cash Flow 3,405.90
tabler-icon-diamond-filled.svg

Paraphrase This Document

Need a fresh take? Get an instant paraphrase of this document with our AI Paraphraser
Document Page
Financial Statement Analysis 5
Part (B)
Calculation of Free Cash Flows (In Million $)
Cash Flow from Operations 2429
± Cash flow from Investing Activity -842
± Cash Flow from Financing Activity 0
Add: Net Payment to Debt holders 90.28
Add: Net Pay-out to Shareholders 0
Free Cash Flows 1677.28
Document Page
Financial Statement Analysis 6
References:
Johann, R 2008, The Free Cash Flow Approach, GRIN Verlag, Germany.
Christy, G. C. 2009, Free Cash Flow: Seeing Through the Accounting Fog Machine to Find
Great Stock, John Wiley & Sons.
chevron_up_icon
1 out of 6
circle_padding
hide_on_mobile
zoom_out_icon
[object Object]