Financial Performance Analysis of Volkswagen and Vauxhall
VerifiedAdded on 2019/12/03
|20
|5184
|65
Report
AI Summary
This report provides a comprehensive financial analysis of Volkswagen, a major player in the automotive industry, comparing its performance with Vauxhall. The analysis utilizes various financial ratios, including activity, liquidity, solvency, and profitability ratios, to assess the company's financial health and performance trends over a three-year period. The report examines key financial statements, explains the financial statement framework, and details different methods of ratio analysis, such as horizontal and cross-sectional analysis. It evaluates Volkswagen's total asset turnover, inventory turnover, current ratio, quick ratio, debt-equity ratio, time interest ratio, gross profit ratio, operating profit ratio, and net profit ratio. The findings highlight Volkswagen's strengths and weaknesses, providing insights into its efficiency, liquidity, capital structure, and profitability. The report also includes sales analysis and share price activity analysis, culminating in recommendations for potential investors. The report is a valuable resource for understanding Volkswagen's financial position and making informed investment decisions.

Financial
analysis
analysis
Paraphrase This Document
Need a fresh take? Get an instant paraphrase of this document with our AI Paraphraser
TABLE OF CONTENTS
Introduction......................................................................................................................................3
Main body........................................................................................................................................3
Financial statement framework explanation................................................................................3
Different methods of ratio analysis..............................................................................................4
Ratio analysis...............................................................................................................................5
Sales analysis...............................................................................................................................8
Share price activity analysis.......................................................................................................10
Conclusion.....................................................................................................................................10
recommendations to potential investors.........................................................................................11
Appendix........................................................................................................................................12
References......................................................................................................................................14
2

ILLUSTRATION INDEX
Illustration 1: Sales analysis of Volkswagen.................................................................................11
Illustration 2: Sales analysis of Vauxhall.......................................................................................11
3
Illustration 1: Sales analysis of Volkswagen.................................................................................11
Illustration 2: Sales analysis of Vauxhall.......................................................................................11
3
⊘ This is a preview!⊘
Do you want full access?
Subscribe today to unlock all pages.
Trusted by 1+ million students worldwide

INDEX OF TABLES
Table 1: Sales values of Volkswagen and Vauxhall......................................................................10
Table 2: Ratio computation of Volkswagen..................................................................................14
Table 3: Ratio computation of Vauxhall........................................................................................14
4
Paraphrase This Document
Need a fresh take? Get an instant paraphrase of this document with our AI Paraphraser
INTRODUCTION
Financial statement analysis is a process and it is used for the evaluating financial facts
and figures to make effective economic decisions. This analysis is one of the most appropriate
tools for the users of financial statements because it provides clear description about
circumstances and performance of the entity (Sisaye and Birnberg, 2010). This aspect is
supported by trends and proportion analysis.
Present project report is focused on evaluation of financial statements of Volkswagen. It
is a German car manufacturer company established in the year 1946. Company is able to make
continuous increase in their sales and profitability figures by their effective operations.
Management of the company is engaged in manufacturing, designing and distribution of
vehicles. Along with this, company is also providing financial services to their customers.
Volkswagen is providing more than 100 production facilities across 27 countries. In accordance
with the report of Fortune Global 500 it ranked 9th in 2013. Further, in 2014, it had reached
production output of 10.14 million vehicles. By considering competitive market, top competitors
of company are Vauxhall, Toyota, Bugatti and Skoda.
In order to analyze financial position of the company inter and intra comparison will be
used in this report. Inter comparison of financial value will be done by considering financial
statements of Vauxhall. Further, intra comparison will be done through trend analysis by
computation of ratios of previous three years.
MAIN BODY
Financial statement framework explanation
Financial statement analysis can be defined as procedure used for analyzing and
assessment of organization's financial statement to attain understanding regarding risk,
profitability, financial performance and business model. Major objective of financial statement
analysis is to make decision regarding investment in securities of the company. In accordance
with the view point of Kastantin, frame work of financial statement analysis comprises of
following six steps: Statement of objective and context- Framework is developed by determining of
objectives. By this aspect, form of presentation of information is clarified. This step is
5
accomplished on the basis of available time and resources (Kastantin, 2005). Objective of
present financial statement analysis is to make investment decision by comparing the
financial figures of Volkswagen and Vauxhall. Collection of data- Data for the financial evaluation of corporate entities can be collected
through annual financial statements, industry reports and presentations provided by
economy on sector (Shim and et.al., 2008). For competitive analysis in present report,
annual reports published by the organizations will be used. Processing of data- In order to convert collected data into information, processing step is
essential for the analysts (Theeke and Mitchell, 2008). For this aspect, ratios are required
to be computed and same should be presented in the form of suitable exhibit such as
graphs. Analysis and interpretation of data- Collected data is analyzed to draw suitable
conclusion and it even provide appropriate recommendations to the users. This aspect
will be supported by ratio computation (Wahlen and et.al., 2011). Reporting of calculations and recommendations- On the basis of ratio computation and
interpretation, report will be prepared for investors and potential investors of the
company to assist them in investment decisions.
Periodical repetitions of analysis- Above described steps are periodically repeated to
make changes in conclusions and the provided recommendations.
Different methods of ratio analysis
According to the accounting handbook of Beenhakker, ratio can be defined as numerical
expression which is used to set quantitative relationship between two members (Beenhakker,
2006). Further, ratio analysis is a procedure used for the interpretation of numerical relationship
between financial values of the company. Following methods can be used for analyzing ratios-
Horizontal analysis
Horizontal analysis is also known as intra firm analysis. In this method, comparison of
same ratios is done over a period of time. This analysis provides information of two grounds i.e.
stability and trend in the financial figures (Friedlob and Schleifer, 2003). With this analysis,
clarification regarding stability in track record is provided. In addition to this, it also unveils the
trend developed by the financial performance of the company.
6
⊘ This is a preview!⊘
Do you want full access?
Subscribe today to unlock all pages.
Trusted by 1+ million students worldwide
Cross Sectional analysis
Cross Sectional analysis is used to make comparison of financial performance of one
company with another. Selected company can be either from the same industry or from different
industry (Berman, Knight and Case, 2006). This analysis helps in understanding performance of
company in relation to its peers. In addition to this, it also relinquishes the impact of business
cycles. Cross Sectional analysis can be conducted by considering industry average or value of
competing firms or by selecting the company with the best practices.
Ratio analysis
Activity ratios
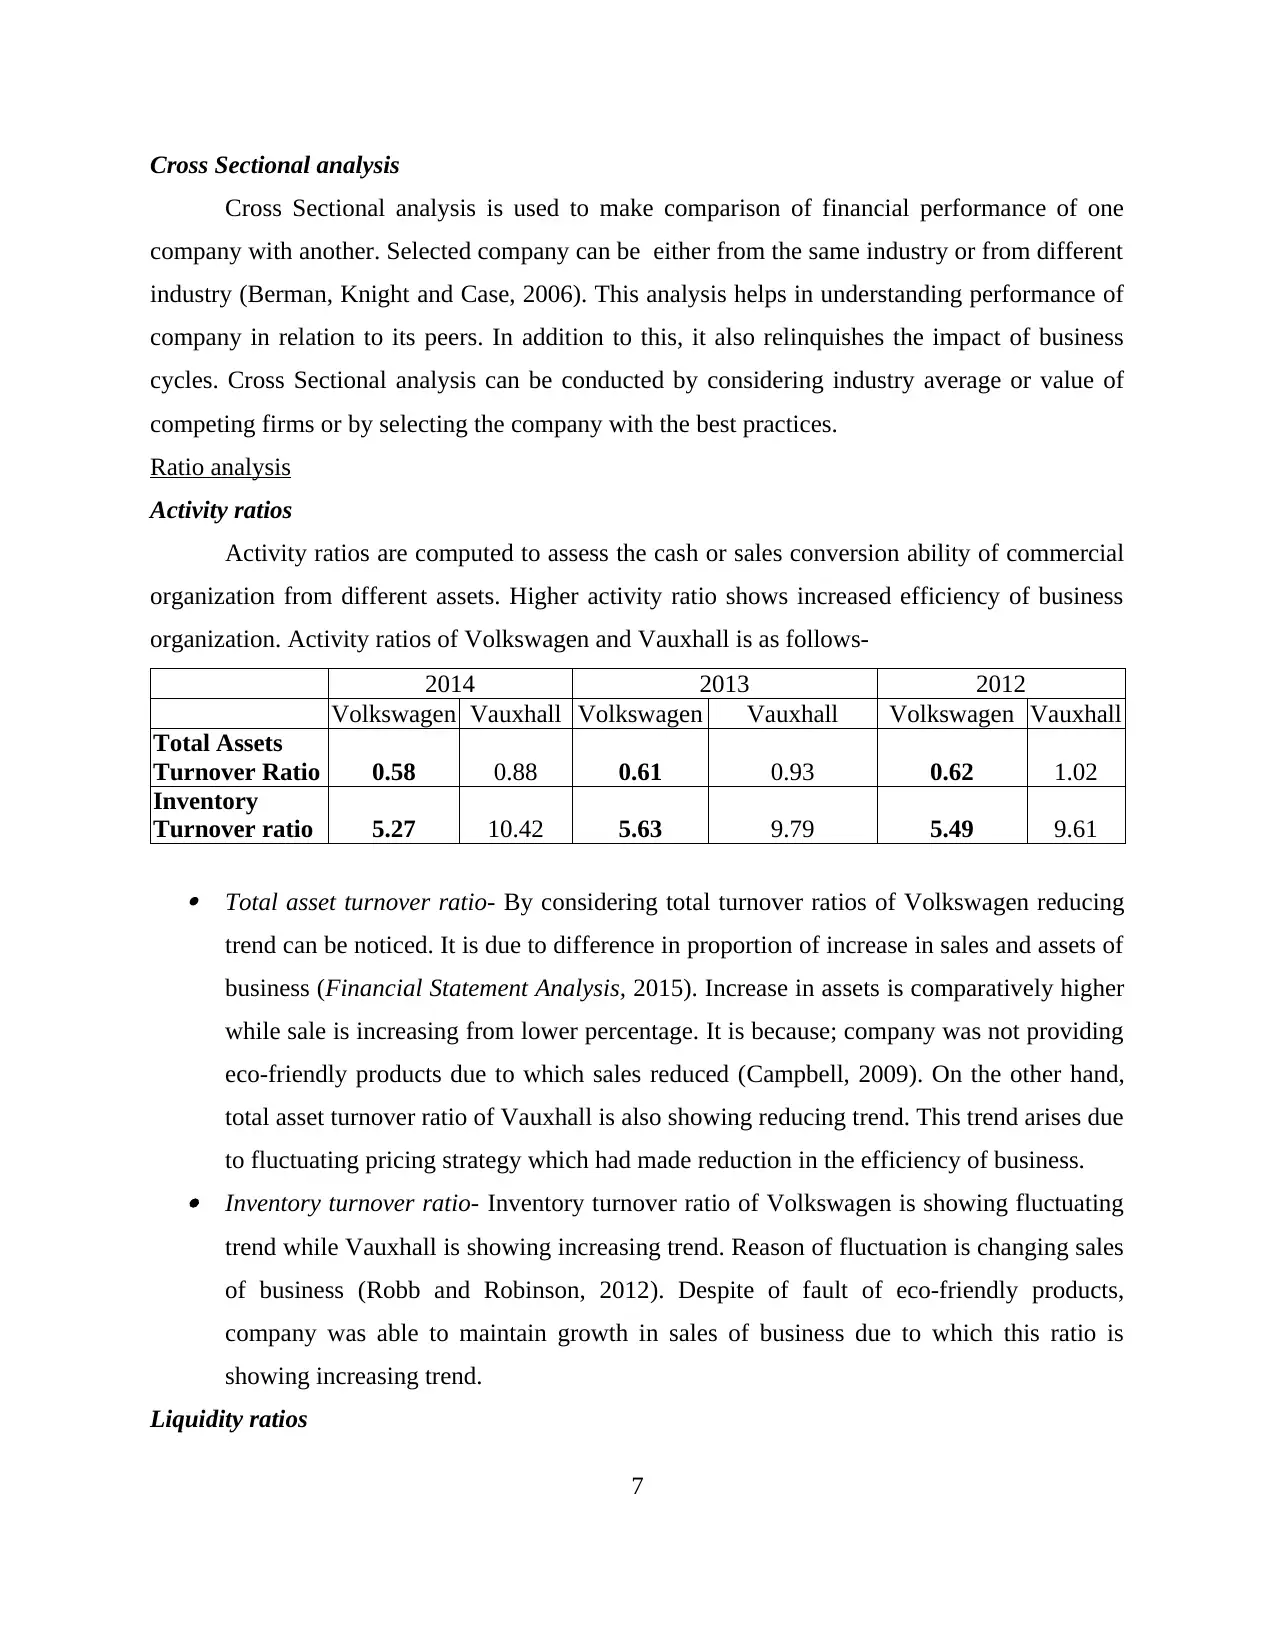
Activity ratios are computed to assess the cash or sales conversion ability of commercial
organization from different assets. Higher activity ratio shows increased efficiency of business
organization. Activity ratios of Volkswagen and Vauxhall is as follows-
2014 2013 2012
Volkswagen Vauxhall Volkswagen Vauxhall Volkswagen Vauxhall
Total Assets
Turnover Ratio 0.58 0.88 0.61 0.93 0.62 1.02
Inventory
Turnover ratio 5.27 10.42 5.63 9.79 5.49 9.61
Total asset turnover ratio- By considering total turnover ratios of Volkswagen reducing
trend can be noticed. It is due to difference in proportion of increase in sales and assets of
business (Financial Statement Analysis, 2015). Increase in assets is comparatively higher
while sale is increasing from lower percentage. It is because; company was not providing
eco-friendly products due to which sales reduced (Campbell, 2009). On the other hand,
total asset turnover ratio of Vauxhall is also showing reducing trend. This trend arises due
to fluctuating pricing strategy which had made reduction in the efficiency of business. Inventory turnover ratio- Inventory turnover ratio of Volkswagen is showing fluctuating
trend while Vauxhall is showing increasing trend. Reason of fluctuation is changing sales
of business (Robb and Robinson, 2012). Despite of fault of eco-friendly products,
company was able to maintain growth in sales of business due to which this ratio is
showing increasing trend.
Liquidity ratios
7
Cross Sectional analysis is used to make comparison of financial performance of one
company with another. Selected company can be either from the same industry or from different
industry (Berman, Knight and Case, 2006). This analysis helps in understanding performance of
company in relation to its peers. In addition to this, it also relinquishes the impact of business
cycles. Cross Sectional analysis can be conducted by considering industry average or value of
competing firms or by selecting the company with the best practices.
Ratio analysis
Activity ratios
Activity ratios are computed to assess the cash or sales conversion ability of commercial
organization from different assets. Higher activity ratio shows increased efficiency of business
organization. Activity ratios of Volkswagen and Vauxhall is as follows-
2014 2013 2012
Volkswagen Vauxhall Volkswagen Vauxhall Volkswagen Vauxhall
Total Assets
Turnover Ratio 0.58 0.88 0.61 0.93 0.62 1.02
Inventory
Turnover ratio 5.27 10.42 5.63 9.79 5.49 9.61
Total asset turnover ratio- By considering total turnover ratios of Volkswagen reducing
trend can be noticed. It is due to difference in proportion of increase in sales and assets of
business (Financial Statement Analysis, 2015). Increase in assets is comparatively higher
while sale is increasing from lower percentage. It is because; company was not providing
eco-friendly products due to which sales reduced (Campbell, 2009). On the other hand,
total asset turnover ratio of Vauxhall is also showing reducing trend. This trend arises due
to fluctuating pricing strategy which had made reduction in the efficiency of business. Inventory turnover ratio- Inventory turnover ratio of Volkswagen is showing fluctuating
trend while Vauxhall is showing increasing trend. Reason of fluctuation is changing sales
of business (Robb and Robinson, 2012). Despite of fault of eco-friendly products,
company was able to maintain growth in sales of business due to which this ratio is
showing increasing trend.
Liquidity ratios
7
Paraphrase This Document
Need a fresh take? Get an instant paraphrase of this document with our AI Paraphraser
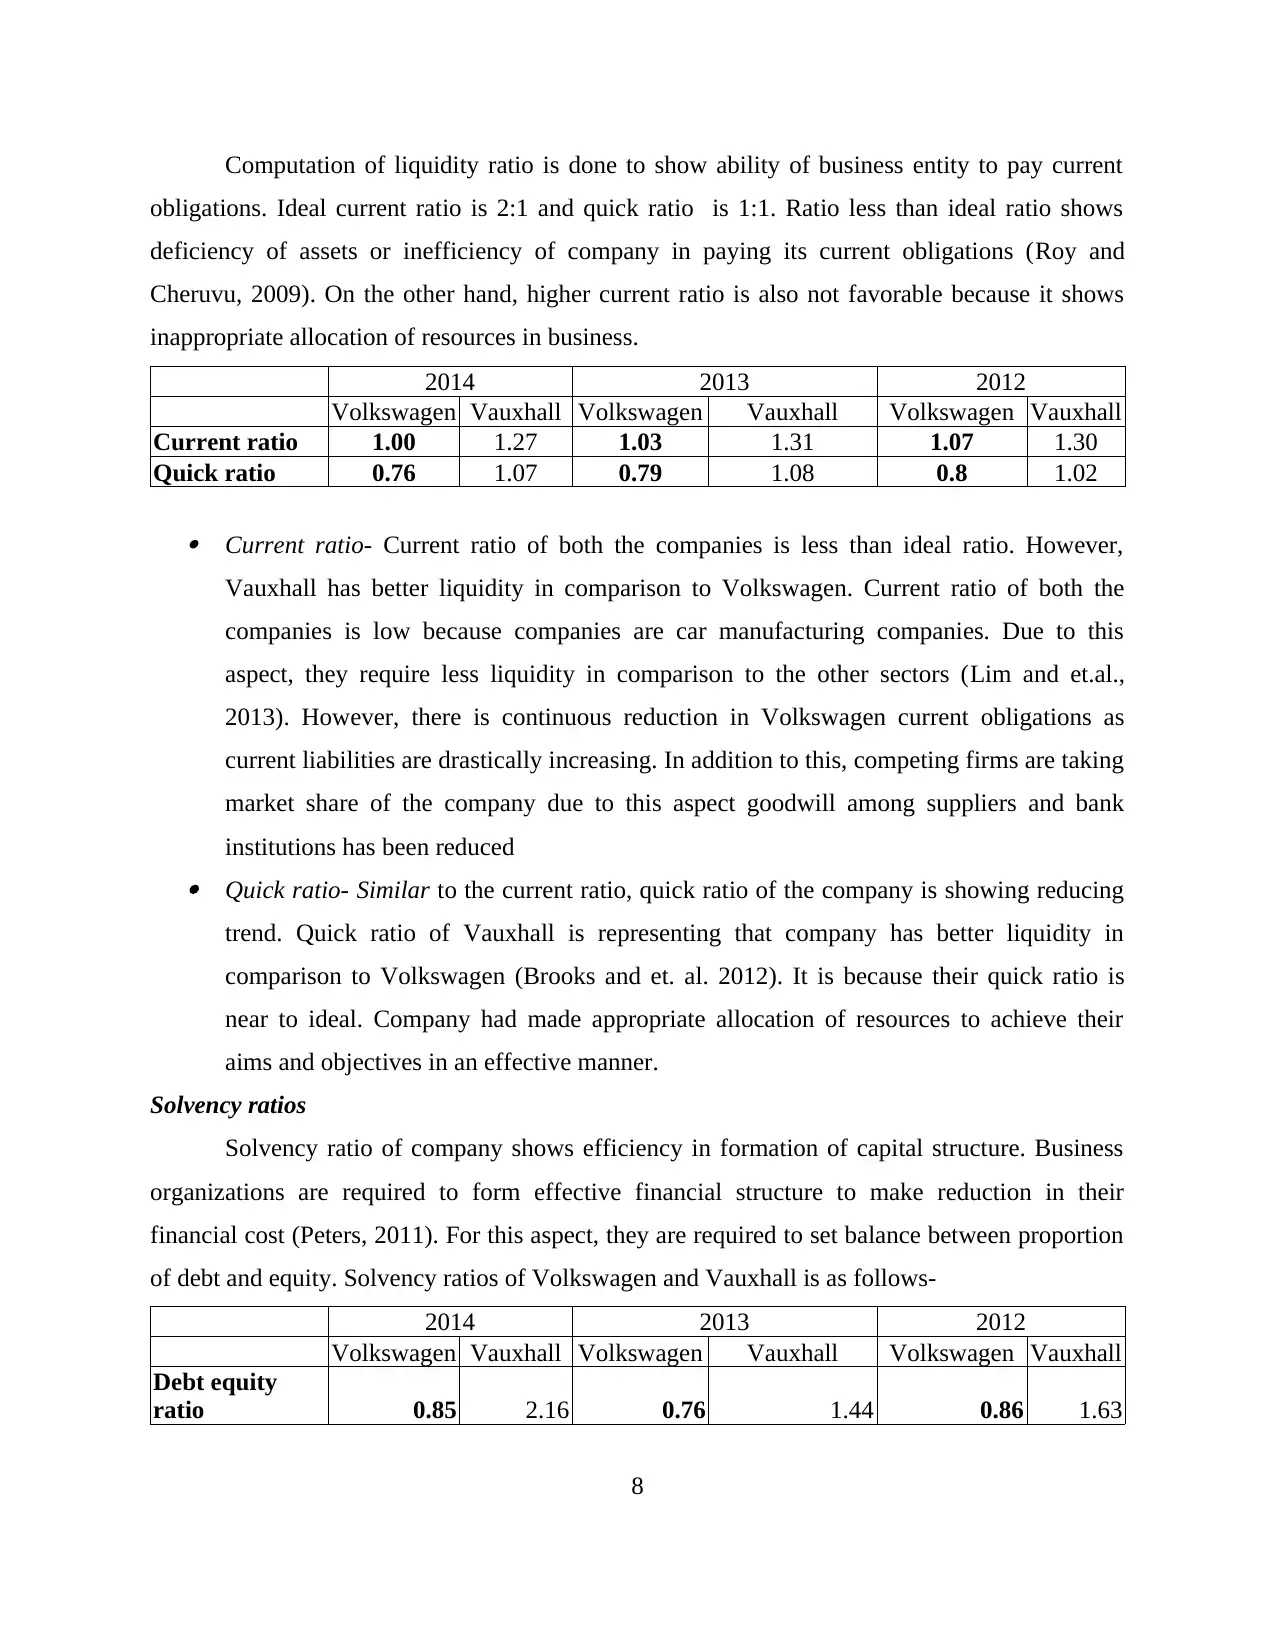
Computation of liquidity ratio is done to show ability of business entity to pay current
obligations. Ideal current ratio is 2:1 and quick ratio is 1:1. Ratio less than ideal ratio shows
deficiency of assets or inefficiency of company in paying its current obligations (Roy and
Cheruvu, 2009). On the other hand, higher current ratio is also not favorable because it shows
inappropriate allocation of resources in business.
2014 2013 2012
Volkswagen Vauxhall Volkswagen Vauxhall Volkswagen Vauxhall
Current ratio 1.00 1.27 1.03 1.31 1.07 1.30
Quick ratio 0.76 1.07 0.79 1.08 0.8 1.02
Current ratio- Current ratio of both the companies is less than ideal ratio. However,
Vauxhall has better liquidity in comparison to Volkswagen. Current ratio of both the
companies is low because companies are car manufacturing companies. Due to this
aspect, they require less liquidity in comparison to the other sectors (Lim and et.al.,
2013). However, there is continuous reduction in Volkswagen current obligations as
current liabilities are drastically increasing. In addition to this, competing firms are taking
market share of the company due to this aspect goodwill among suppliers and bank
institutions has been reduced Quick ratio- Similar to the current ratio, quick ratio of the company is showing reducing
trend. Quick ratio of Vauxhall is representing that company has better liquidity in
comparison to Volkswagen (Brooks and et. al. 2012). It is because their quick ratio is
near to ideal. Company had made appropriate allocation of resources to achieve their
aims and objectives in an effective manner.
Solvency ratios
Solvency ratio of company shows efficiency in formation of capital structure. Business
organizations are required to form effective financial structure to make reduction in their
financial cost (Peters, 2011). For this aspect, they are required to set balance between proportion
of debt and equity. Solvency ratios of Volkswagen and Vauxhall is as follows-
2014 2013 2012
Volkswagen Vauxhall Volkswagen Vauxhall Volkswagen Vauxhall
Debt equity
ratio 0.85 2.16 0.76 1.44 0.86 1.63
8
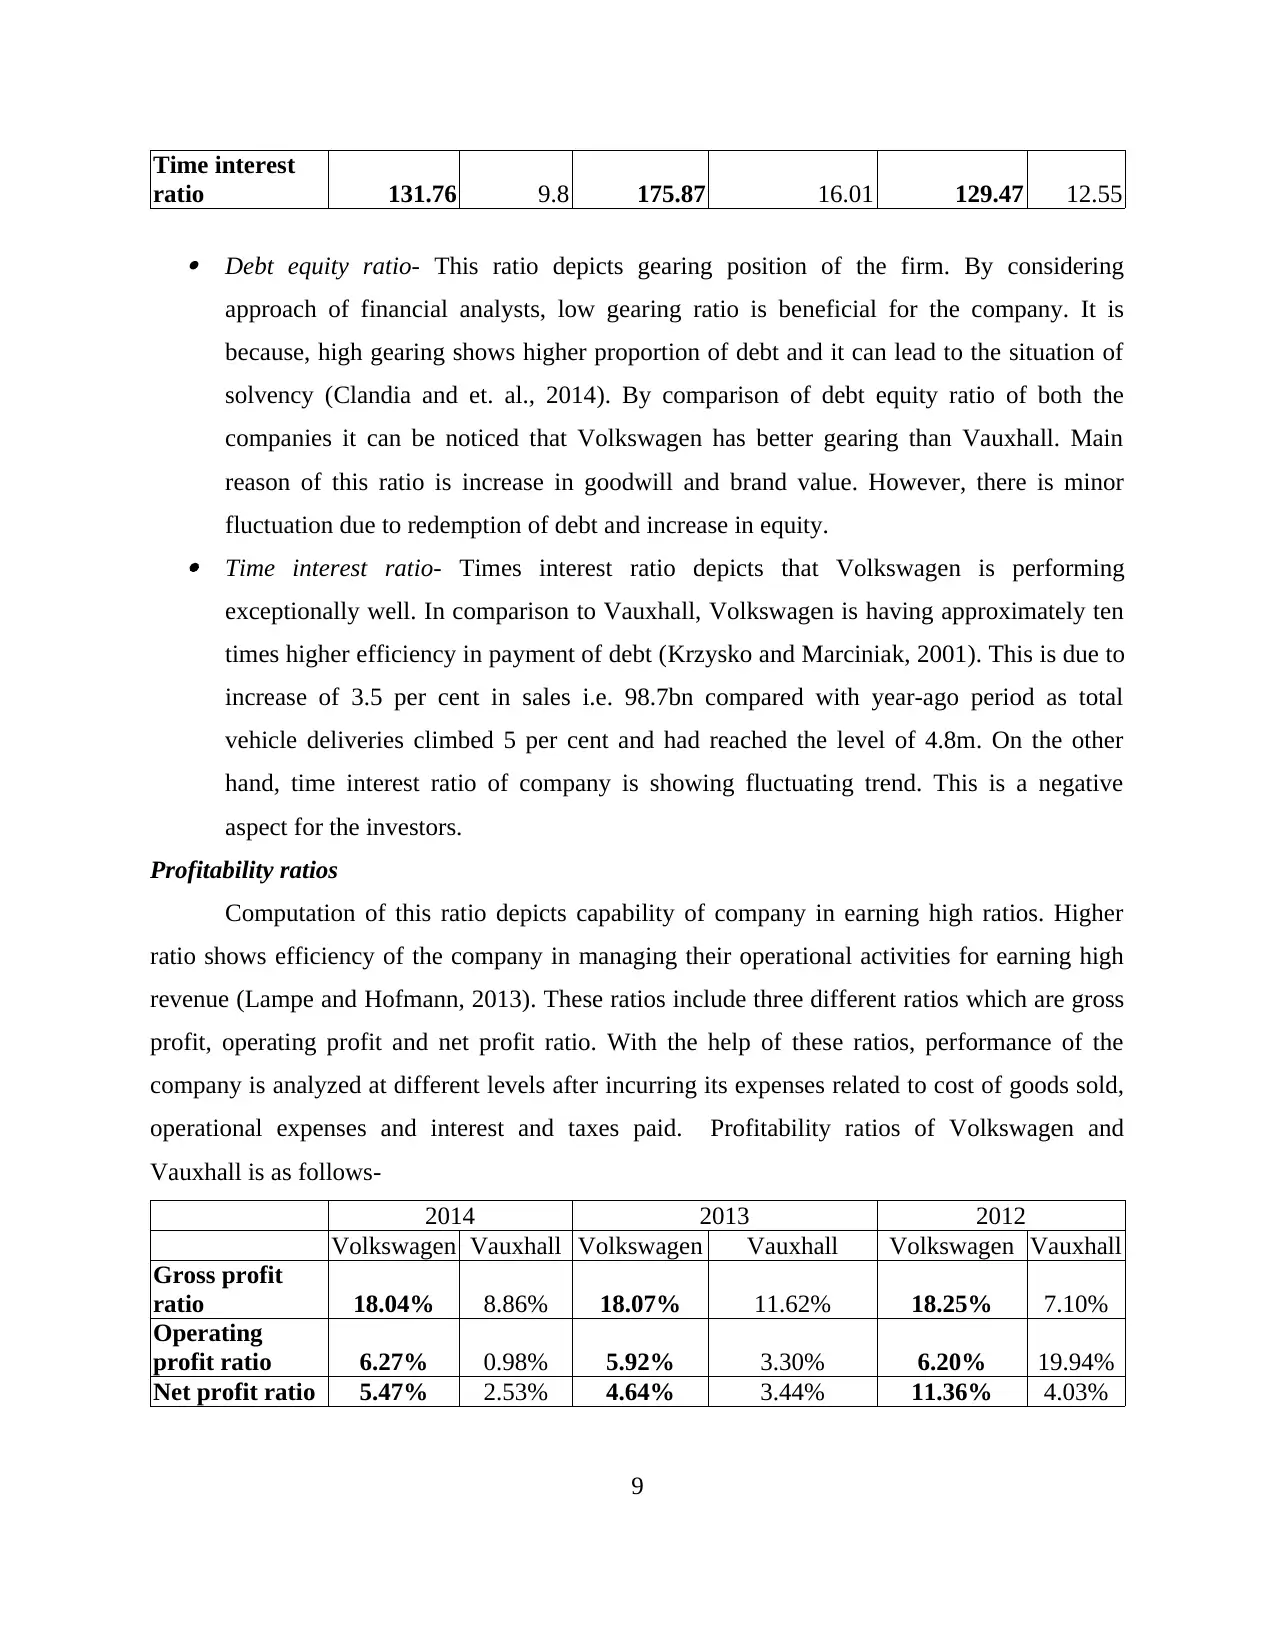
Time interest
ratio 131.76 9.8 175.87 16.01 129.47 12.55
Debt equity ratio- This ratio depicts gearing position of the firm. By considering
approach of financial analysts, low gearing ratio is beneficial for the company. It is
because, high gearing shows higher proportion of debt and it can lead to the situation of
solvency (Clandia and et. al., 2014). By comparison of debt equity ratio of both the
companies it can be noticed that Volkswagen has better gearing than Vauxhall. Main
reason of this ratio is increase in goodwill and brand value. However, there is minor
fluctuation due to redemption of debt and increase in equity. Time interest ratio- Times interest ratio depicts that Volkswagen is performing
exceptionally well. In comparison to Vauxhall, Volkswagen is having approximately ten
times higher efficiency in payment of debt (Krzysko and Marciniak, 2001). This is due to
increase of 3.5 per cent in sales i.e. 98.7bn compared with year-ago period as total
vehicle deliveries climbed 5 per cent and had reached the level of 4.8m. On the other
hand, time interest ratio of company is showing fluctuating trend. This is a negative
aspect for the investors.
Profitability ratios
Computation of this ratio depicts capability of company in earning high ratios. Higher
ratio shows efficiency of the company in managing their operational activities for earning high
revenue (Lampe and Hofmann, 2013). These ratios include three different ratios which are gross
profit, operating profit and net profit ratio. With the help of these ratios, performance of the
company is analyzed at different levels after incurring its expenses related to cost of goods sold,
operational expenses and interest and taxes paid. Profitability ratios of Volkswagen and
Vauxhall is as follows-
2014 2013 2012
Volkswagen Vauxhall Volkswagen Vauxhall Volkswagen Vauxhall
Gross profit
ratio 18.04% 8.86% 18.07% 11.62% 18.25% 7.10%
Operating
profit ratio 6.27% 0.98% 5.92% 3.30% 6.20% 19.94%
Net profit ratio 5.47% 2.53% 4.64% 3.44% 11.36% 4.03%
9
⊘ This is a preview!⊘
Do you want full access?
Subscribe today to unlock all pages.
Trusted by 1+ million students worldwide
Gross profit ratio- Gross profit ratio of Volkswagen depicts that company had maintained
stability in profitability. It is neither showing drastic decrease nor increase. Volkswagen
earning review shows that growth in the revenue of the company is strong. However, it is
not increasing due to reduction in sales volume of company by 2.7%. On the other hand,
gross profit ratio of Vauxhall is highly fluctuating (Pock, 2007). Fluctuation in sales is
due to inefficiency in management strategies of the company. It is because; management
of company is not able to handle their brand value. Due to this aspect, their biggest
improvement of scrapping brands like Saab is not providing effective contribution in the
profitability of the organization. Operating profit ratio- Similar to the gross profit ratio, there are no drastic changes in the
operating profit ratio of Volkswagen. However, in comparison to previous year company
is able to make increase of 5% i.e. 3.59 billion euros (Khamees, Al-Fayoumi and Al-
Thuneibat, 2010). In accordance with their financial report, effective product mix of the
company is able to make increase in the profits of the company (Weaver and Weston,
2007). On the other hand, operating profit ratio of company is continuously reducing due
to their poor performance. This aspect can be noticed by the report provided by the
Richard Bremner. It is due to previous losses of business.
Net profit ratio- Net profit ratio of the Volkswagen is showing fluctuating trend while
reducing trend can be noticed by considering values of Vauxhall. Due to legislator aspect
of eco-friendly products in 2013 there was drastic fall in the value of profit of
Volkswagen. However, in 2014, they were able to make improvement in this situation by
their effective product mix. Vauxhall had faced 14% fall in net profits during the first
three months of 2013 due to their poor operating strategies (Vauxhall-Opel 2015 profits
under threat, 2015).
Mintel explanation
In accordance with the Mintel analysis, performance of Volkswagen is comparatively
better than Vauxhall. It is because, company is earning higher profits and they are able to
generate better returns for the shareholders. By comparing performance of both the companies, it
can be noticed that Vauxhall is not able to make appropriate utilization of assets. By considering
10
Paraphrase This Document
Need a fresh take? Get an instant paraphrase of this document with our AI Paraphraser
this aspect, it can be concluded that performance of Vauxhall is less efficient in comparison to
Volkswagen.
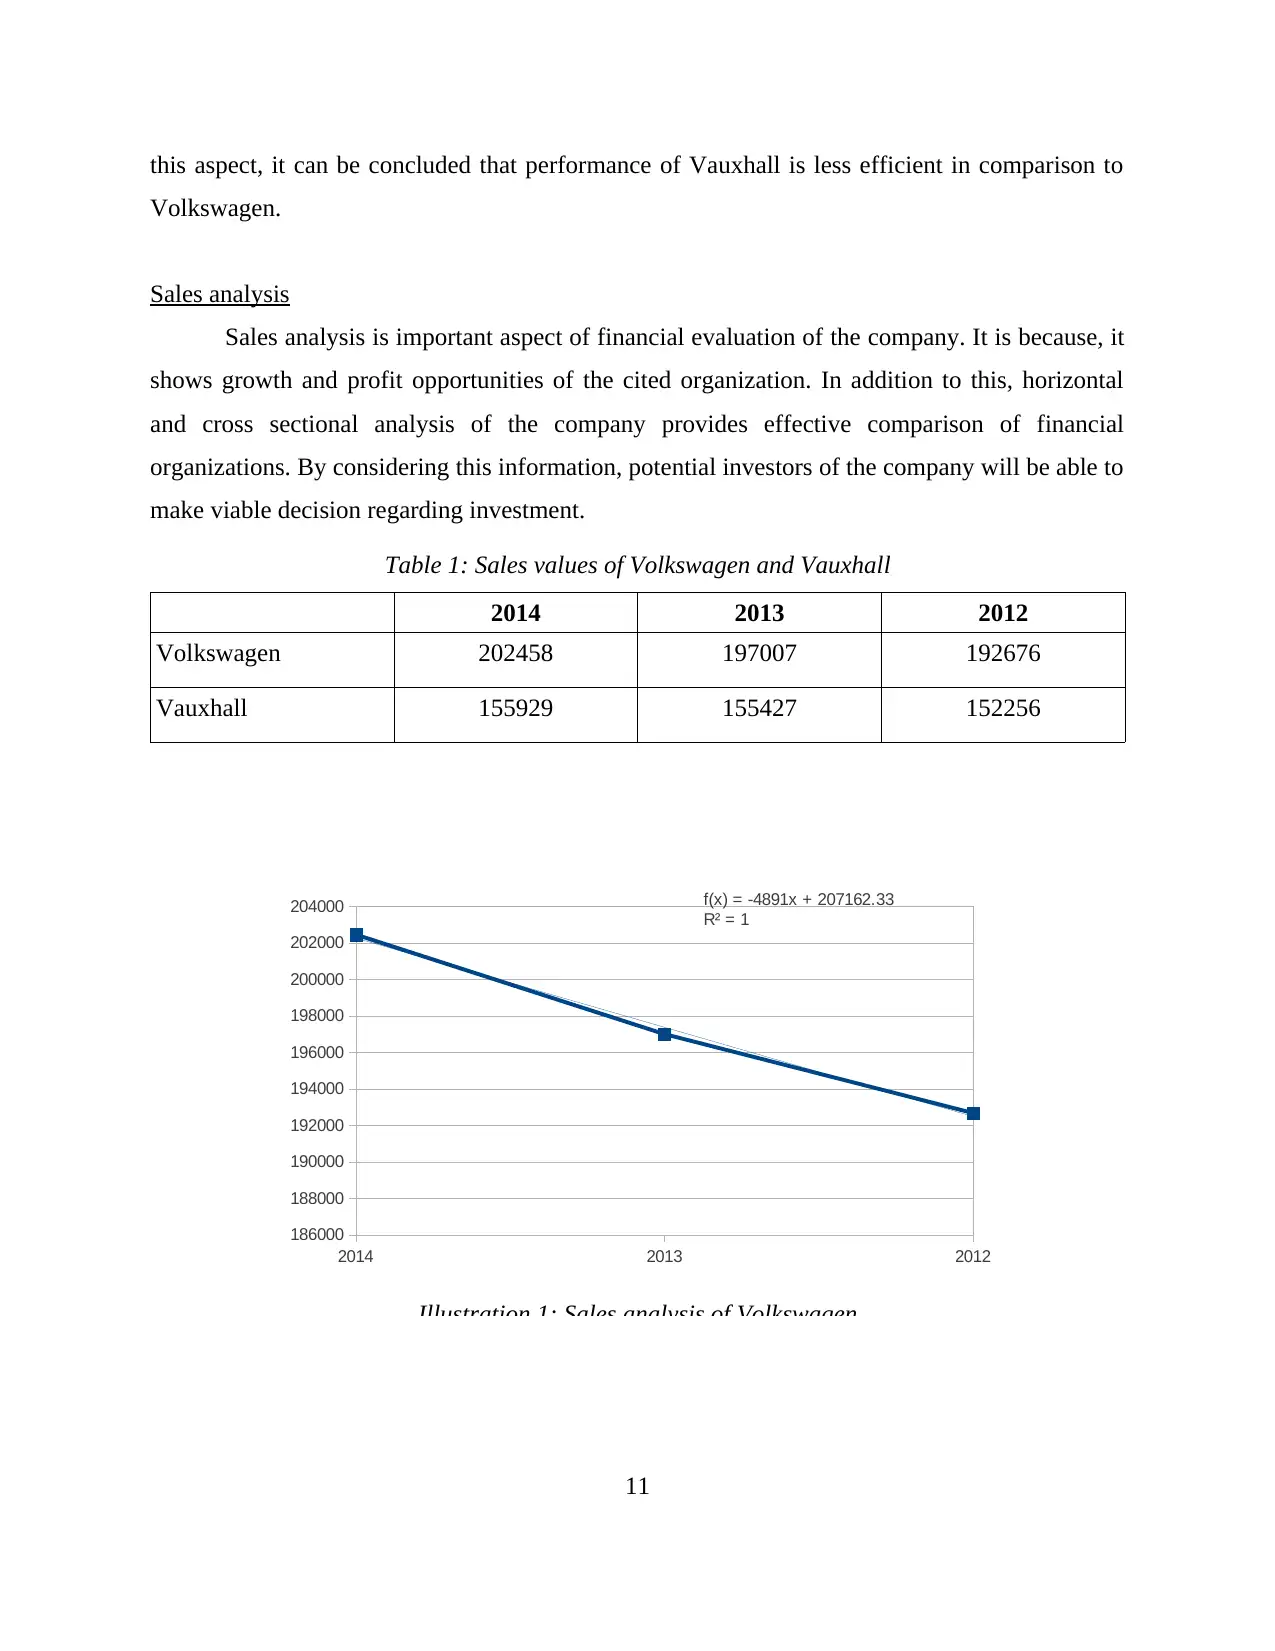
Sales analysis
Sales analysis is important aspect of financial evaluation of the company. It is because, it
shows growth and profit opportunities of the cited organization. In addition to this, horizontal
and cross sectional analysis of the company provides effective comparison of financial
organizations. By considering this information, potential investors of the company will be able to
make viable decision regarding investment.
Table 1: Sales values of Volkswagen and Vauxhall
2014 2013 2012
Volkswagen 202458 197007 192676
Vauxhall 155929 155427 152256
11
2014 2013 2012
186000
188000
190000
192000
194000
196000
198000
200000
202000
204000 f(x) = -4891x + 207162.33
R² = 1
Illustration 1: Sales analysis of Volkswagen
Volkswagen.
Sales analysis
Sales analysis is important aspect of financial evaluation of the company. It is because, it
shows growth and profit opportunities of the cited organization. In addition to this, horizontal
and cross sectional analysis of the company provides effective comparison of financial
organizations. By considering this information, potential investors of the company will be able to
make viable decision regarding investment.
Table 1: Sales values of Volkswagen and Vauxhall
2014 2013 2012
Volkswagen 202458 197007 192676
Vauxhall 155929 155427 152256
11
2014 2013 2012
186000
188000
190000
192000
194000
196000
198000
200000
202000
204000 f(x) = -4891x + 207162.33
R² = 1
Illustration 1: Sales analysis of Volkswagen
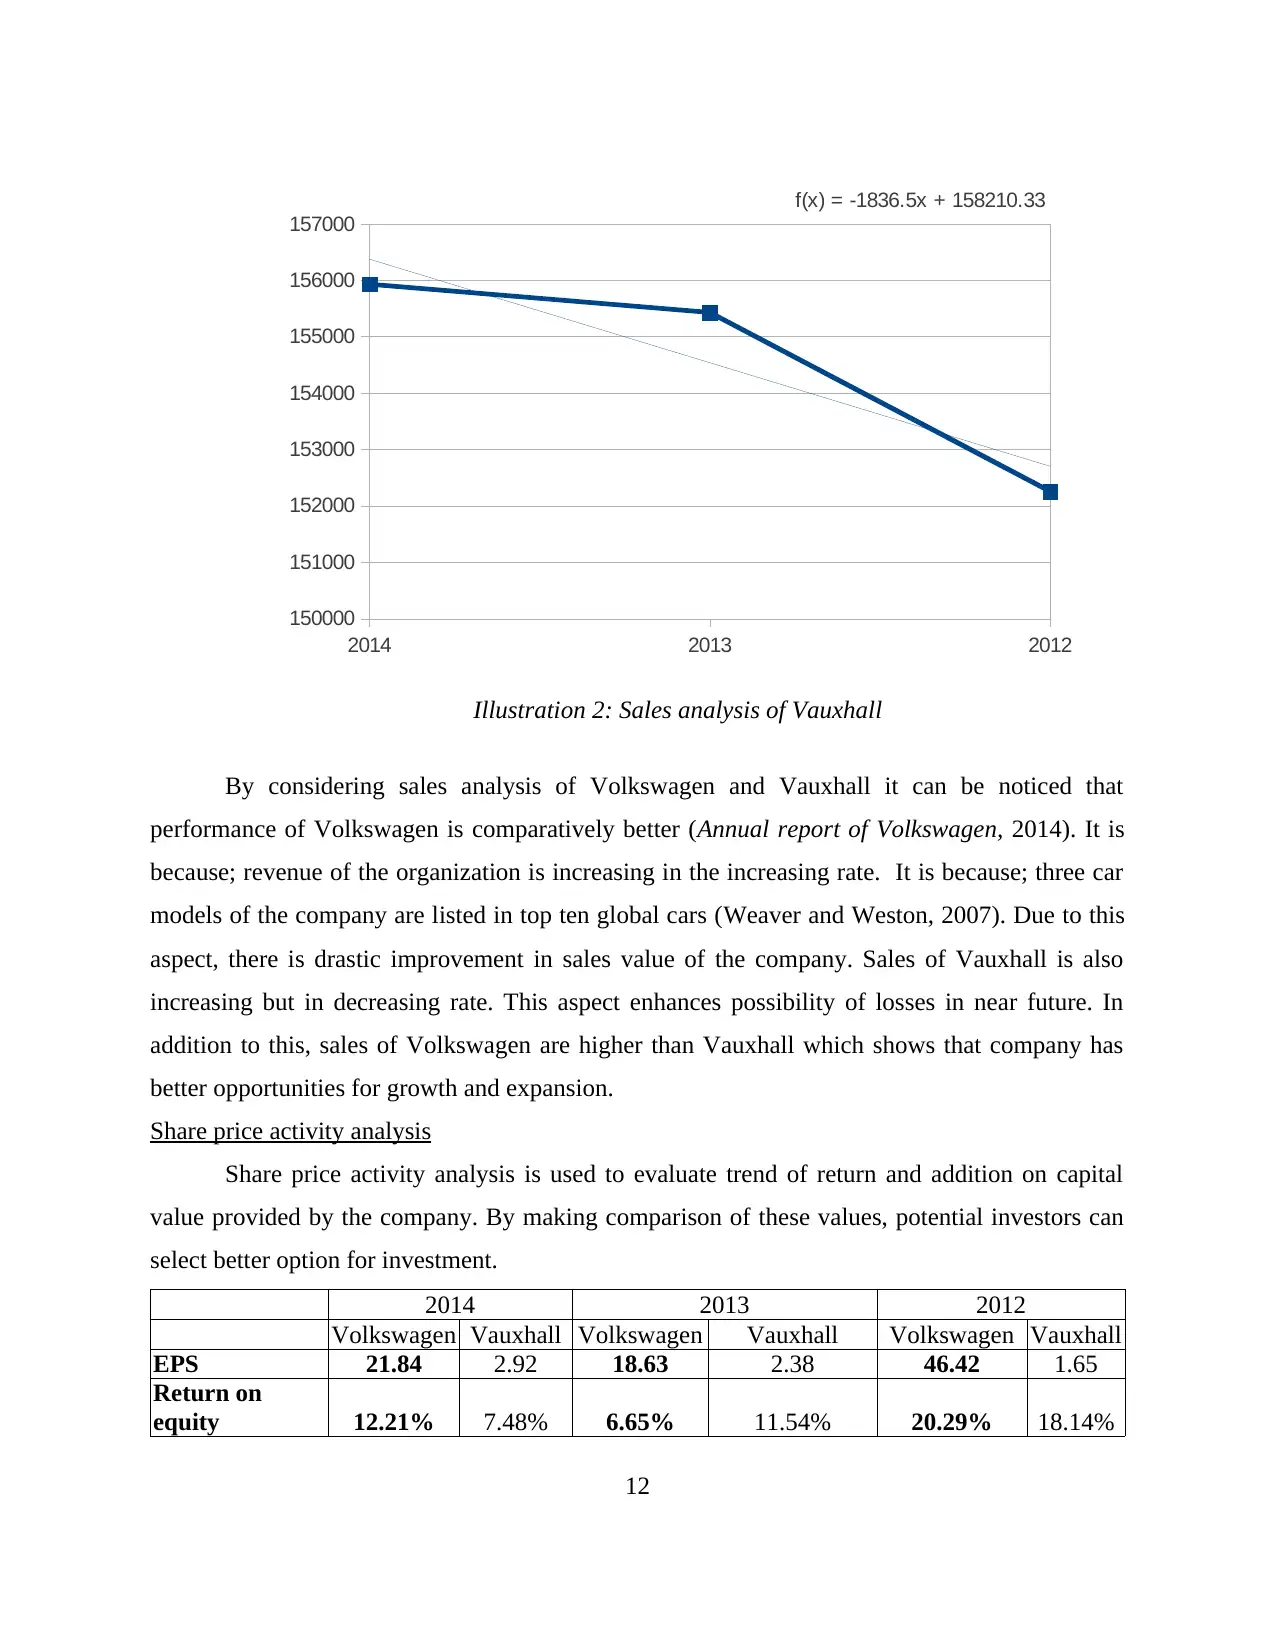
By considering sales analysis of Volkswagen and Vauxhall it can be noticed that
performance of Volkswagen is comparatively better (Annual report of Volkswagen, 2014). It is
because; revenue of the organization is increasing in the increasing rate. It is because; three car
models of the company are listed in top ten global cars (Weaver and Weston, 2007). Due to this
aspect, there is drastic improvement in sales value of the company. Sales of Vauxhall is also
increasing but in decreasing rate. This aspect enhances possibility of losses in near future. In
addition to this, sales of Volkswagen are higher than Vauxhall which shows that company has
better opportunities for growth and expansion.
Share price activity analysis
Share price activity analysis is used to evaluate trend of return and addition on capital
value provided by the company. By making comparison of these values, potential investors can
select better option for investment.
2014 2013 2012
Volkswagen Vauxhall Volkswagen Vauxhall Volkswagen Vauxhall
EPS 21.84 2.92 18.63 2.38 46.42 1.65
Return on
equity 12.21% 7.48% 6.65% 11.54% 20.29% 18.14%
12
2014 2013 2012
150000
151000
152000
153000
154000
155000
156000
157000
f(x) = -1836.5x + 158210.33
Illustration 2: Sales analysis of Vauxhall
⊘ This is a preview!⊘
Do you want full access?
Subscribe today to unlock all pages.
Trusted by 1+ million students worldwide
1 out of 20
Related Documents


Your All-in-One AI-Powered Toolkit for Academic Success.
+13062052269
info@desklib.com
Available 24*7 on WhatsApp / Email
![[object Object]](/_next/static/media/star-bottom.7253800d.svg)
Unlock your academic potential
Copyright © 2020–2026 A2Z Services. All Rights Reserved. Developed and managed by ZUCOL.