Financial Statement Analysis of Wesfarmers Half-Year Report - Finance
VerifiedAdded on 2021/05/27
|28
|7393
|200
Project
AI Summary
This project presents a comprehensive financial statement analysis of Wesfarmers' half-year report. It begins by evaluating changes in strategy and competitive strategy analysis based on the half-yearly results, including the identification of yields from share investments. The analysis then delves into operating, investment, and financial management decomposition, assessing key financial ratios and their implications. The project also includes an evaluation of the sustainable growth rate and cash flow statements, alongside forecasting for the company. Furthermore, the project explores the impact of the half-year report on share prices and concludes with a reflective section discussing the student's learning experience, the evolving understanding of financial ratios, and the interrelationships among them. The analysis utilizes the provided financial data to assess the company's performance, investment potential, and financial health.
Running head: FINANCIAL STATEMENT ANALYSIS
Financial Statement Analysis
Name of the Student:
Name of the University:
Authors Note:
Financial Statement Analysis
Name of the Student:
Name of the University:
Authors Note:
Paraphrase This Document
Need a fresh take? Get an instant paraphrase of this document with our AI Paraphraser
FINANCIAL STATEMENT ANALYSIS
1
Table of Contents
Part 1 of Assignment 2:..............................................................................................................3
1.a) Evaluating any change in strategy analysis based on half-yearly results:..........................3
1.b) Evaluating the change in competitive strategy analysis based on half-yearly results:.......3
1.c.i) Identifying the yield based on half-yearly report by using the shares purchased on 28
March:........................................................................................................................................4
1.c.i) Identifying and comparing the current half-yearly yield with full year yield:.................4
Part 2 of Assignment 2:..............................................................................................................5
2.a Evaluating and assessing the operating Management Decomposition:................................5
2.b Assessing and reporting Investment management decomposition:.....................................7
2.c Assessing and reporting Financial management decomposition:.........................................9
2.d Evaluating and reporting sustainable growth rate:.............................................................12
2.e Evaluating the cash flow statement:...................................................................................13
3.a Identifying the forecast for the company:..........................................................................15
3.b Evaluating and discussing the appropriate forecast strategy:............................................16
3.c Depicting the cash flow forecast, which analysing the statement:.....................................16
4.a Identifying the change in share price within 7 days of half-year report release:...............18
4.b Identifying the change in share price within 31- December and half-year report release: 19
4.c Identifying the change in share price between the half-year report release and 30 April:.20
Part 3 of Assignment 2: Reflective Thinking...........................................................................21
5.a Analysing and discussing on each of the three analyses and how the knowledge changed:
..................................................................................................................................................21
5.b Evaluating how my knowledge improved after receiving feedback from requirement 1:.22
5.c Evaluating how the perception altered regarding the purpose of ratios:............................23
FINANCIAL STATEMENT ANALYSIS
2
5.d Evaluating how the perception of interrelationship among financial ratios and company’s
financial position changed:......................................................................................................23
Reference and Bibliography:....................................................................................................25
⊘ This is a preview!⊘
Do you want full access?
Subscribe today to unlock all pages.
Trusted by 1+ million students worldwide
FINANCIAL STATEMENT ANALYSIS
3
Part 1 of Assignment 2:
1.a) Evaluating any change in strategy analysis based on half-yearly results:
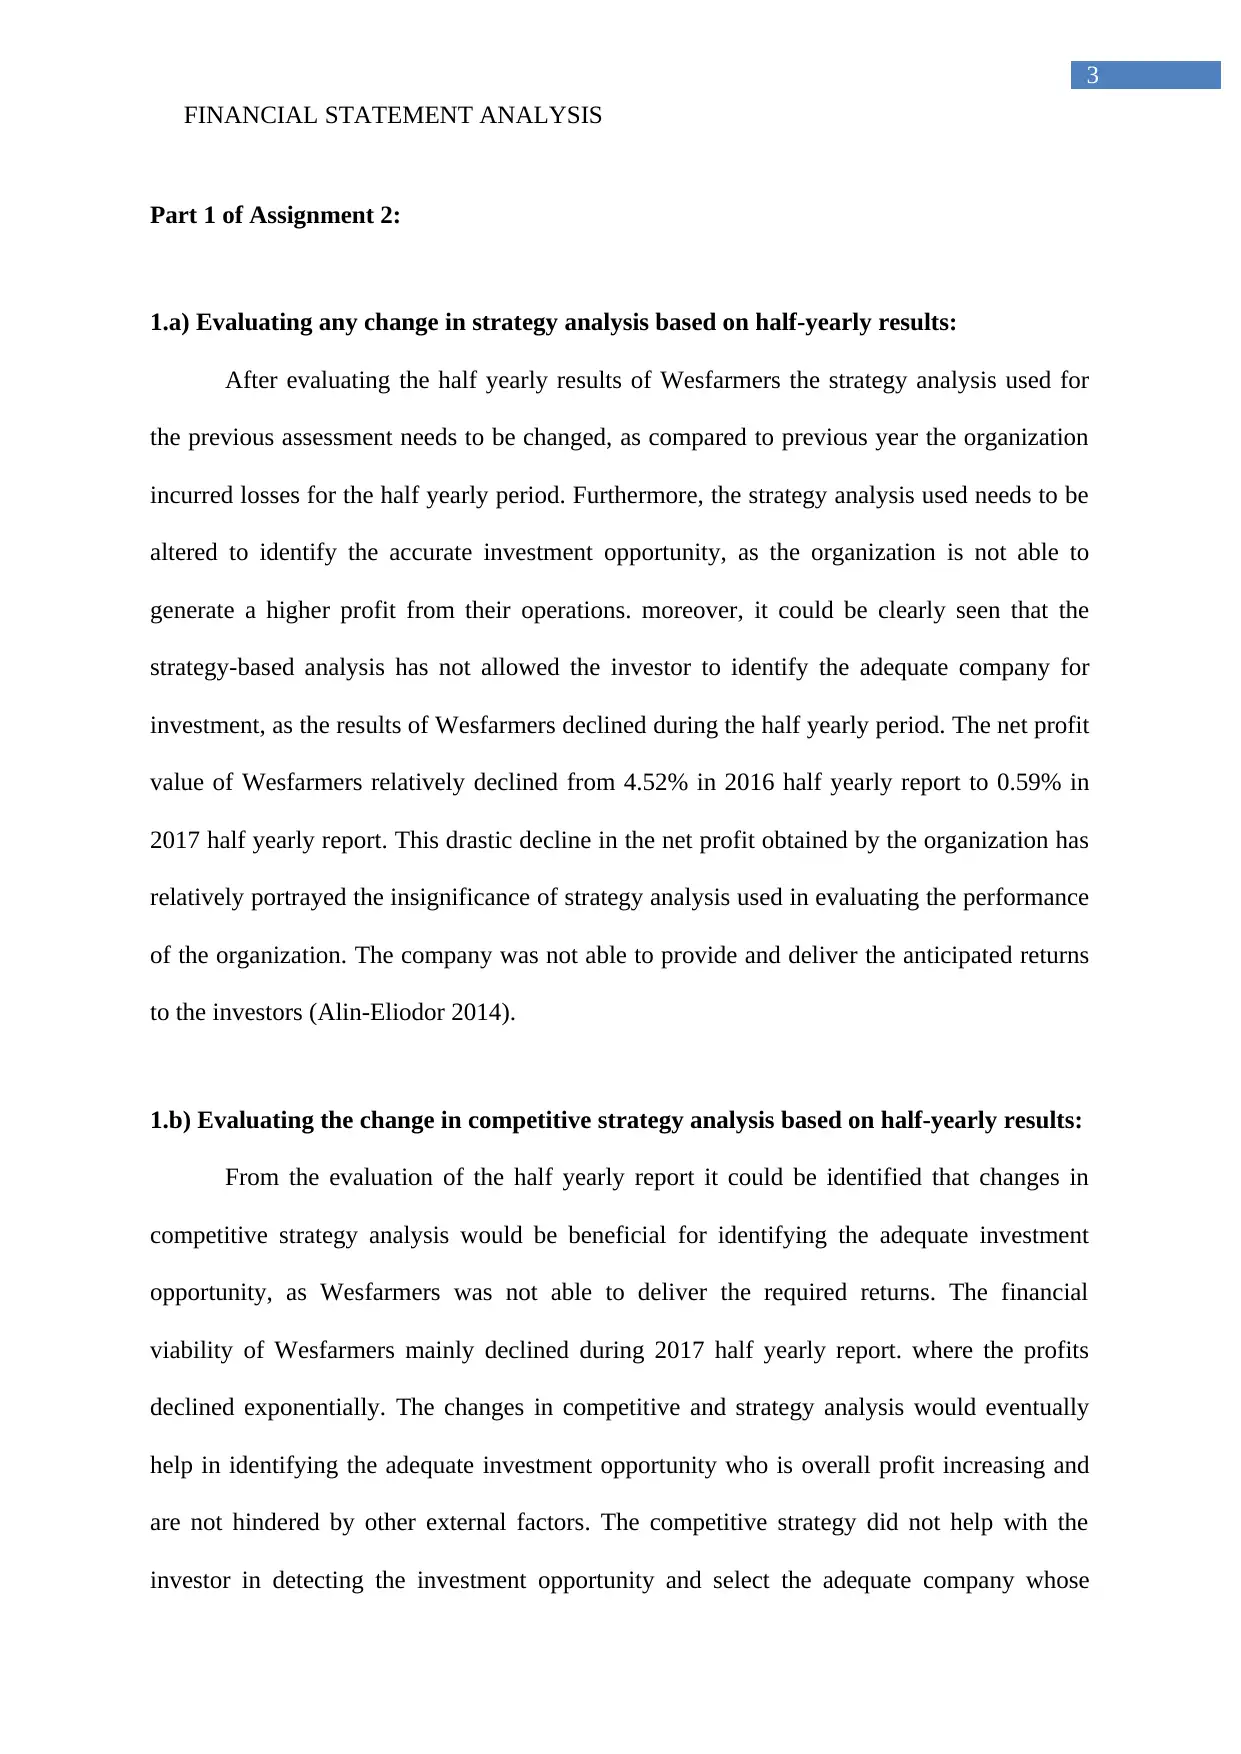
After evaluating the half yearly results of Wesfarmers the strategy analysis used for
the previous assessment needs to be changed, as compared to previous year the organization
incurred losses for the half yearly period. Furthermore, the strategy analysis used needs to be
altered to identify the accurate investment opportunity, as the organization is not able to
generate a higher profit from their operations. moreover, it could be clearly seen that the
strategy-based analysis has not allowed the investor to identify the adequate company for
investment, as the results of Wesfarmers declined during the half yearly period. The net profit
value of Wesfarmers relatively declined from 4.52% in 2016 half yearly report to 0.59% in
2017 half yearly report. This drastic decline in the net profit obtained by the organization has
relatively portrayed the insignificance of strategy analysis used in evaluating the performance
of the organization. The company was not able to provide and deliver the anticipated returns
to the investors (Alin-Eliodor 2014).
1.b) Evaluating the change in competitive strategy analysis based on half-yearly results:
From the evaluation of the half yearly report it could be identified that changes in
competitive strategy analysis would be beneficial for identifying the adequate investment
opportunity, as Wesfarmers was not able to deliver the required returns. The financial
viability of Wesfarmers mainly declined during 2017 half yearly report. where the profits
declined exponentially. The changes in competitive and strategy analysis would eventually
help in identifying the adequate investment opportunity who is overall profit increasing and
are not hindered by other external factors. The competitive strategy did not help with the
investor in detecting the investment opportunity and select the adequate company whose
3
Part 1 of Assignment 2:
1.a) Evaluating any change in strategy analysis based on half-yearly results:
After evaluating the half yearly results of Wesfarmers the strategy analysis used for
the previous assessment needs to be changed, as compared to previous year the organization
incurred losses for the half yearly period. Furthermore, the strategy analysis used needs to be
altered to identify the accurate investment opportunity, as the organization is not able to
generate a higher profit from their operations. moreover, it could be clearly seen that the
strategy-based analysis has not allowed the investor to identify the adequate company for
investment, as the results of Wesfarmers declined during the half yearly period. The net profit
value of Wesfarmers relatively declined from 4.52% in 2016 half yearly report to 0.59% in
2017 half yearly report. This drastic decline in the net profit obtained by the organization has
relatively portrayed the insignificance of strategy analysis used in evaluating the performance
of the organization. The company was not able to provide and deliver the anticipated returns
to the investors (Alin-Eliodor 2014).
1.b) Evaluating the change in competitive strategy analysis based on half-yearly results:
From the evaluation of the half yearly report it could be identified that changes in
competitive strategy analysis would be beneficial for identifying the adequate investment
opportunity, as Wesfarmers was not able to deliver the required returns. The financial
viability of Wesfarmers mainly declined during 2017 half yearly report. where the profits
declined exponentially. The changes in competitive and strategy analysis would eventually
help in identifying the adequate investment opportunity who is overall profit increasing and
are not hindered by other external factors. The competitive strategy did not help with the
investor in detecting the investment opportunity and select the adequate company whose
Paraphrase This Document
Need a fresh take? Get an instant paraphrase of this document with our AI Paraphraser
FINANCIAL STATEMENT ANALYSIS
4
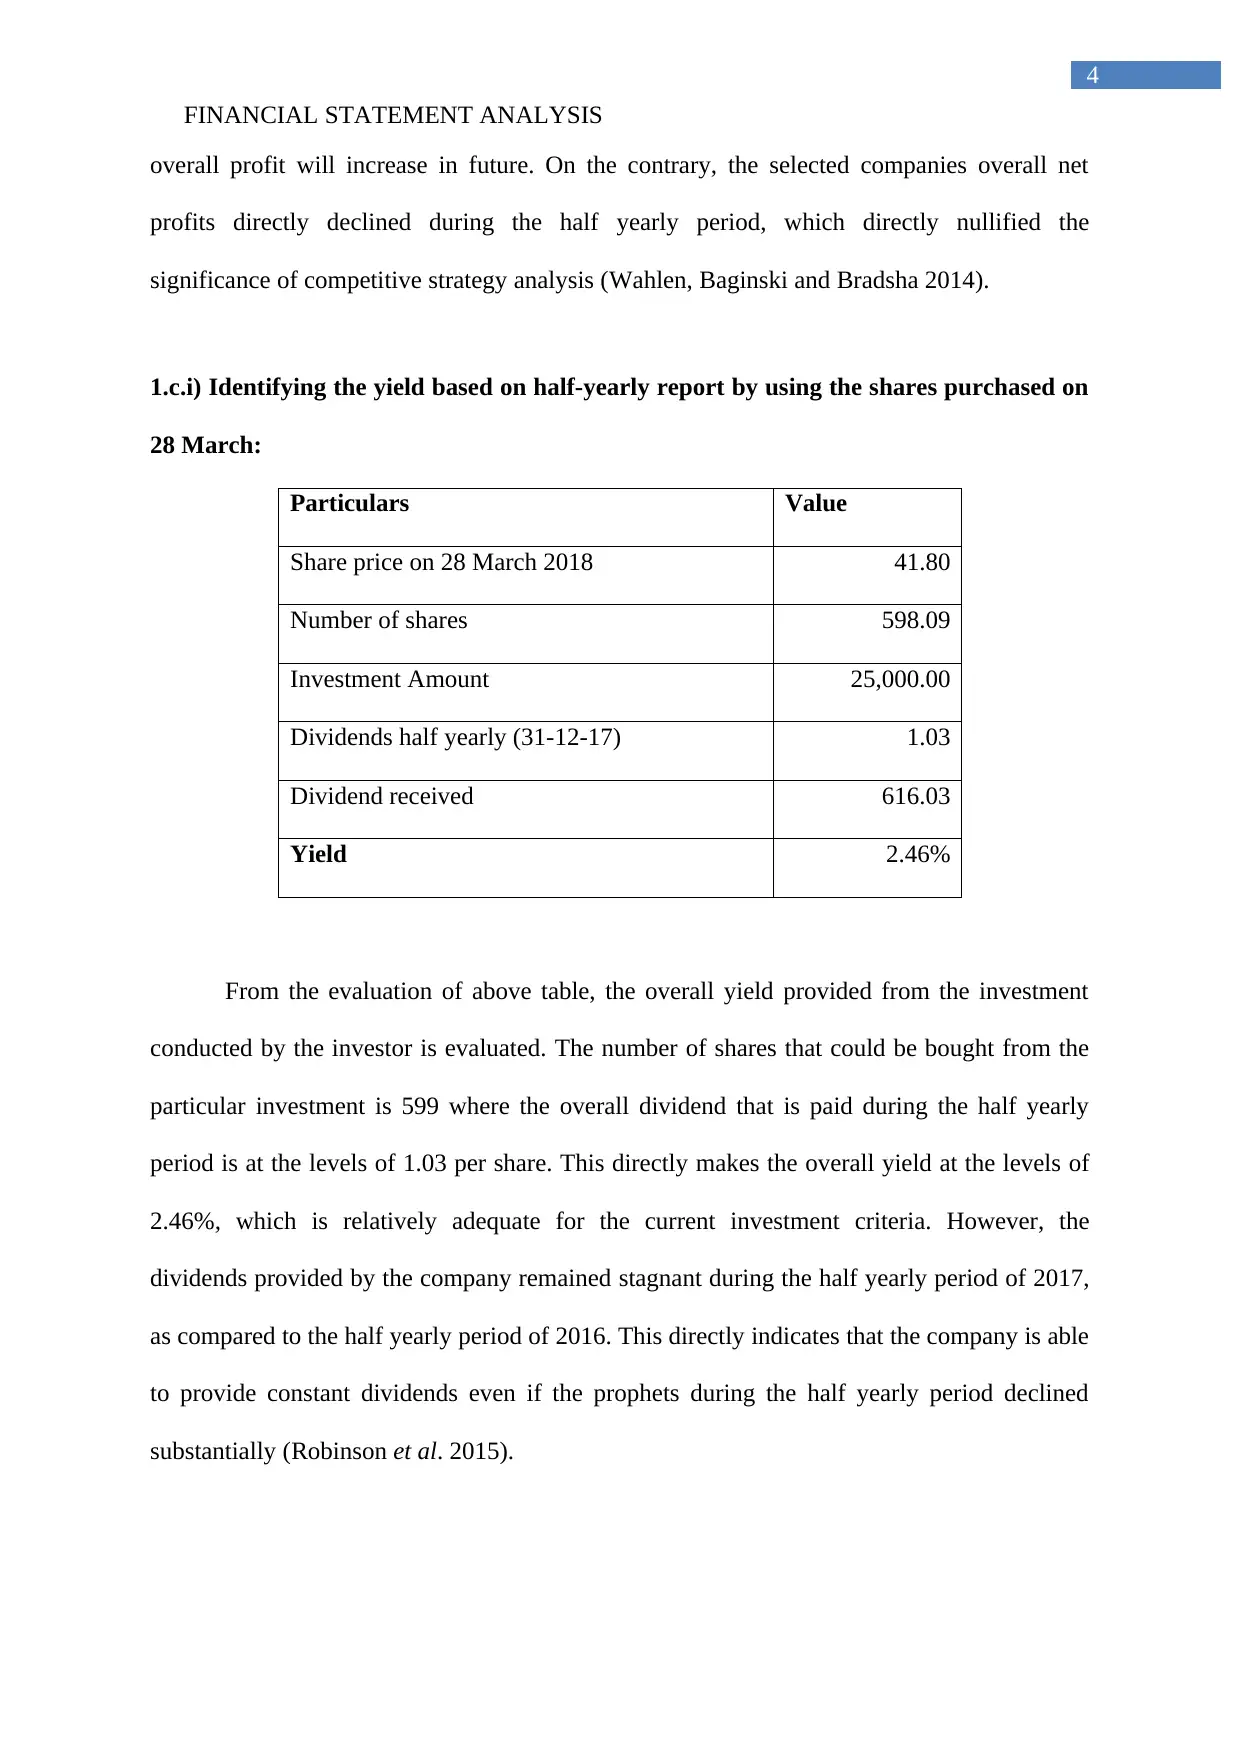
overall profit will increase in future. On the contrary, the selected companies overall net
profits directly declined during the half yearly period, which directly nullified the
significance of competitive strategy analysis (Wahlen, Baginski and Bradsha 2014).
1.c.i) Identifying the yield based on half-yearly report by using the shares purchased on
28 March:
Particulars Value
Share price on 28 March 2018 41.80
Number of shares 598.09
Investment Amount 25,000.00
Dividends half yearly (31-12-17) 1.03
Dividend received 616.03
Yield 2.46%
From the evaluation of above table, the overall yield provided from the investment
conducted by the investor is evaluated. The number of shares that could be bought from the
particular investment is 599 where the overall dividend that is paid during the half yearly
period is at the levels of 1.03 per share. This directly makes the overall yield at the levels of
2.46%, which is relatively adequate for the current investment criteria. However, the
dividends provided by the company remained stagnant during the half yearly period of 2017,
as compared to the half yearly period of 2016. This directly indicates that the company is able
to provide constant dividends even if the prophets during the half yearly period declined
substantially (Robinson et al. 2015).
4
overall profit will increase in future. On the contrary, the selected companies overall net
profits directly declined during the half yearly period, which directly nullified the
significance of competitive strategy analysis (Wahlen, Baginski and Bradsha 2014).
1.c.i) Identifying the yield based on half-yearly report by using the shares purchased on
28 March:
Particulars Value
Share price on 28 March 2018 41.80
Number of shares 598.09
Investment Amount 25,000.00
Dividends half yearly (31-12-17) 1.03
Dividend received 616.03
Yield 2.46%
From the evaluation of above table, the overall yield provided from the investment
conducted by the investor is evaluated. The number of shares that could be bought from the
particular investment is 599 where the overall dividend that is paid during the half yearly
period is at the levels of 1.03 per share. This directly makes the overall yield at the levels of
2.46%, which is relatively adequate for the current investment criteria. However, the
dividends provided by the company remained stagnant during the half yearly period of 2017,
as compared to the half yearly period of 2016. This directly indicates that the company is able
to provide constant dividends even if the prophets during the half yearly period declined
substantially (Robinson et al. 2015).
FINANCIAL STATEMENT ANALYSIS
5
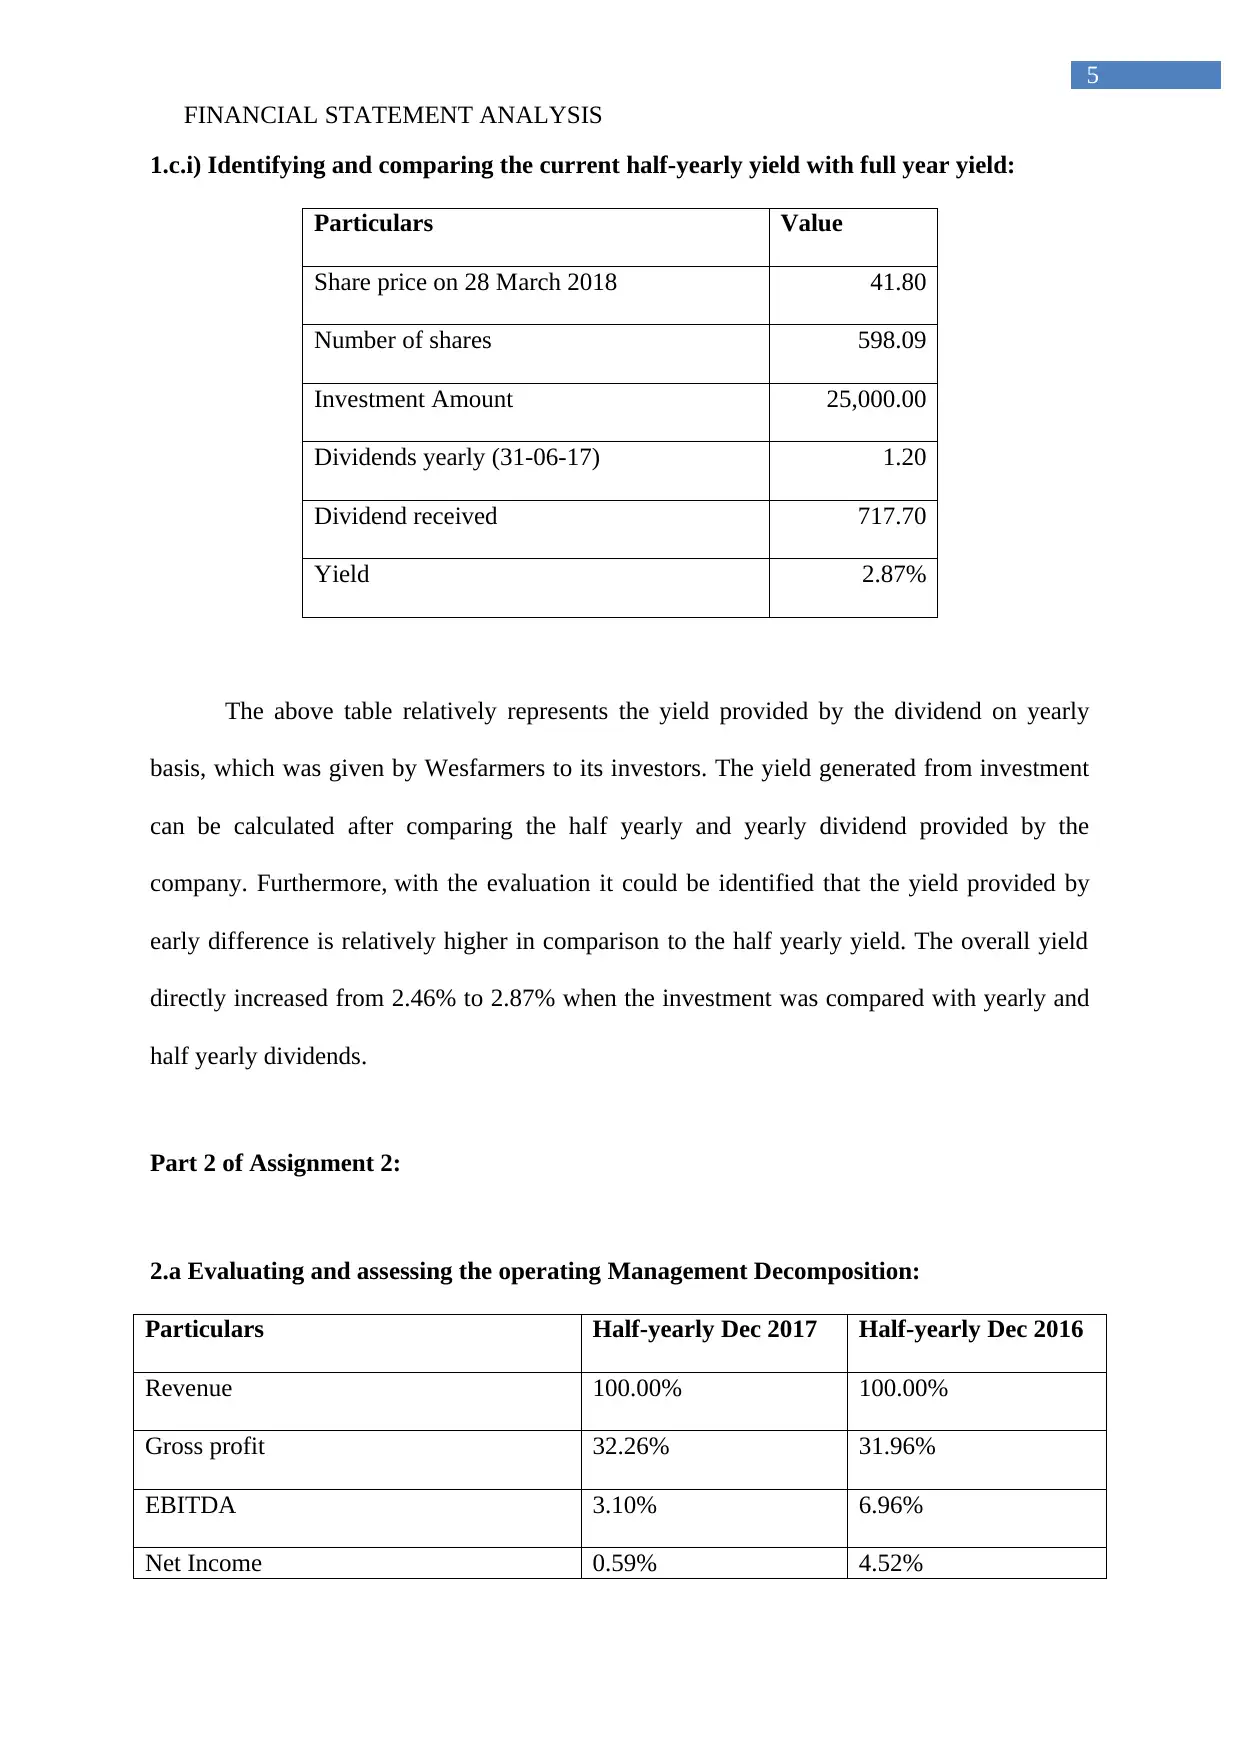
1.c.i) Identifying and comparing the current half-yearly yield with full year yield:
Particulars Value
Share price on 28 March 2018 41.80
Number of shares 598.09
Investment Amount 25,000.00
Dividends yearly (31-06-17) 1.20
Dividend received 717.70
Yield 2.87%
The above table relatively represents the yield provided by the dividend on yearly
basis, which was given by Wesfarmers to its investors. The yield generated from investment
can be calculated after comparing the half yearly and yearly dividend provided by the
company. Furthermore, with the evaluation it could be identified that the yield provided by
early difference is relatively higher in comparison to the half yearly yield. The overall yield
directly increased from 2.46% to 2.87% when the investment was compared with yearly and
half yearly dividends.
Part 2 of Assignment 2:
2.a Evaluating and assessing the operating Management Decomposition:
Particulars Half-yearly Dec 2017 Half-yearly Dec 2016
Revenue 100.00% 100.00%
Gross profit 32.26% 31.96%
EBITDA 3.10% 6.96%
Net Income 0.59% 4.52%
5
1.c.i) Identifying and comparing the current half-yearly yield with full year yield:
Particulars Value
Share price on 28 March 2018 41.80
Number of shares 598.09
Investment Amount 25,000.00
Dividends yearly (31-06-17) 1.20
Dividend received 717.70
Yield 2.87%
The above table relatively represents the yield provided by the dividend on yearly
basis, which was given by Wesfarmers to its investors. The yield generated from investment
can be calculated after comparing the half yearly and yearly dividend provided by the
company. Furthermore, with the evaluation it could be identified that the yield provided by
early difference is relatively higher in comparison to the half yearly yield. The overall yield
directly increased from 2.46% to 2.87% when the investment was compared with yearly and
half yearly dividends.
Part 2 of Assignment 2:
2.a Evaluating and assessing the operating Management Decomposition:
Particulars Half-yearly Dec 2017 Half-yearly Dec 2016
Revenue 100.00% 100.00%
Gross profit 32.26% 31.96%
EBITDA 3.10% 6.96%
Net Income 0.59% 4.52%
⊘ This is a preview!⊘
Do you want full access?
Subscribe today to unlock all pages.
Trusted by 1+ million students worldwide
FINANCIAL STATEMENT ANALYSIS
6
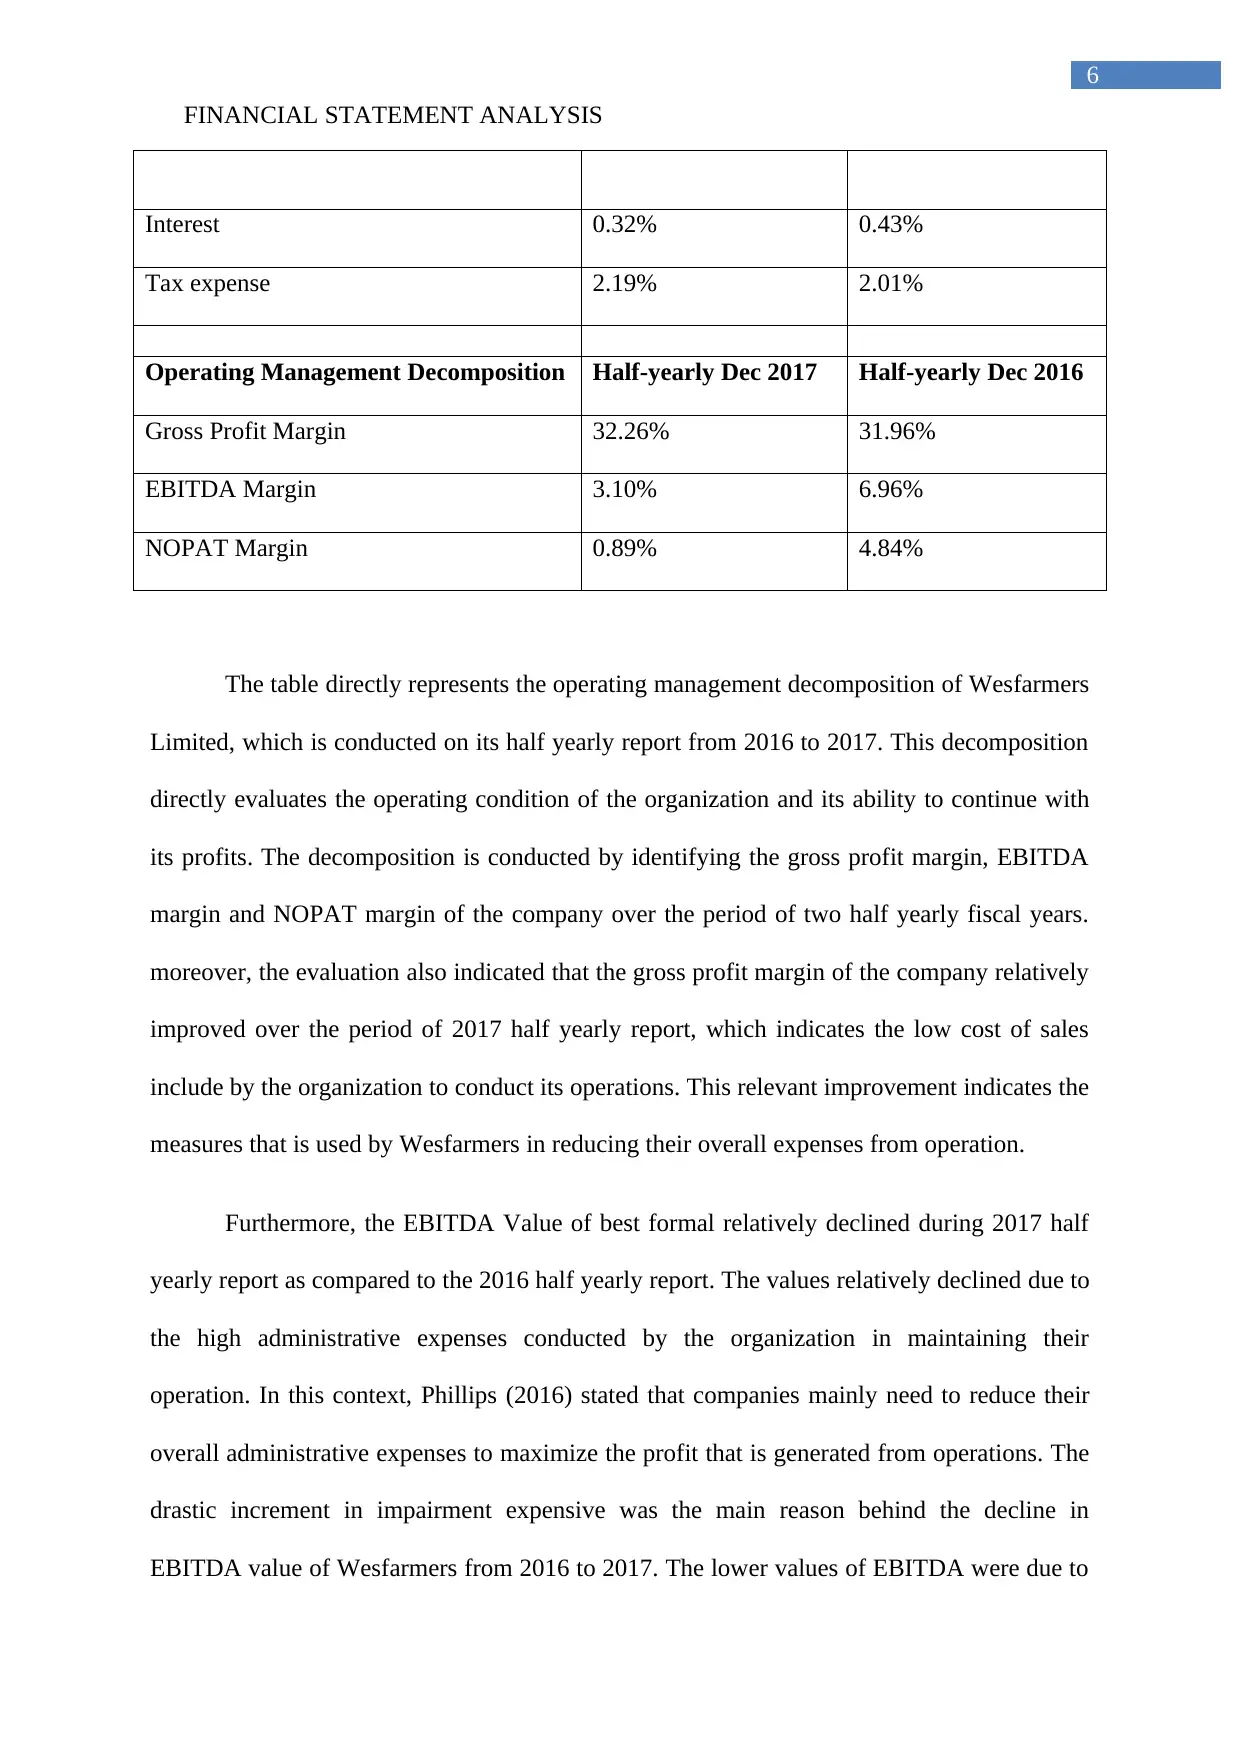
Interest 0.32% 0.43%
Tax expense 2.19% 2.01%
Operating Management Decomposition Half-yearly Dec 2017 Half-yearly Dec 2016
Gross Profit Margin 32.26% 31.96%
EBITDA Margin 3.10% 6.96%
NOPAT Margin 0.89% 4.84%
The table directly represents the operating management decomposition of Wesfarmers
Limited, which is conducted on its half yearly report from 2016 to 2017. This decomposition
directly evaluates the operating condition of the organization and its ability to continue with
its profits. The decomposition is conducted by identifying the gross profit margin, EBITDA
margin and NOPAT margin of the company over the period of two half yearly fiscal years.
moreover, the evaluation also indicated that the gross profit margin of the company relatively
improved over the period of 2017 half yearly report, which indicates the low cost of sales
include by the organization to conduct its operations. This relevant improvement indicates the
measures that is used by Wesfarmers in reducing their overall expenses from operation.
Furthermore, the EBITDA Value of best formal relatively declined during 2017 half
yearly report as compared to the 2016 half yearly report. The values relatively declined due to
the high administrative expenses conducted by the organization in maintaining their
operation. In this context, Phillips (2016) stated that companies mainly need to reduce their
overall administrative expenses to maximize the profit that is generated from operations. The
drastic increment in impairment expensive was the main reason behind the decline in
EBITDA value of Wesfarmers from 2016 to 2017. The lower values of EBITDA were due to
6
Interest 0.32% 0.43%
Tax expense 2.19% 2.01%
Operating Management Decomposition Half-yearly Dec 2017 Half-yearly Dec 2016
Gross Profit Margin 32.26% 31.96%
EBITDA Margin 3.10% 6.96%
NOPAT Margin 0.89% 4.84%
The table directly represents the operating management decomposition of Wesfarmers
Limited, which is conducted on its half yearly report from 2016 to 2017. This decomposition
directly evaluates the operating condition of the organization and its ability to continue with
its profits. The decomposition is conducted by identifying the gross profit margin, EBITDA
margin and NOPAT margin of the company over the period of two half yearly fiscal years.
moreover, the evaluation also indicated that the gross profit margin of the company relatively
improved over the period of 2017 half yearly report, which indicates the low cost of sales
include by the organization to conduct its operations. This relevant improvement indicates the
measures that is used by Wesfarmers in reducing their overall expenses from operation.
Furthermore, the EBITDA Value of best formal relatively declined during 2017 half
yearly report as compared to the 2016 half yearly report. The values relatively declined due to
the high administrative expenses conducted by the organization in maintaining their
operation. In this context, Phillips (2016) stated that companies mainly need to reduce their
overall administrative expenses to maximize the profit that is generated from operations. The
drastic increment in impairment expensive was the main reason behind the decline in
EBITDA value of Wesfarmers from 2016 to 2017. The lower values of EBITDA were due to
Paraphrase This Document
Need a fresh take? Get an instant paraphrase of this document with our AI Paraphraser
FINANCIAL STATEMENT ANALYSIS
7
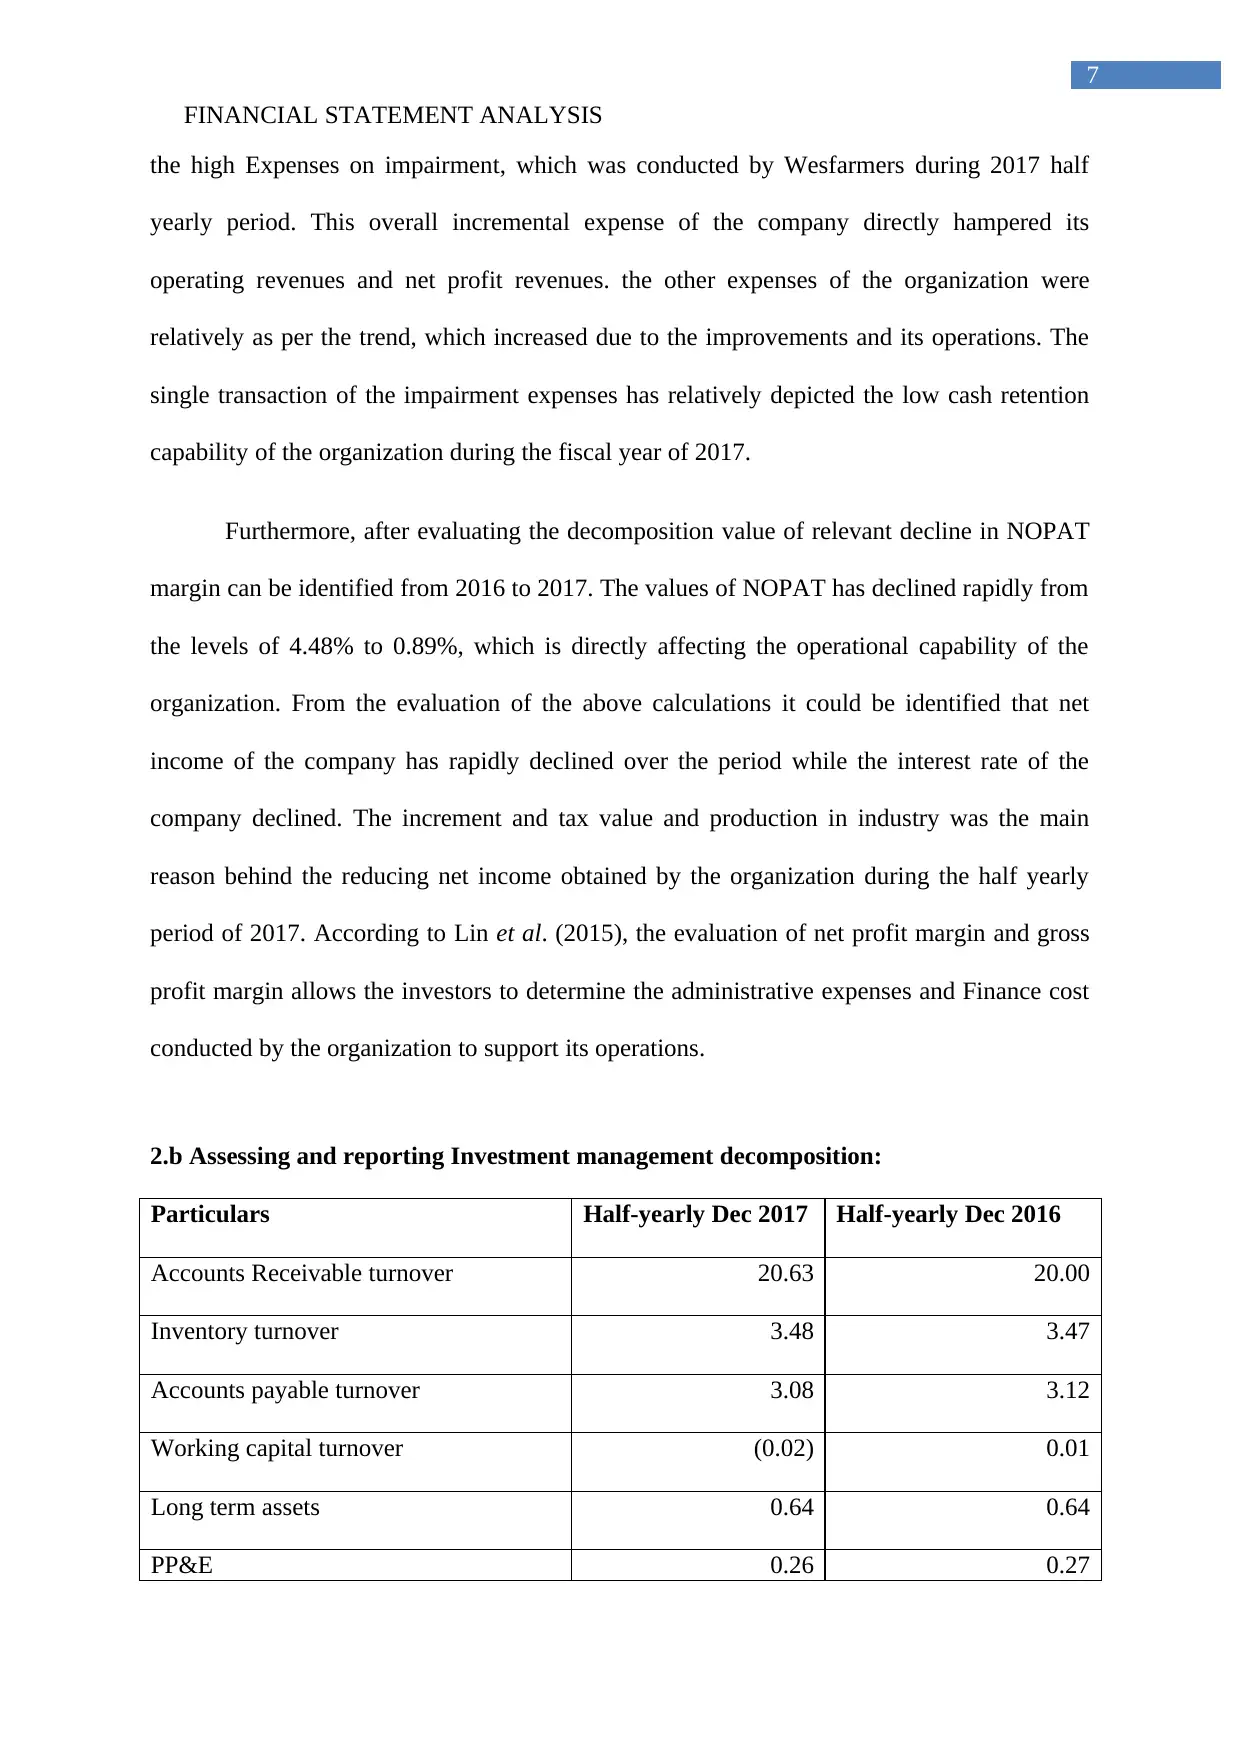
the high Expenses on impairment, which was conducted by Wesfarmers during 2017 half
yearly period. This overall incremental expense of the company directly hampered its
operating revenues and net profit revenues. the other expenses of the organization were
relatively as per the trend, which increased due to the improvements and its operations. The
single transaction of the impairment expenses has relatively depicted the low cash retention
capability of the organization during the fiscal year of 2017.
Furthermore, after evaluating the decomposition value of relevant decline in NOPAT
margin can be identified from 2016 to 2017. The values of NOPAT has declined rapidly from
the levels of 4.48% to 0.89%, which is directly affecting the operational capability of the
organization. From the evaluation of the above calculations it could be identified that net
income of the company has rapidly declined over the period while the interest rate of the
company declined. The increment and tax value and production in industry was the main
reason behind the reducing net income obtained by the organization during the half yearly
period of 2017. According to Lin et al. (2015), the evaluation of net profit margin and gross
profit margin allows the investors to determine the administrative expenses and Finance cost
conducted by the organization to support its operations.
2.b Assessing and reporting Investment management decomposition:
Particulars Half-yearly Dec 2017 Half-yearly Dec 2016
Accounts Receivable turnover 20.63 20.00
Inventory turnover 3.48 3.47
Accounts payable turnover 3.08 3.12
Working capital turnover (0.02) 0.01
Long term assets 0.64 0.64
PP&E 0.26 0.27
7
the high Expenses on impairment, which was conducted by Wesfarmers during 2017 half
yearly period. This overall incremental expense of the company directly hampered its
operating revenues and net profit revenues. the other expenses of the organization were
relatively as per the trend, which increased due to the improvements and its operations. The
single transaction of the impairment expenses has relatively depicted the low cash retention
capability of the organization during the fiscal year of 2017.
Furthermore, after evaluating the decomposition value of relevant decline in NOPAT
margin can be identified from 2016 to 2017. The values of NOPAT has declined rapidly from
the levels of 4.48% to 0.89%, which is directly affecting the operational capability of the
organization. From the evaluation of the above calculations it could be identified that net
income of the company has rapidly declined over the period while the interest rate of the
company declined. The increment and tax value and production in industry was the main
reason behind the reducing net income obtained by the organization during the half yearly
period of 2017. According to Lin et al. (2015), the evaluation of net profit margin and gross
profit margin allows the investors to determine the administrative expenses and Finance cost
conducted by the organization to support its operations.
2.b Assessing and reporting Investment management decomposition:
Particulars Half-yearly Dec 2017 Half-yearly Dec 2016
Accounts Receivable turnover 20.63 20.00
Inventory turnover 3.48 3.47
Accounts payable turnover 3.08 3.12
Working capital turnover (0.02) 0.01
Long term assets 0.64 0.64
PP&E 0.26 0.27
FINANCIAL STATEMENT ANALYSIS
8
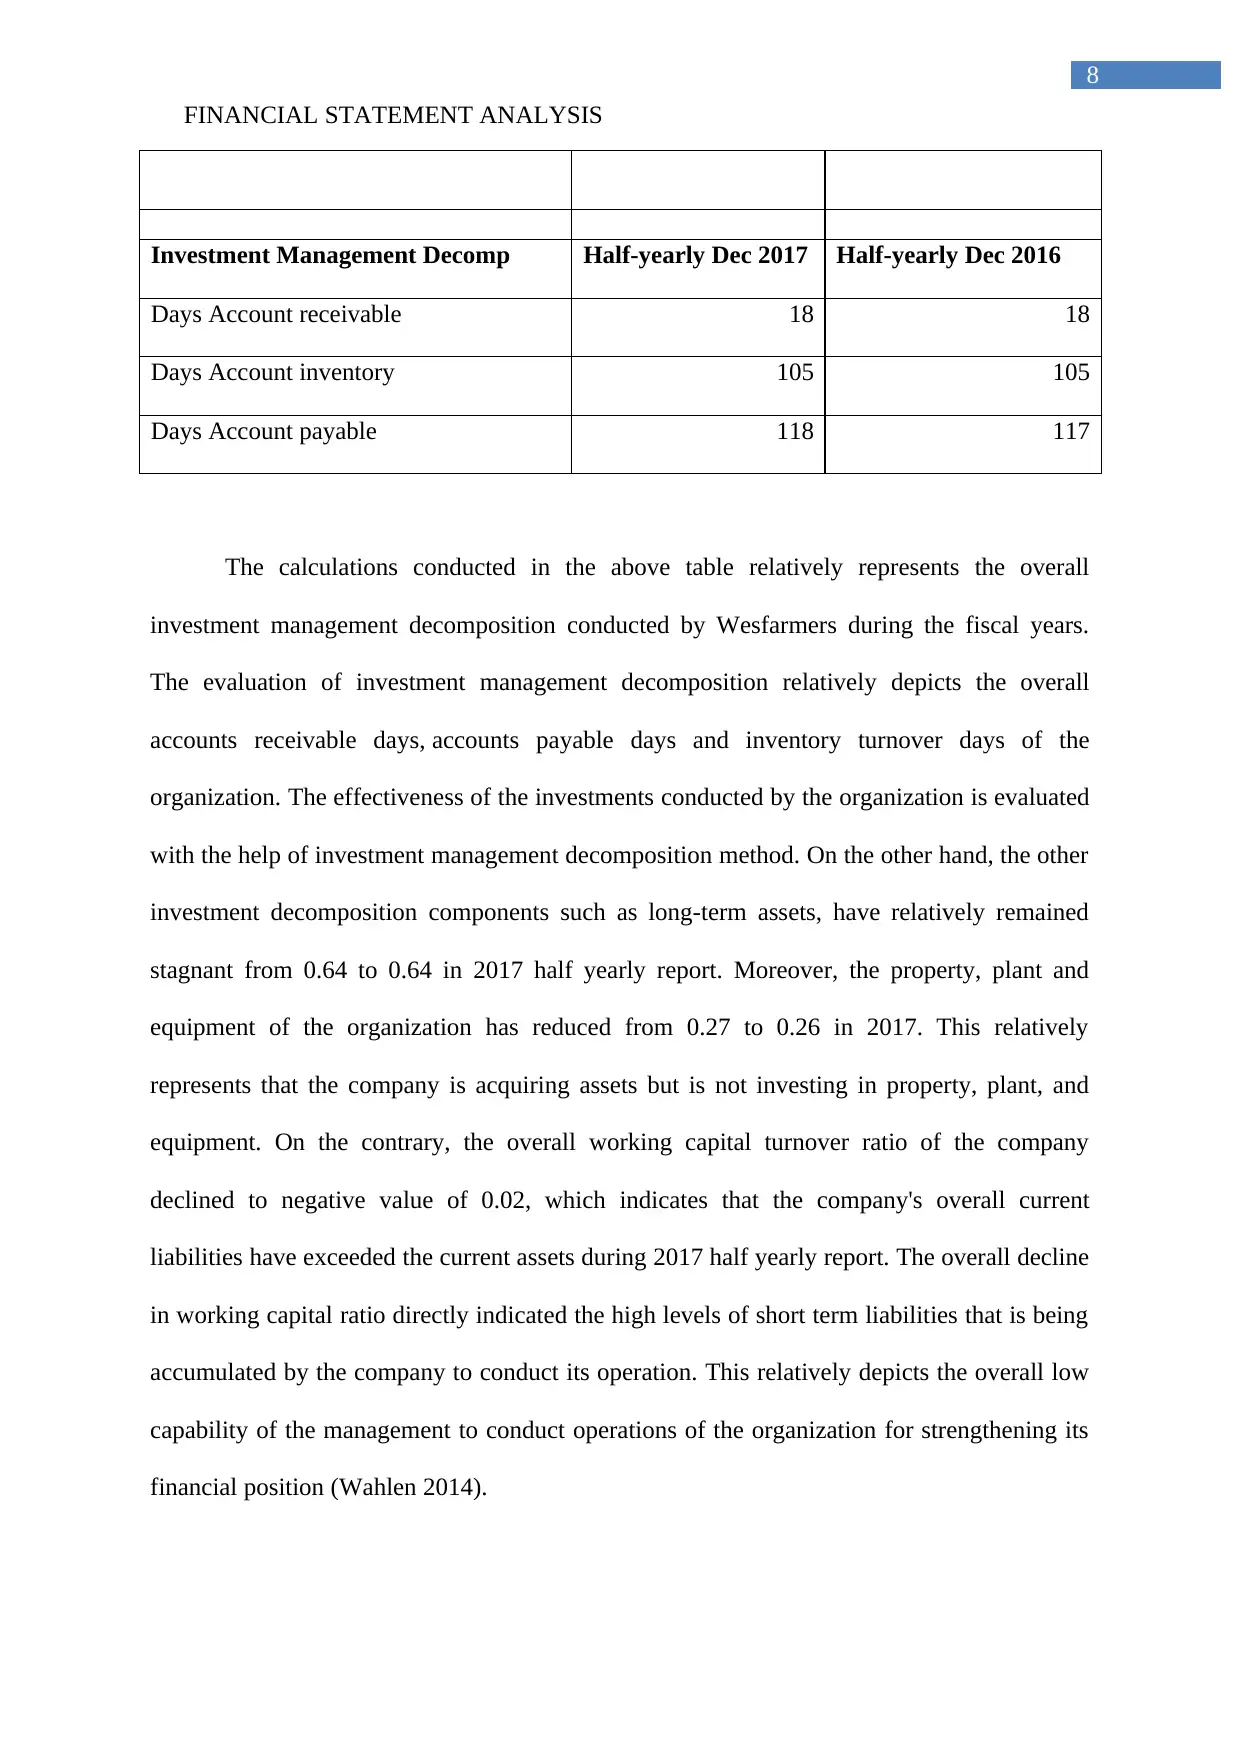
Investment Management Decomp Half-yearly Dec 2017 Half-yearly Dec 2016
Days Account receivable 18 18
Days Account inventory 105 105
Days Account payable 118 117
The calculations conducted in the above table relatively represents the overall
investment management decomposition conducted by Wesfarmers during the fiscal years.
The evaluation of investment management decomposition relatively depicts the overall
accounts receivable days, accounts payable days and inventory turnover days of the
organization. The effectiveness of the investments conducted by the organization is evaluated
with the help of investment management decomposition method. On the other hand, the other
investment decomposition components such as long-term assets, have relatively remained
stagnant from 0.64 to 0.64 in 2017 half yearly report. Moreover, the property, plant and
equipment of the organization has reduced from 0.27 to 0.26 in 2017. This relatively
represents that the company is acquiring assets but is not investing in property, plant, and
equipment. On the contrary, the overall working capital turnover ratio of the company
declined to negative value of 0.02, which indicates that the company's overall current
liabilities have exceeded the current assets during 2017 half yearly report. The overall decline
in working capital ratio directly indicated the high levels of short term liabilities that is being
accumulated by the company to conduct its operation. This relatively depicts the overall low
capability of the management to conduct operations of the organization for strengthening its
financial position (Wahlen 2014).
8
Investment Management Decomp Half-yearly Dec 2017 Half-yearly Dec 2016
Days Account receivable 18 18
Days Account inventory 105 105
Days Account payable 118 117
The calculations conducted in the above table relatively represents the overall
investment management decomposition conducted by Wesfarmers during the fiscal years.
The evaluation of investment management decomposition relatively depicts the overall
accounts receivable days, accounts payable days and inventory turnover days of the
organization. The effectiveness of the investments conducted by the organization is evaluated
with the help of investment management decomposition method. On the other hand, the other
investment decomposition components such as long-term assets, have relatively remained
stagnant from 0.64 to 0.64 in 2017 half yearly report. Moreover, the property, plant and
equipment of the organization has reduced from 0.27 to 0.26 in 2017. This relatively
represents that the company is acquiring assets but is not investing in property, plant, and
equipment. On the contrary, the overall working capital turnover ratio of the company
declined to negative value of 0.02, which indicates that the company's overall current
liabilities have exceeded the current assets during 2017 half yearly report. The overall decline
in working capital ratio directly indicated the high levels of short term liabilities that is being
accumulated by the company to conduct its operation. This relatively depicts the overall low
capability of the management to conduct operations of the organization for strengthening its
financial position (Wahlen 2014).
⊘ This is a preview!⊘
Do you want full access?
Subscribe today to unlock all pages.
Trusted by 1+ million students worldwide
FINANCIAL STATEMENT ANALYSIS
9
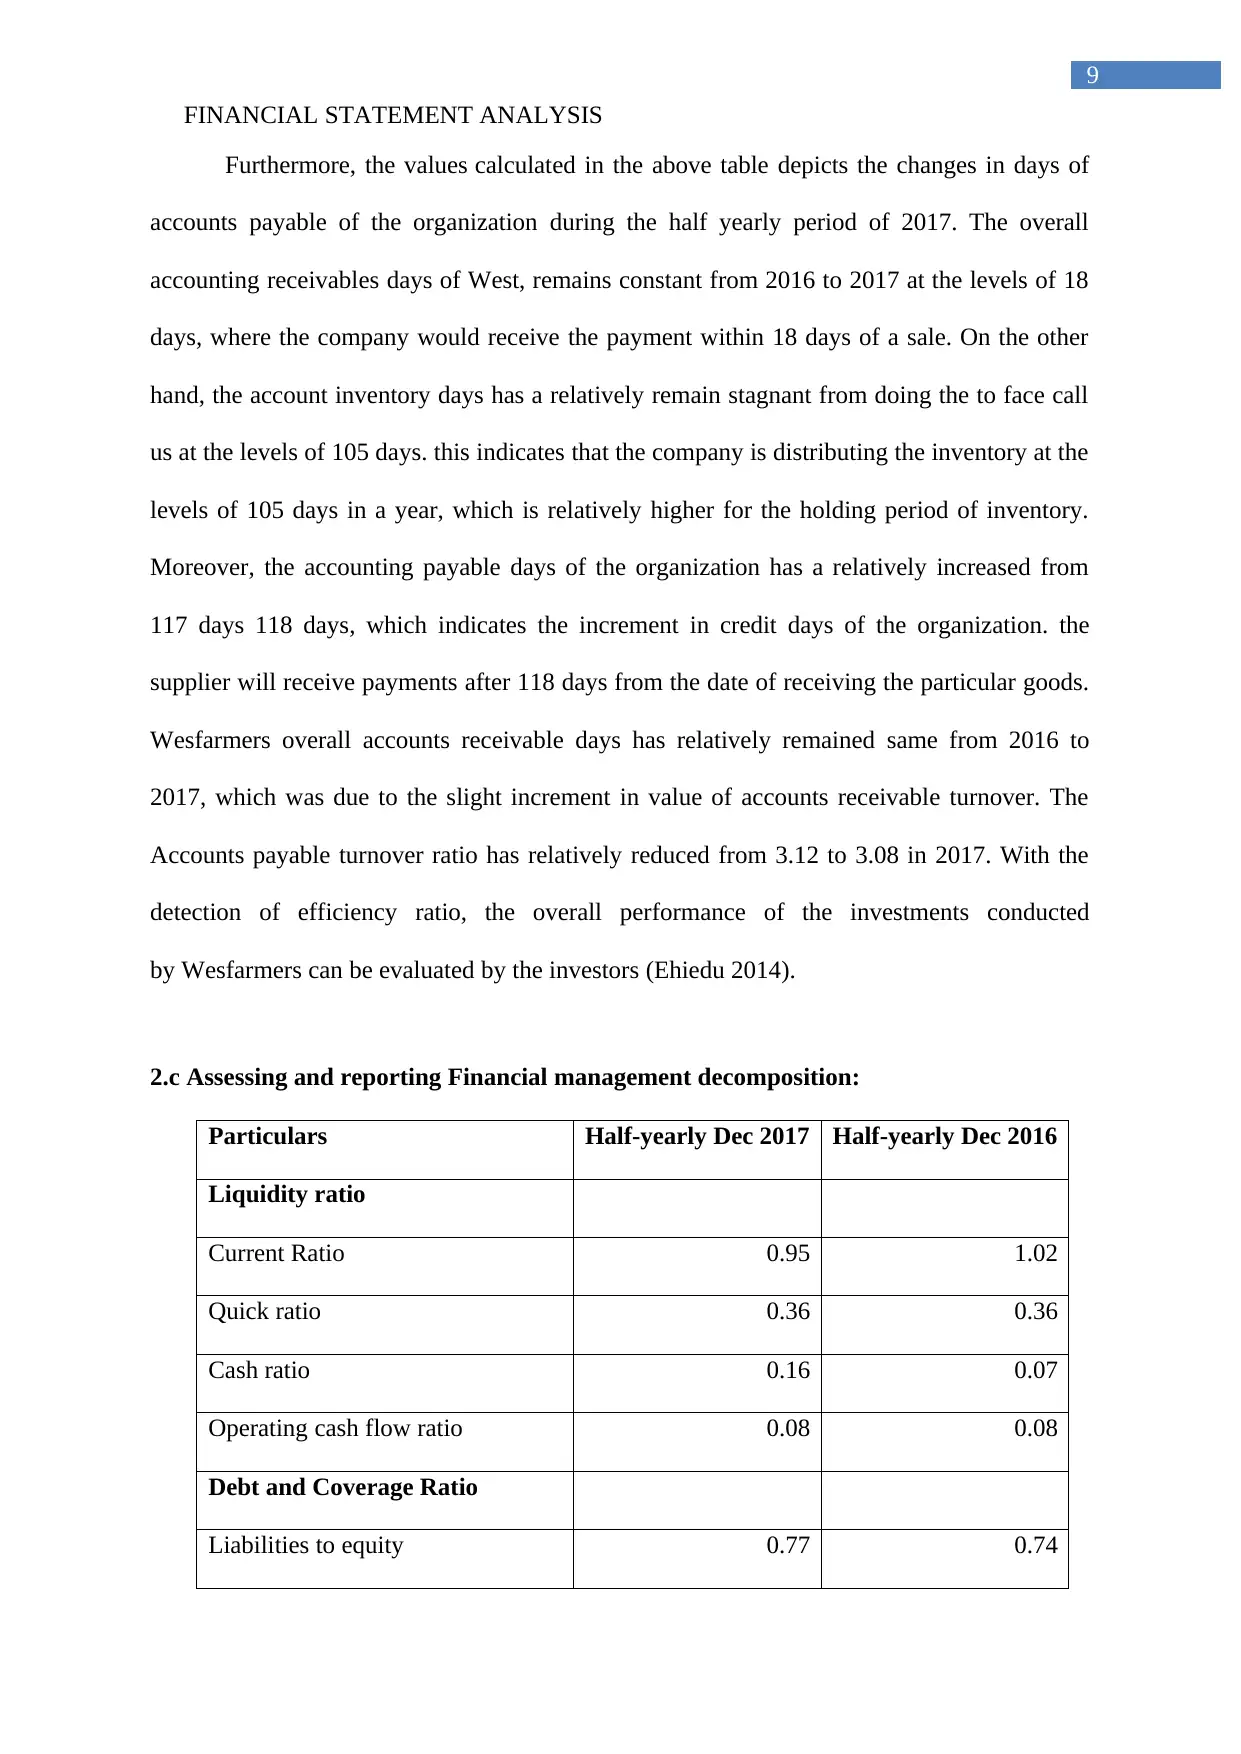
Furthermore, the values calculated in the above table depicts the changes in days of
accounts payable of the organization during the half yearly period of 2017. The overall
accounting receivables days of West, remains constant from 2016 to 2017 at the levels of 18
days, where the company would receive the payment within 18 days of a sale. On the other
hand, the account inventory days has a relatively remain stagnant from doing the to face call
us at the levels of 105 days. this indicates that the company is distributing the inventory at the
levels of 105 days in a year, which is relatively higher for the holding period of inventory.
Moreover, the accounting payable days of the organization has a relatively increased from
117 days 118 days, which indicates the increment in credit days of the organization. the
supplier will receive payments after 118 days from the date of receiving the particular goods.
Wesfarmers overall accounts receivable days has relatively remained same from 2016 to
2017, which was due to the slight increment in value of accounts receivable turnover. The
Accounts payable turnover ratio has relatively reduced from 3.12 to 3.08 in 2017. With the
detection of efficiency ratio, the overall performance of the investments conducted
by Wesfarmers can be evaluated by the investors (Ehiedu 2014).
2.c Assessing and reporting Financial management decomposition:
Particulars Half-yearly Dec 2017 Half-yearly Dec 2016
Liquidity ratio
Current Ratio 0.95 1.02
Quick ratio 0.36 0.36
Cash ratio 0.16 0.07
Operating cash flow ratio 0.08 0.08
Debt and Coverage Ratio
Liabilities to equity 0.77 0.74
9
Furthermore, the values calculated in the above table depicts the changes in days of
accounts payable of the organization during the half yearly period of 2017. The overall
accounting receivables days of West, remains constant from 2016 to 2017 at the levels of 18
days, where the company would receive the payment within 18 days of a sale. On the other
hand, the account inventory days has a relatively remain stagnant from doing the to face call
us at the levels of 105 days. this indicates that the company is distributing the inventory at the
levels of 105 days in a year, which is relatively higher for the holding period of inventory.
Moreover, the accounting payable days of the organization has a relatively increased from
117 days 118 days, which indicates the increment in credit days of the organization. the
supplier will receive payments after 118 days from the date of receiving the particular goods.
Wesfarmers overall accounts receivable days has relatively remained same from 2016 to
2017, which was due to the slight increment in value of accounts receivable turnover. The
Accounts payable turnover ratio has relatively reduced from 3.12 to 3.08 in 2017. With the
detection of efficiency ratio, the overall performance of the investments conducted
by Wesfarmers can be evaluated by the investors (Ehiedu 2014).
2.c Assessing and reporting Financial management decomposition:
Particulars Half-yearly Dec 2017 Half-yearly Dec 2016
Liquidity ratio
Current Ratio 0.95 1.02
Quick ratio 0.36 0.36
Cash ratio 0.16 0.07
Operating cash flow ratio 0.08 0.08
Debt and Coverage Ratio
Liabilities to equity 0.77 0.74
Paraphrase This Document
Need a fresh take? Get an instant paraphrase of this document with our AI Paraphraser
FINANCIAL STATEMENT ANALYSIS
10
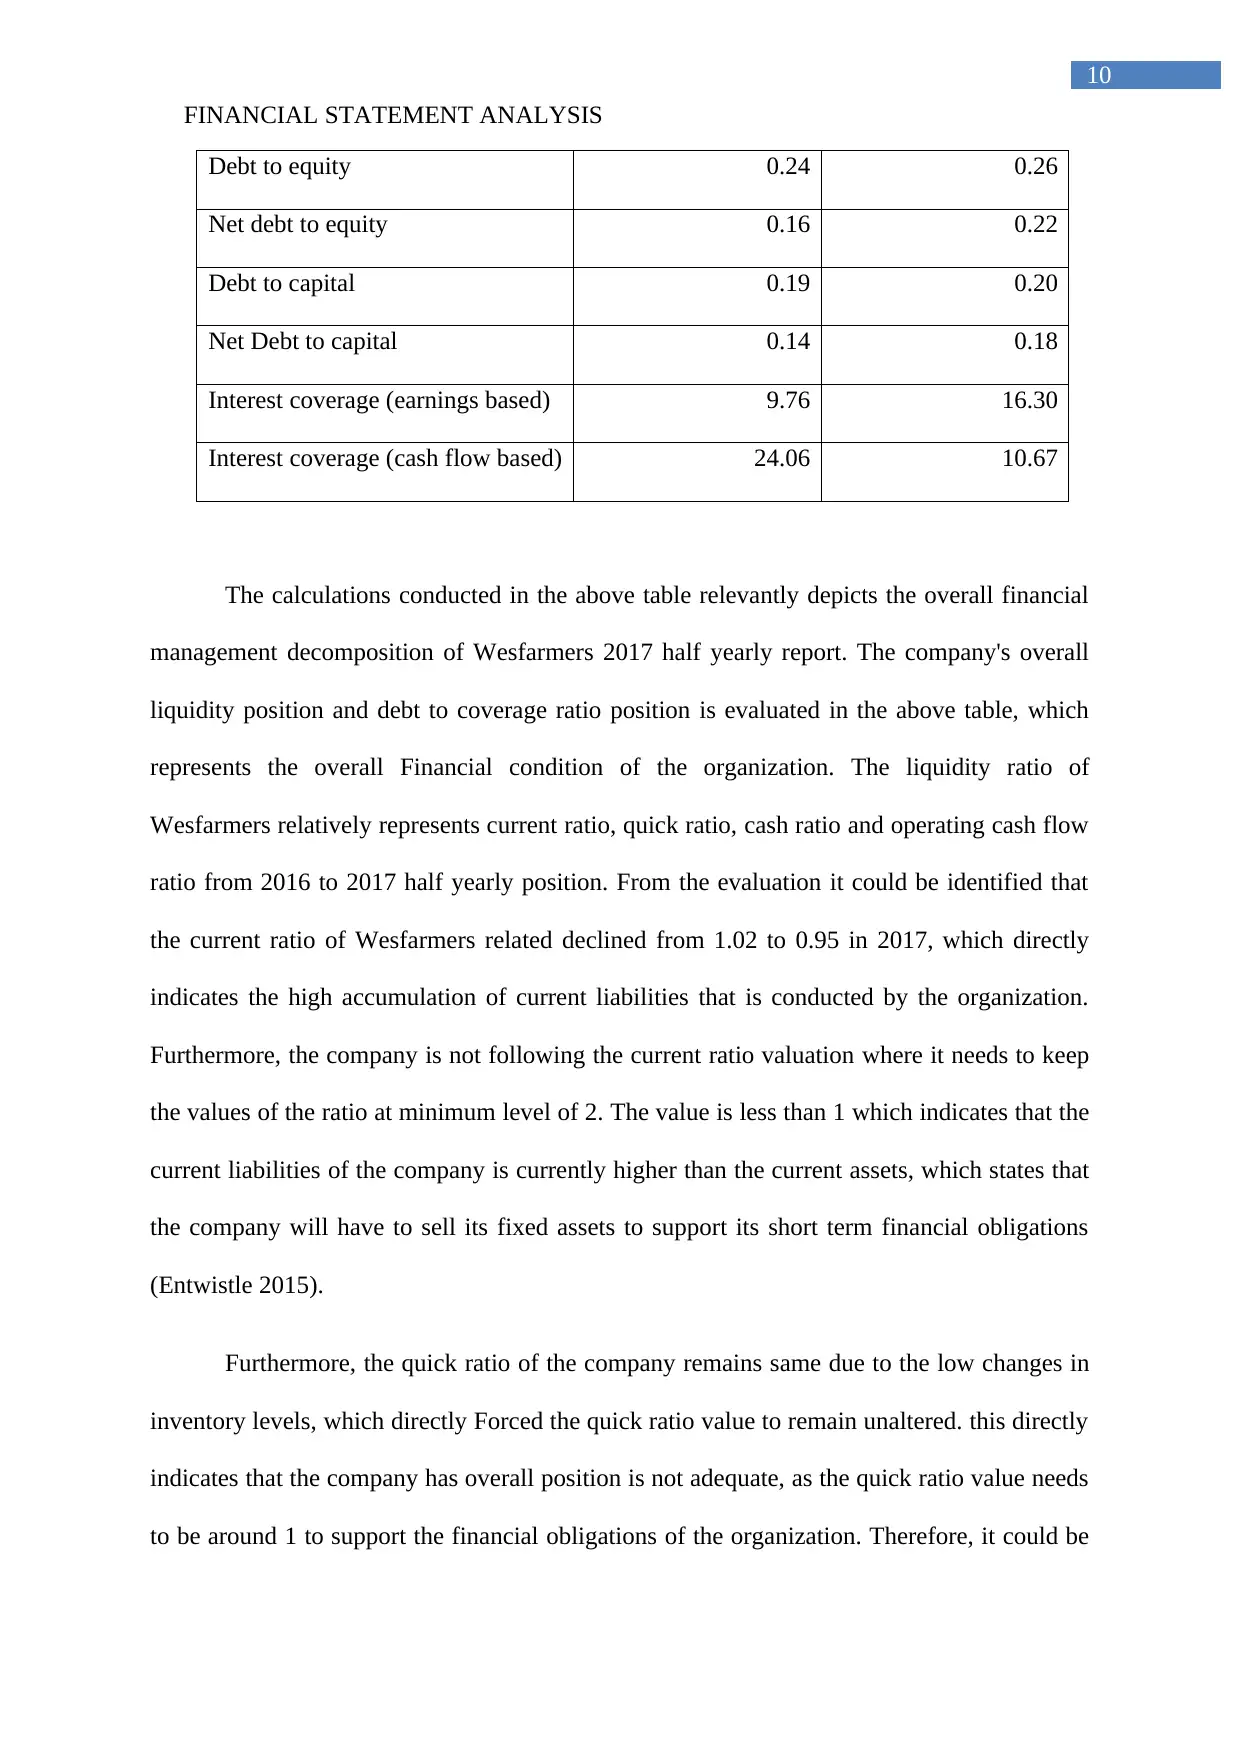
Debt to equity 0.24 0.26
Net debt to equity 0.16 0.22
Debt to capital 0.19 0.20
Net Debt to capital 0.14 0.18
Interest coverage (earnings based) 9.76 16.30
Interest coverage (cash flow based) 24.06 10.67
The calculations conducted in the above table relevantly depicts the overall financial
management decomposition of Wesfarmers 2017 half yearly report. The company's overall
liquidity position and debt to coverage ratio position is evaluated in the above table, which
represents the overall Financial condition of the organization. The liquidity ratio of
Wesfarmers relatively represents current ratio, quick ratio, cash ratio and operating cash flow
ratio from 2016 to 2017 half yearly position. From the evaluation it could be identified that
the current ratio of Wesfarmers related declined from 1.02 to 0.95 in 2017, which directly
indicates the high accumulation of current liabilities that is conducted by the organization.
Furthermore, the company is not following the current ratio valuation where it needs to keep
the values of the ratio at minimum level of 2. The value is less than 1 which indicates that the
current liabilities of the company is currently higher than the current assets, which states that
the company will have to sell its fixed assets to support its short term financial obligations
(Entwistle 2015).
Furthermore, the quick ratio of the company remains same due to the low changes in
inventory levels, which directly Forced the quick ratio value to remain unaltered. this directly
indicates that the company has overall position is not adequate, as the quick ratio value needs
to be around 1 to support the financial obligations of the organization. Therefore, it could be
10
Debt to equity 0.24 0.26
Net debt to equity 0.16 0.22
Debt to capital 0.19 0.20
Net Debt to capital 0.14 0.18
Interest coverage (earnings based) 9.76 16.30
Interest coverage (cash flow based) 24.06 10.67
The calculations conducted in the above table relevantly depicts the overall financial
management decomposition of Wesfarmers 2017 half yearly report. The company's overall
liquidity position and debt to coverage ratio position is evaluated in the above table, which
represents the overall Financial condition of the organization. The liquidity ratio of
Wesfarmers relatively represents current ratio, quick ratio, cash ratio and operating cash flow
ratio from 2016 to 2017 half yearly position. From the evaluation it could be identified that
the current ratio of Wesfarmers related declined from 1.02 to 0.95 in 2017, which directly
indicates the high accumulation of current liabilities that is conducted by the organization.
Furthermore, the company is not following the current ratio valuation where it needs to keep
the values of the ratio at minimum level of 2. The value is less than 1 which indicates that the
current liabilities of the company is currently higher than the current assets, which states that
the company will have to sell its fixed assets to support its short term financial obligations
(Entwistle 2015).
Furthermore, the quick ratio of the company remains same due to the low changes in
inventory levels, which directly Forced the quick ratio value to remain unaltered. this directly
indicates that the company has overall position is not adequate, as the quick ratio value needs
to be around 1 to support the financial obligations of the organization. Therefore, it could be
FINANCIAL STATEMENT ANALYSIS
11
assumed that Wesfarmers current financial position is not adequate to support its short-term
obligations. Moreover, the evaluation of cash ratio indicates an increment in the value from
0.07 in 2016 to 0.16 in 2017, which indicates the relevant Improvement in cash position of
the organization. This is due to the additional credit days that is allowed by the suppliers to
the organization. The operating cash flow position of the company has remained same due to
the stagnant values obtained during 2017 half yearly report. The company's progress has
relatively declined during the period due to the accumulation of high-end current liabilities
and declining profitability (Grant 2016).
From the evaluation of debt and coverage ratio calculated in the above table, the
financial position of Wesfarmers can be identified, which has a relatively deteriorated over
the period half period of 2017. The overall positions of the organization have relatively
declined due to the accumulation of liabilities conducted by the organization during the half
yearly period of 2017. However, the debt position of the company declined during the period
where the reduction in debt to equity ratio is seen from 0.26 to 0.24 in 2017. This relatively
indicates that the company was able to repay some of its debt back to the lender, which
relatively improved its debt to equity ratio. The net debt to equity ratio also improved from
0.22 to 0.16 indicating a positive attribute for the organization and depicting its financial
strength. Supporting values of debt to Capital also indicates a positive attribute of the
organization, as its value declined from 0.20 to 0.19 in 2017. However, the overall interest
coverage ratio based on earnings has a relatively declined due to the low profit that was
generated by the organization during 2017 half yearly position. The company was relatively
not able to generate higher profits from its operations to improve the level of interest
coverage ratio. on the other hand, the interest coverage ratio based on cash flow position has
a relatively improved from 10.67 to 24.06 in 2017. This relatively indicates the positive
cashier position of the organization during the fiscal year. Wesfarmers has been maintaining a
⊘ This is a preview!⊘
Do you want full access?
Subscribe today to unlock all pages.
Trusted by 1+ million students worldwide
1 out of 28
Related Documents


Your All-in-One AI-Powered Toolkit for Academic Success.
+13062052269
info@desklib.com
Available 24*7 on WhatsApp / Email
![[object Object]](/_next/static/media/star-bottom.7253800d.svg)
Unlock your academic potential
Copyright © 2020–2025 A2Z Services. All Rights Reserved. Developed and managed by ZUCOL.