ACC701 - Financial Statement Analysis Case Study: Woolworths Ltd
VerifiedAdded on 2023/06/04
|20
|4444
|175
Case Study
AI Summary
This report presents a financial statement analysis of Woolworths Limited to assess its investment viability. It includes a company background, a detailed ratio analysis covering profitability, asset efficiency, liquidity, solvency, and stock market performance, and a trend analysis of sales and net profit. The ratio analysis examines key metrics such as return on capital employed, gross profit margin, operating profit margin, trade payable turnover days, receivable turnover days, inventory turnover days, current ratio, quick ratio, gearing ratio, interest coverage ratio, and earnings per share. The trend analysis studies the sales and net profit of the business to measure the changes into overall performance in last 3 years. The report aims to provide insights for investors to make informed decisions about investing in Woolworths.
Running Head: Accounting for managers
1
Project Report: Accounting for managers
1
Project Report: Accounting for managers
Paraphrase This Document
Need a fresh take? Get an instant paraphrase of this document with our AI Paraphraser
Accounting for managers
2
Executive summary:
The study on the final financial statement of the business is one of the easiest methods
to evaluate the overall performance of a business. The report focuses on the case study of
Woolworths limited. The report has been conducted to identify the investment position of the
company. In order to evaluate the investment position of the company, the ratio analysis
study has been done and it has been measured that the performance of the company is quite
impressive. The investment into the company is better option for the investors to get higher
return.
Accounting for managers
3
Contents
Introduction.......................................................................................................................4
Company background.......................................................................................................4
Analysis and discussion....................................................................................................4
Trend analysis...............................................................................................................8
Conclusion......................................................................................................................10
Recommendation............................................................................................................10
References.......................................................................................................................12
Appendix.........................................................................................................................13
⊘ This is a preview!⊘
Do you want full access?
Subscribe today to unlock all pages.
Trusted by 1+ million students worldwide
Accounting for managers
4
Introduction:
Evaluation on the final financial statement and the annual report of an organization is
one of the major parts while making the decision about the investment in that particular
company. The final statement and other relevant information in the annual report of the
company makes it easier for the investors and the analyst to collect the information for the
purpose of making the decision about the investment in that company. The strategic direction,
director’s report, operating environment, financial items, stock price, strategically changes etc
are the few figures and information which makes a base for the investors and the analyst.
This information leads to the analyst and the potential investors of the business to reach over
the conclusion (Moyer, McGuigan, Rao and Kretlow, 2011).
In the report, the case study of Woolworths limited has been studied in order to
identify the investment position of the company and identify that whether the investment into
the company would be enough profitable for the investors or not. Various tools and
techniques of analysis have been applied on the annual report and financial statement of the
company to reach over the conclusion.
Company background:
Woolworths group limited is a retailing company which is based in the Australian
market mainly. The company offers various segment to its customers such as Australian food,
liquor, petrol, hotels services, supermarket services etc. the different segment of the company
is operated by the different subsidiaries of the company in order to meet the financial and non
financial objectives of the business such as to improve the turnover, profitability position and
the market base of the company (Reuters, 2018). The total market capital of the business is
36,116 million on the basis of the annual report (2017) of the company. Company has
diversified its market in the New Zealand and Indian market recently.
Analysis and discussion:
The analysis has been done on the annual report and the financial statement of
Woolworths limited to measure the investment position of the company in the market. Firstly,
the study of ratio analysis has been done on the company to identify the various financial
level of the business such as liquidity financial level, profitability financial level, solvency
Paraphrase This Document
Need a fresh take? Get an instant paraphrase of this document with our AI Paraphraser
Accounting for managers
5
financial level, and efficiency financial level and market ratios of the business (Baker and
English, 2011). The analysis on the ratios of the company is as follows:
Profitability ratios:
Profitability ratios are calculated by the analyst and the investors to measure the entire
capabilities of an entity to generate and make profits on the basis of the total equity funds,
available resources, total turnover and many others basis. The profitability ratio analysis
process makes it easier for the analyst and the investors to identify that how much profit
could be generated by the business and how much return could be got by the investors from
the company (Ahrendsen and Katchova, 2012). In case of Woolworths limited, return on
capital employed (ROCE), operating profit margin and gross profit margin of the business
has been calculated to identify the profit making level and capabilities of the business. The
calculations of profitability ratios analysis are as follows:
Return on capital employed:
Return on capital employed is a profitability identifying ratio which is used to
measure the total profit generated against the capital employed of the business (Brigham and
Ehrhardt, 2013). The ROCE of Woolworths limited has been lowered to 30.04% from
35.11% in 2013 which depicts improved and competitive position of the business.
Gross profit margin:
Gross profit margin is a profitability ratio which is used to identify the difference
among the total turnover and the cost of sales of the business. The gross profit margin level of
Woolworths limited has been improved by 28.6% in 2017 from 26.9% in 2013 which depicts
improved and competitive position of the business and a great management of profit level
(Annual report, 2017).
Operating profit margin:
Operating profit margin is a profitability identifying ratio which calculated the total
expenses deduction from the total sales amount of the business. The operating profit margin
of Woolworths limited has been reduced by from 5.48% to 3.83% in 2017 which depicts
lower position of the business.
Accounting for managers
6
The overall profitability analysis of the company explains that the company is trying
to manage the profitability level and it would lead to the better earnings to the investors of the
company.
Asset efficiency ratios:
Asset efficiency ratios are calculated by the analyst and the investors to measure the
efficiency level of an entity in order to manage their daily operations of the business and the
cash conversion cycle of the business through maintain the better cash position in the
business for daily operations and the activities. The efficiency ratio analysis process makes it
easier for the analyst to identify that how much cash is needed for the business to run the
activities (Madura, 2011). In case of Woolworths limited, trade payment turnover days,
receivable turnover days and inventory turnover days of the business has been calculated to
identify the cash conversion cycle and efficiency level of the business. The calculations of
asset efficiency ratios analysis are as follows:
Trade payable payment turnover:
Trade payable turnover days brief the efficiency position of the company in order to
manage the cash position and the credit policies of the business. The payment payable
turnover days of Woolworths limited has been improved to 46.55 days (annual report, 2017).
It explains better efficiency position of the company.
Receivable turnover:
Receivable turnover days brief the efficiency position of the company in order to
manage the total days in which the debtors would pay the credit amount. The receivable
turnover days of Woolworths limited has been changed from 35.77 days to 37.48 in last 5
years (yahoo finance, 2018). It explains that the debtors turnover days have been improved.
Inventory turnover:
Lastly, the inventory turnover days brief the total days in which the inventory of the
company would be ordered and replaced the old inventory of the business. The inventory
turnover days of Woolworths limited is higher and explains that more cash is required for the
business.
The overall efficiency analysis of the company explains that the efficient level of the
business is enough competitive.
⊘ This is a preview!⊘
Do you want full access?
Subscribe today to unlock all pages.
Trusted by 1+ million students worldwide
Accounting for managers
7
Liquidity ratios:
Liquidity ratios are calculated by the analyst and the investors to measure the
capabilities of an entity to manage the enough funds from their daily activities to pay the
current debt of the business. The liquidity ratio analysis process makes it easier for the
analyst and the investors to identify the associated liquidity risk of the business as it measures
that whether the business is able to pay the entire debt at a single time through its current and
quick assets to the debt holders of the business. It calculates the short term solvency position
of the business (Koller, Goedhart and Wessels, 2010). In case of Woolworths limited, current
ratio and acid test ratio of the business has been calculated to identify the solvency position of
the business in short term. The calculations of liquidity ratios analysis are as follows:
Current ratio:
Current ratio is a liquidity ratio which is used to identify that whether the business is
able to replay the current debt against the current funds available to the company (Higgins,
2012). The current ratio of Woolworths limited has been reduced by 0.79 from 0.91 times in
2018. It explains higher liquidity risk of the business.
Quick ratio:
Further, the quick ratio is a liquidity ratio which is used to identify that whether the
business is able to replay the current debt against the quick funds which can be transferred
quickly into cash, available to the company. The quick ratio of Woolworths limited has been
almost similar in last 5 years (Annual report, 2017).
On the basis of the overall evaluation, it has been found that the liquidity risk of the
business has been higher in 2017.
Solvency ratios:
Solvency ratios are calculated by the analyst and the investors to measure the entire
capabilities of an entity to meet the long term obligations of the business on the basis of the
available assets and equity fund of the business. The solvency ratio analysis process makes it
easier for the analyst and the investors to identify the financial risk level through measuring
the debt level, equity level and assets level of the business (Hogarth and Makridakis, 2011).
In case of Woolworths limited, gearing ratio and interest coverage ratio of the business has
Paraphrase This Document
Need a fresh take? Get an instant paraphrase of this document with our AI Paraphraser
Accounting for managers
8
been calculated to identify the long term obligation management capabilities of the business.
The calculations of solvency ratios analysis are as follows:
Gearing ratio:
Gearing ratio is a long term solvency ratio defines the total long term liabilities
against the capital employed (total assets – current liabilities) of the business. The gearing
ratio of Woolworths limited has been reduced from 2013 to 2017 to 64.33%. It explains that
the level of long term liabilities and gearing position has been improved by the business.
Interest coverage ratio:
Further, the interest coverage ratio is a long term solvency ratio defines the EBIT
level against the finance cost of the business to measure that whether the business would be
able to pay the debt cost (Gibson, 2011). The interest coverage ratio of Woolworths limited
has been improved and explains the better position of the company.
It explains that the long term solvency position has been maintained by the company a
great level.
Stock market ratios:
Stock market performance ratios are calculated by the analyst and the investors to
measure the market position of the business on the basis of their earnings, dividend and the
stock price of the business. The stock market ratio analysis process makes it easier for the
analyst and the investors to identify the market position and attractiveness of the company
among the investors (Gibson, 2011). In case of Woolworths limited, earnings per share and
dividend coverage ratio of the business has been calculated to identify the market
attractiveness of the business. The calculations of stock market ratios analysis are as follows:
Earnings per share:
Earnings per share define total earnings which have been generated by the company
for each of the shareholders. The level of EPS has been improved and brief better investment
and marketing level of the business.
Dividend coverage ratio:
Dividend coverage ratio defines total time in which the dividend amount could be
paid the shareholders against the net profit of the business (Annual report, 2017). The level of
Accounting for managers
9
dividend coverage ratio has been improved and brief better investment and marketing level of
the business.
On the basis of the market ratio of the business, it has been found that the position has
been improved by the business to attract more customers towards the business.
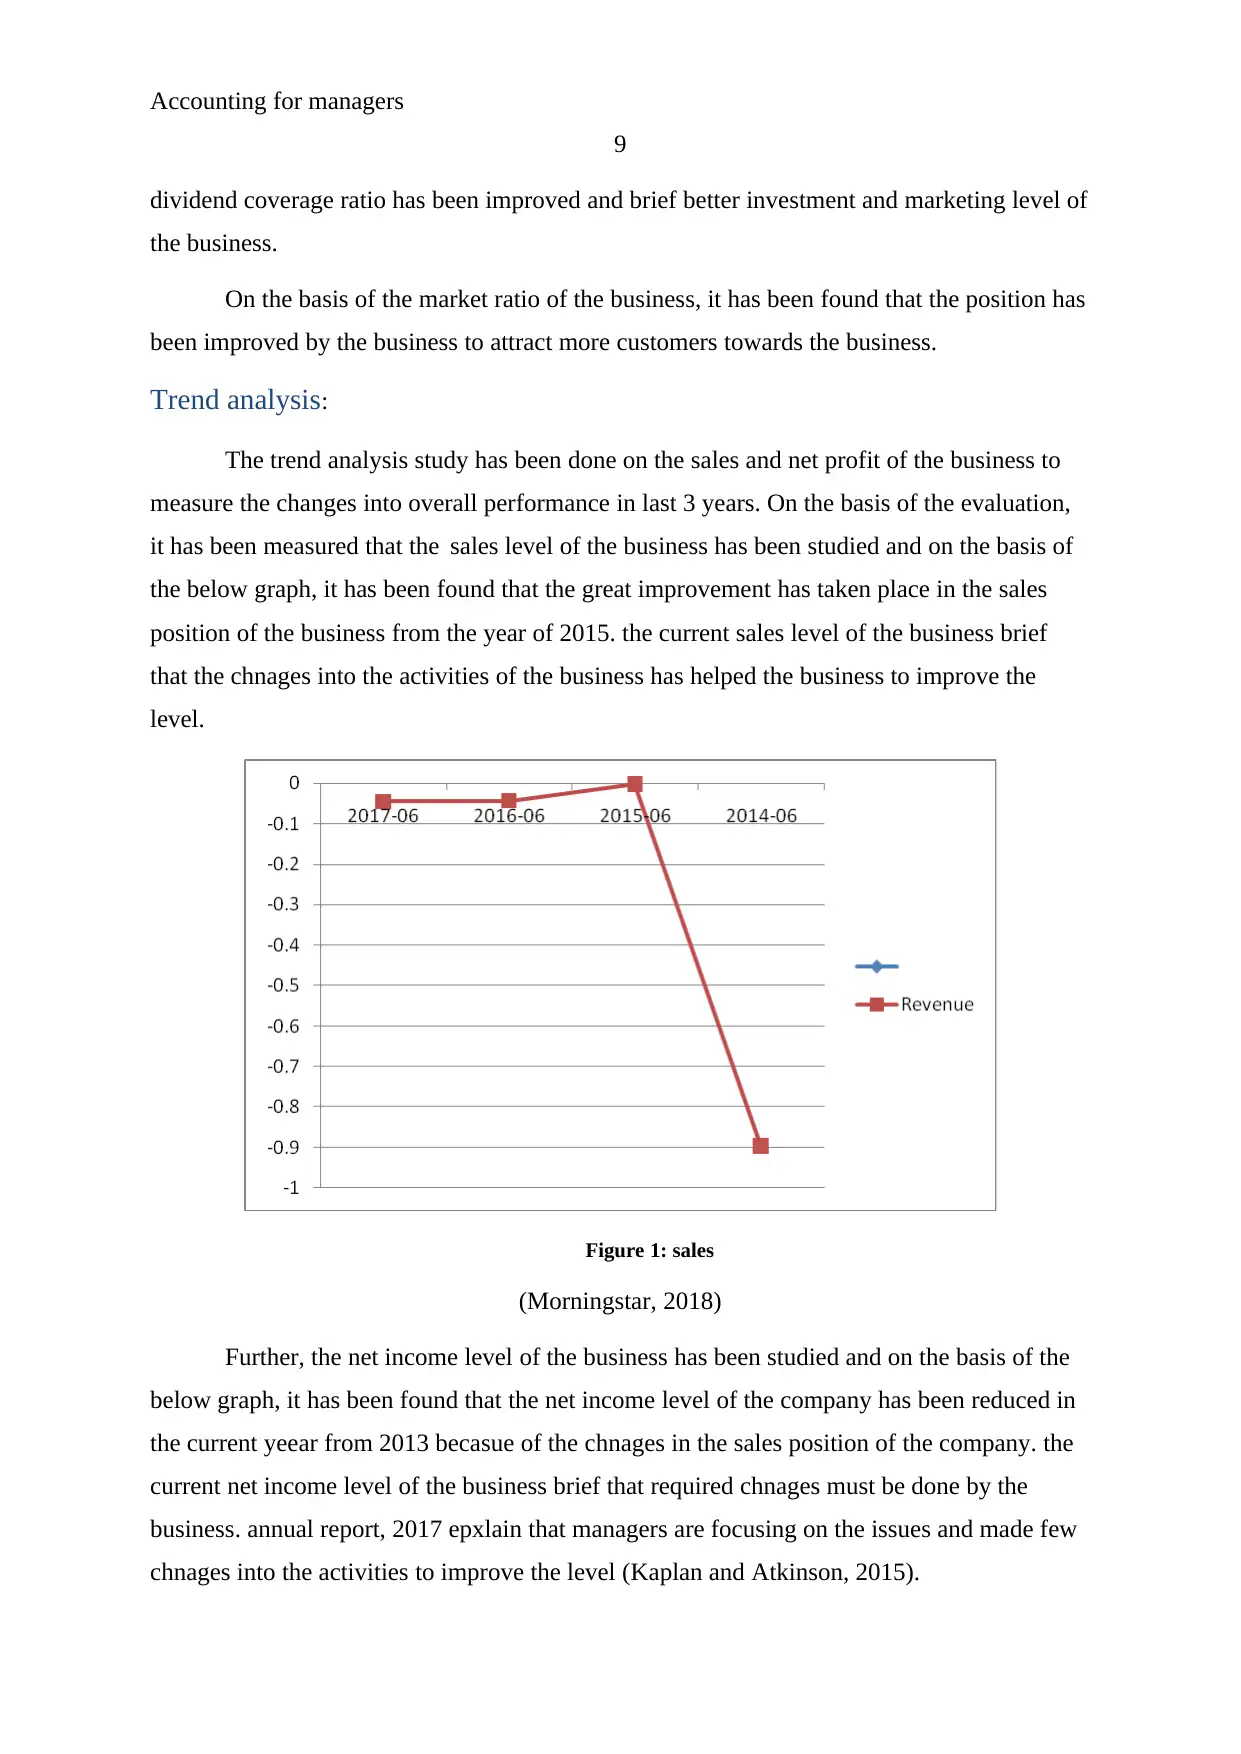
Trend analysis:
The trend analysis study has been done on the sales and net profit of the business to
measure the changes into overall performance in last 3 years. On the basis of the evaluation,
it has been measured that the sales level of the business has been studied and on the basis of
the below graph, it has been found that the great improvement has taken place in the sales
position of the business from the year of 2015. the current sales level of the business brief
that the chnages into the activities of the business has helped the business to improve the
level.
Figure 1: sales
(Morningstar, 2018)
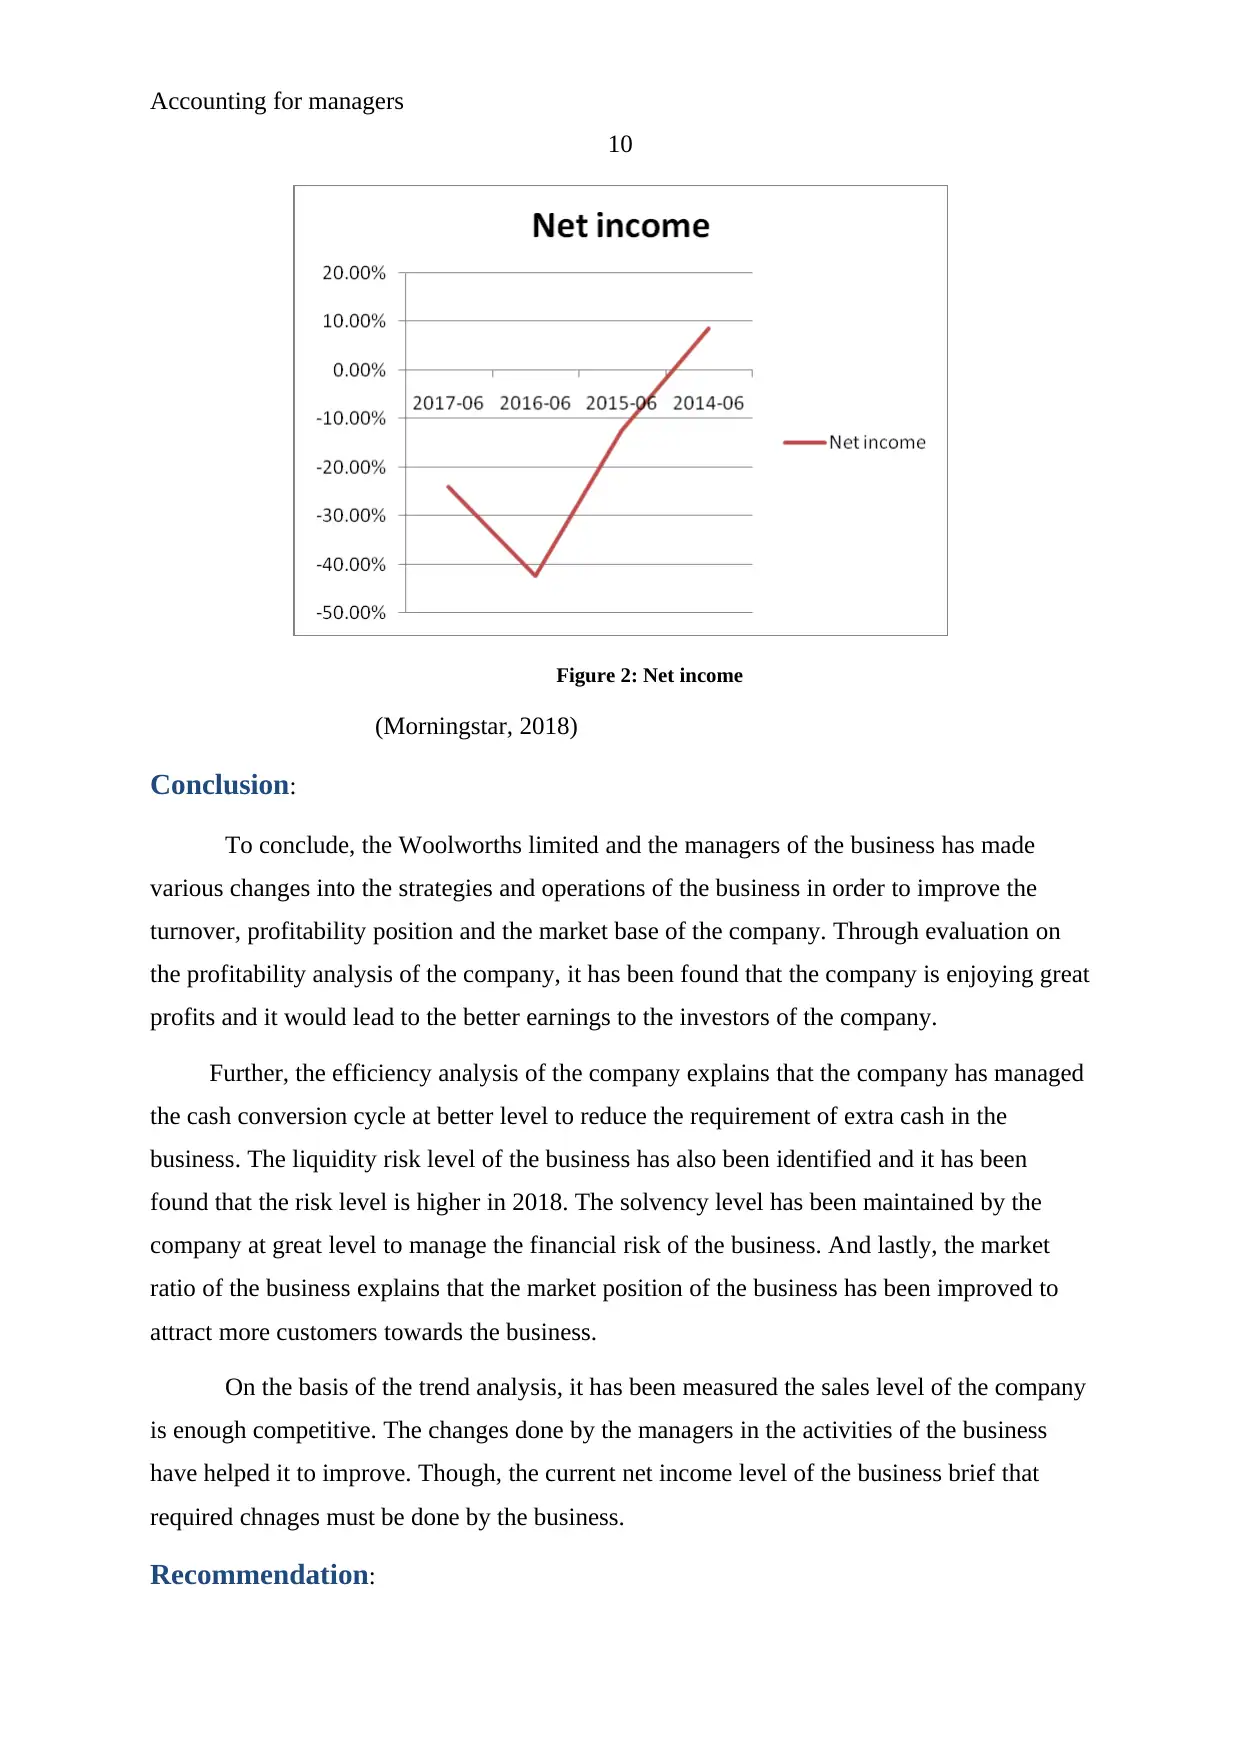
Further, the net income level of the business has been studied and on the basis of the
below graph, it has been found that the net income level of the company has been reduced in
the current yeear from 2013 becasue of the chnages in the sales position of the company. the
current net income level of the business brief that required chnages must be done by the
business. annual report, 2017 epxlain that managers are focusing on the issues and made few
chnages into the activities to improve the level (Kaplan and Atkinson, 2015).
9
dividend coverage ratio has been improved and brief better investment and marketing level of
the business.
On the basis of the market ratio of the business, it has been found that the position has
been improved by the business to attract more customers towards the business.
Trend analysis:
The trend analysis study has been done on the sales and net profit of the business to
measure the changes into overall performance in last 3 years. On the basis of the evaluation,
it has been measured that the sales level of the business has been studied and on the basis of
the below graph, it has been found that the great improvement has taken place in the sales
position of the business from the year of 2015. the current sales level of the business brief
that the chnages into the activities of the business has helped the business to improve the
level.
Figure 1: sales
(Morningstar, 2018)
Further, the net income level of the business has been studied and on the basis of the
below graph, it has been found that the net income level of the company has been reduced in
the current yeear from 2013 becasue of the chnages in the sales position of the company. the
current net income level of the business brief that required chnages must be done by the
business. annual report, 2017 epxlain that managers are focusing on the issues and made few
chnages into the activities to improve the level (Kaplan and Atkinson, 2015).
⊘ This is a preview!⊘
Do you want full access?
Subscribe today to unlock all pages.
Trusted by 1+ million students worldwide
Accounting for managers
10
Figure 2: Net income
(Morningstar, 2018)
Conclusion:
To conclude, the Woolworths limited and the managers of the business has made
various changes into the strategies and operations of the business in order to improve the
turnover, profitability position and the market base of the company. Through evaluation on
the profitability analysis of the company, it has been found that the company is enjoying great
profits and it would lead to the better earnings to the investors of the company.
Further, the efficiency analysis of the company explains that the company has managed
the cash conversion cycle at better level to reduce the requirement of extra cash in the
business. The liquidity risk level of the business has also been identified and it has been
found that the risk level is higher in 2018. The solvency level has been maintained by the
company at great level to manage the financial risk of the business. And lastly, the market
ratio of the business explains that the market position of the business has been improved to
attract more customers towards the business.
On the basis of the trend analysis, it has been measured the sales level of the company
is enough competitive. The changes done by the managers in the activities of the business
have helped it to improve. Though, the current net income level of the business brief that
required chnages must be done by the business.
Recommendation:
Paraphrase This Document
Need a fresh take? Get an instant paraphrase of this document with our AI Paraphraser
Accounting for managers
11
Through conducting the study on the financial ratios of the business, it has been found
that the company is required to focus on its operating expenses which have impacted on the
profitability ratio a lot. The director’s message has also depicted that few required changes
would be done by the business. The liquidity position must also be improved by the business
in order to manage the liquidity risk of the business. Further, the business is also
recommended to evaluate the turnover days and efficiency position to manage and lower the
cash conversion cycle of the business. The annual report (2017) of Woolworths limited has
described that the company has maintained proper strategies to manage the liquidity risk of
the business.
The proper strategies have been described by the business in the financial risk
management heading to describe the shareholders and other stakeholders of the business. So
that the attractiveness level of the business could be improved and it could offer a better base
to the investors of the company. annual report, 2017 epxlains that managers are focusing on
the issues and made few chnages into the activities to improve the net income level. On the
basis of the overall evaluation, it has been found that the investment into the stock of
Woolworths limited is better option for the business.
Accounting for managers
12
References:
Ahrendsen, B. L., & Katchova, A. L. 2012. Financial ratio analysis using ARMS
data. Agricultural Finance Review, 72(2), p.p. 262-272.
Annual report, 2017. Woolworths Limited. (Online). Available at:
https://www.woolworthsgroup.com.au/icms_docs/195396_annual-report-2017.pdf (accessed
20/09/2018).
Baker, H. K., & English, P. 2011. Capital budgeting valuation: Financial analysis for today's
investment projects (Vol. 13). John Wiley & Sons.
Brigham, E.F. and Ehrhardt, M.C., 2013. Financial management: Theory & practice.
Cengage Learning.
Gibson, C.H., 2011. Financial reporting and analysis. South-Western Cengage Learning.
Higgins, R.C., 2012. Analysis for financial management. McGraw-Hill/Irwin.
Hogarth, R.M. and Makridakis, S., 2011. Forecasting and planning: An
evaluation. Management science, 27(2), pp.115-138.
Kaplan, R.S. and Atkinson, A.A., 2015. Advanced management accounting. PHI Learning.
Koller, T., Goedhart, M. and Wessels, D., 2010. Valuation: measuring and managing the
value of companies (Vol. 499). john Wiley and sons.
Madura, J., 2011. International financial management. Cengage Learning.
Morningstar. 2018. Woolworths Limited. (Online). Available at:
http://financials.morningstar.com/cash-flow/cf.html?t=WOW®ion=aus&culture=en-US
(accessed 20/09/2018).
Moyer, R. C., McGuigan, J., Rao, R., & Kretlow, W. 2011. Contemporary financial
management. Nelson Education.
Reuters. 2018. Woolworths Limited. (Online). Available at:,
https://www.reuters.com/finance/stocks/company-profile/WOW.AX (accessed 20/09/2018).
Yahoo Finance, 2018. Woolworths Limited. (Online). Available at:
https://au.finance.yahoo.com/quote/WOW.AX/ (accessed 20/09/2018).
⊘ This is a preview!⊘
Do you want full access?
Subscribe today to unlock all pages.
Trusted by 1+ million students worldwide
1 out of 20
Related Documents


Your All-in-One AI-Powered Toolkit for Academic Success.
+13062052269
info@desklib.com
Available 24*7 on WhatsApp / Email
![[object Object]](/_next/static/media/star-bottom.7253800d.svg)
Unlock your academic potential
Copyright © 2020–2026 A2Z Services. All Rights Reserved. Developed and managed by ZUCOL.