Analysis of Financial Statements Using Xero Software Project
VerifiedAdded on 2023/03/20
|9
|1307
|71
Project
AI Summary
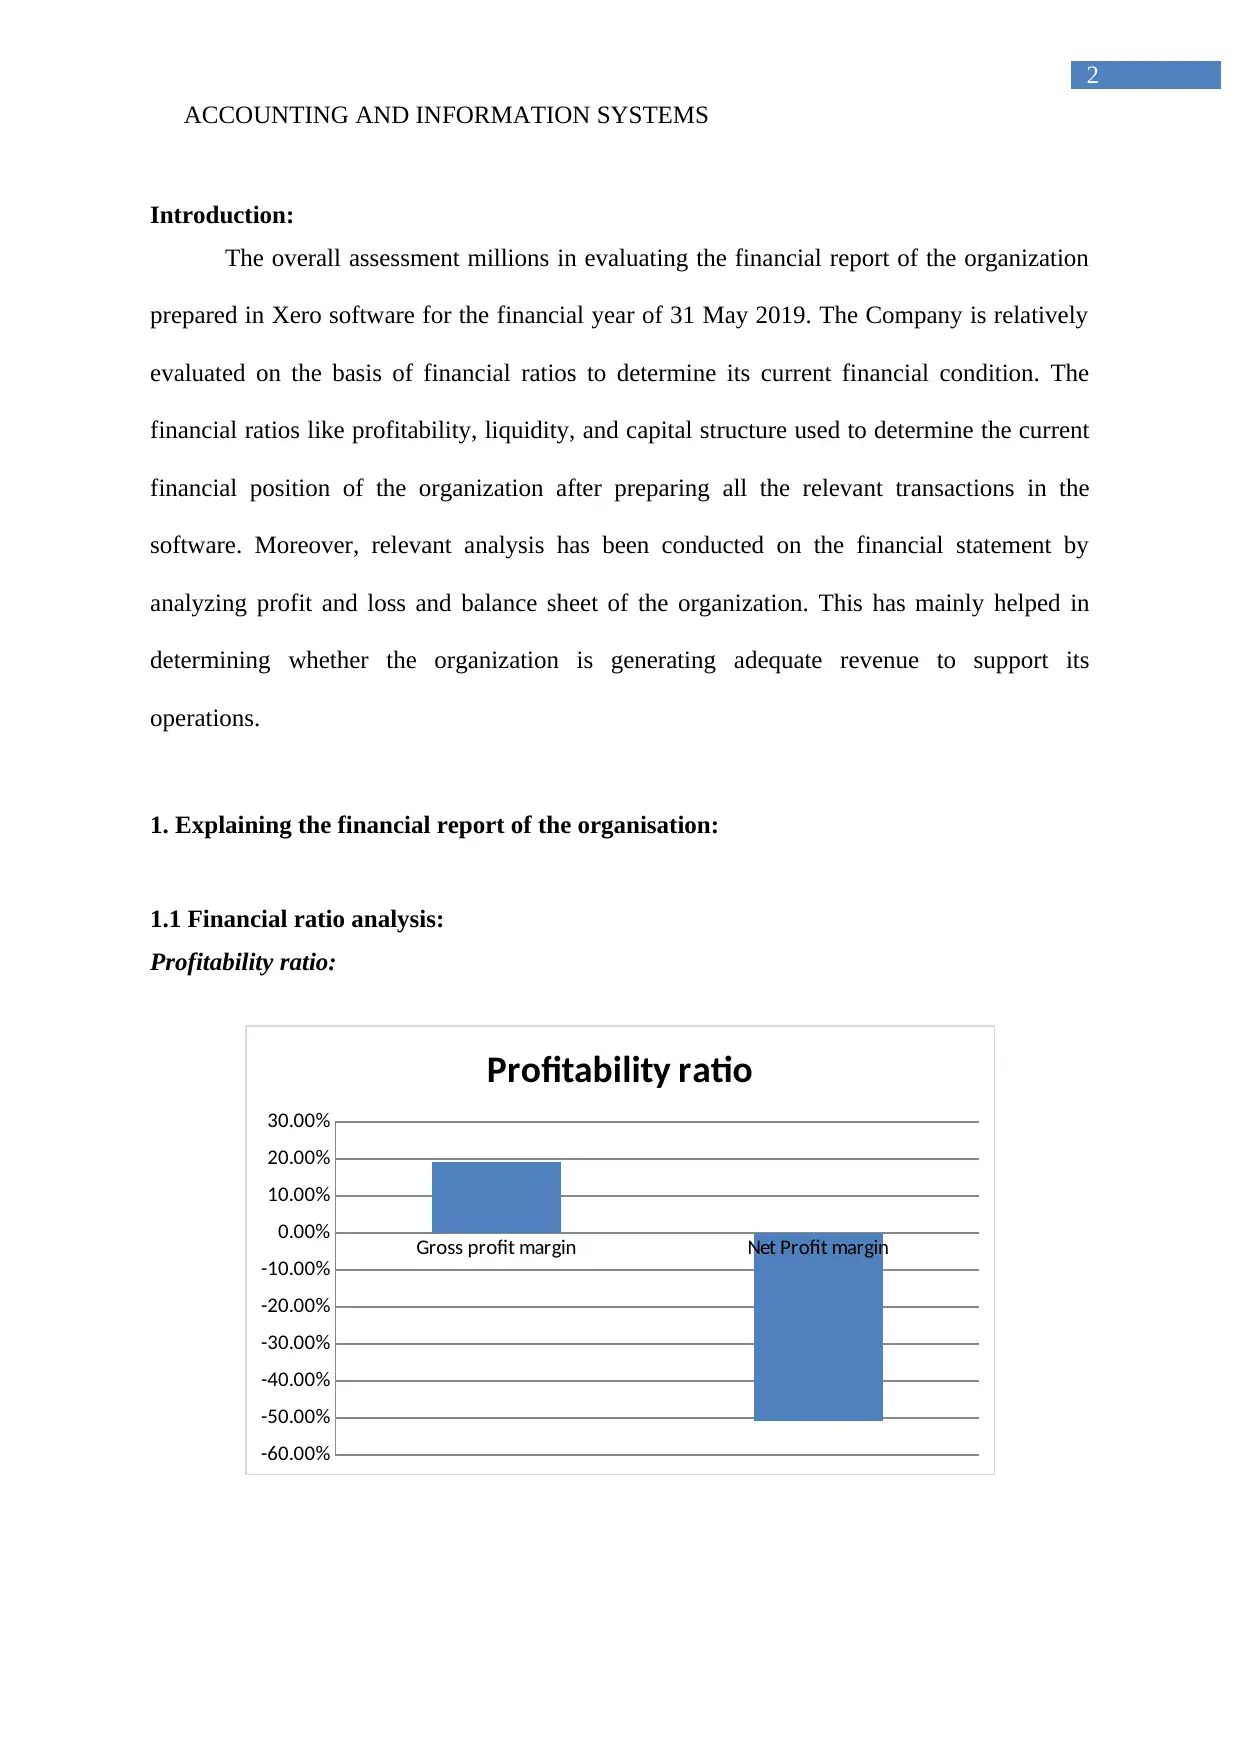
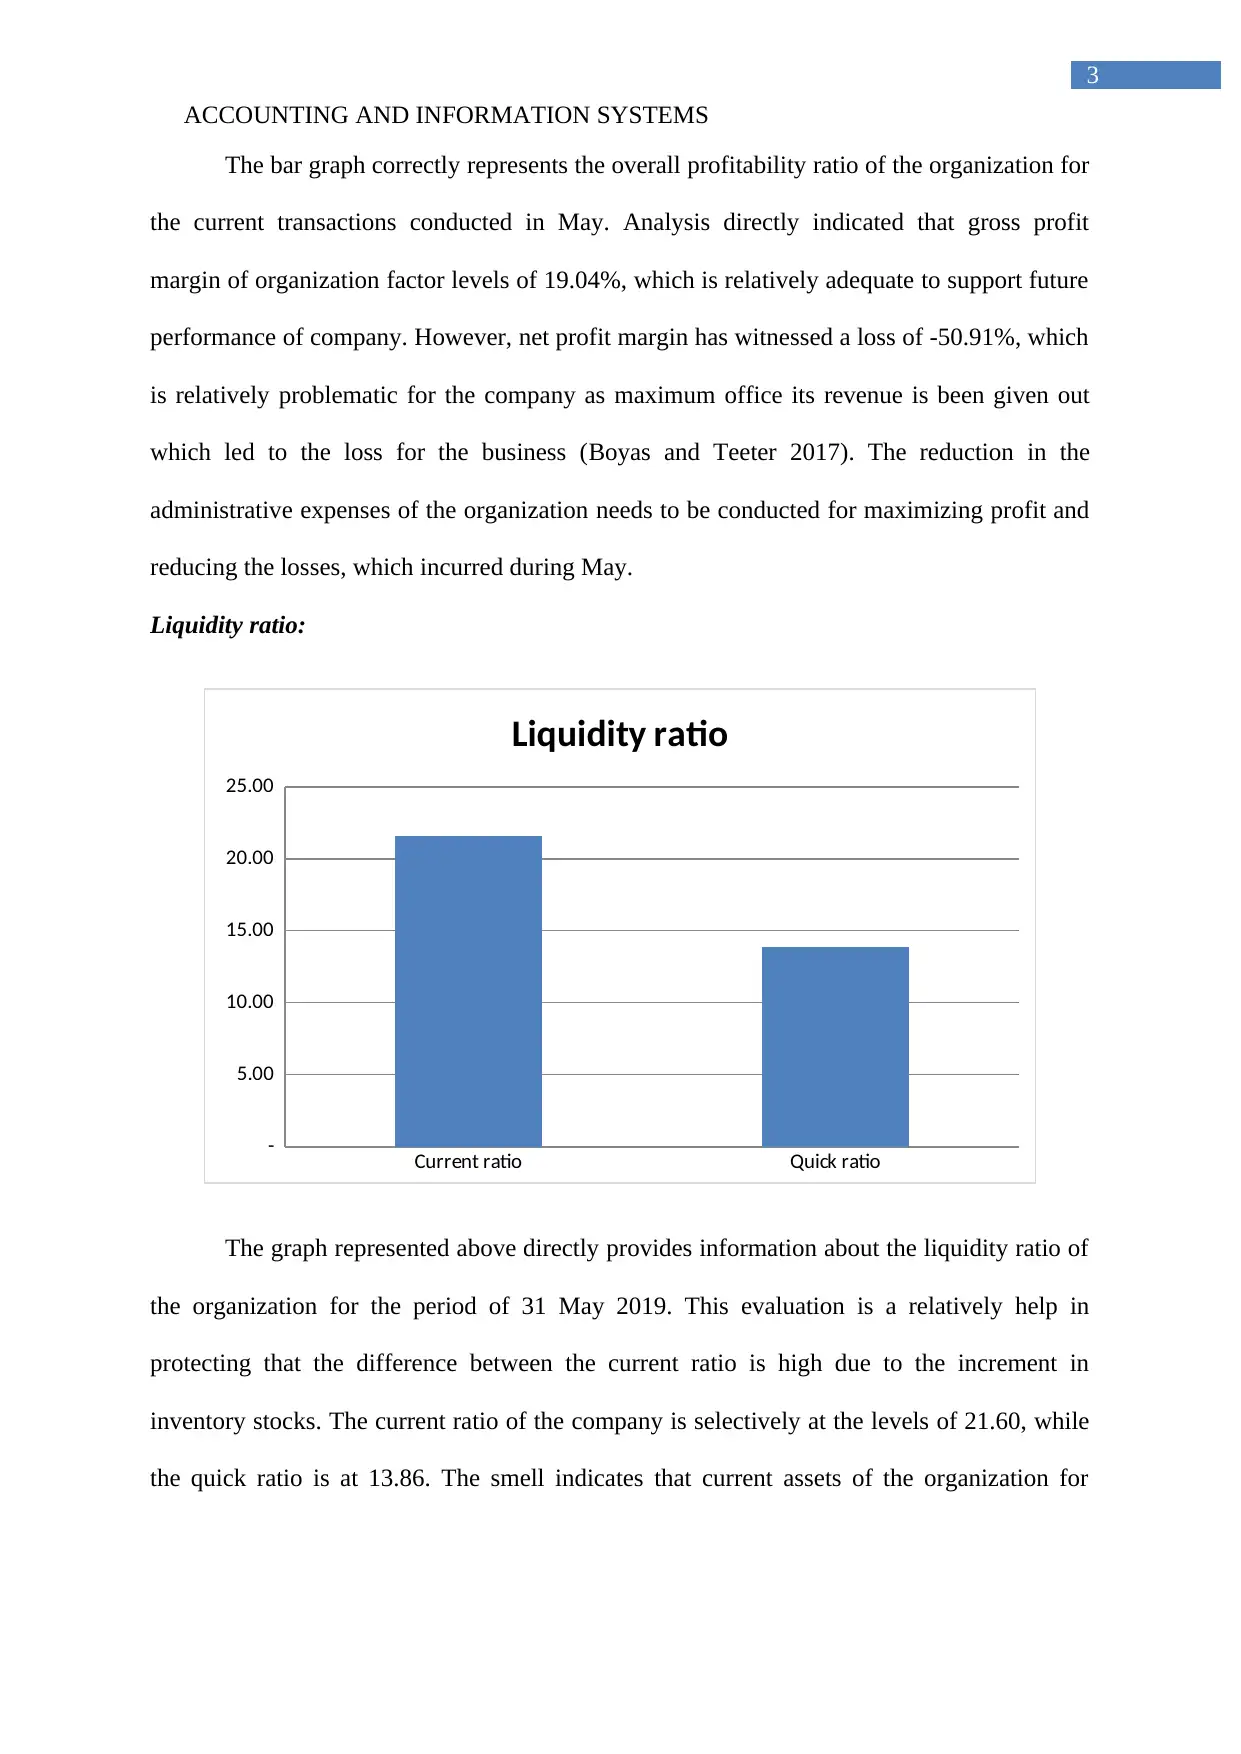
This assignment details a student's comprehensive financial analysis project using Xero software. The project begins with establishing a new business within Xero, followed by recording various financial transactions for the month of May 2019, including capital contributions, purchases, and sales. The core of the assignment involves a thorough evaluation of the company's financial performance, incorporating financial ratio analysis (profitability, liquidity, and capital structure) to assess the organization's financial health. The student then analyzes the income statement and balance sheet, providing insights into the company's revenue generation, expenses, assets, and liabilities. The analysis highlights key findings, such as the gross profit margin, net profit margin, and the impact of operating expenses. The report concludes with an overview of the company's financial condition and offers recommendations based on the conducted analysis. References to relevant literature are also included.

Running head: ACCOUNTING AND INFORMATION SYSTEMS
Accounting and Information Systems
Name of the Student:
Name of the University:
Authors Note:
Accounting and Information Systems
Name of the Student:
Name of the University:
Authors Note:
Paraphrase This Document
Need a fresh take? Get an instant paraphrase of this document with our AI Paraphraser

ACCOUNTING AND INFORMATION SYSTEMS
1
Table of Contents
Introduction:...............................................................................................................................2
1. Explaining the financial report of the organisation:...............................................................2
1.1 Financial ratio analysis:........................................................................................................2
1.2 Financial Statement Analysis:..............................................................................................4
Conclusion:................................................................................................................................6
Reference and Bibliography:......................................................................................................7

ACCOUNTING AND INFORMATION SYSTEMS
2
Introduction:
The overall assessment millions in evaluating the financial report of the organization
prepared in Xero software for the financial year of 31 May 2019. The Company is relatively
evaluated on the basis of financial ratios to determine its current financial condition. The
financial ratios like profitability, liquidity, and capital structure used to determine the current
financial position of the organization after preparing all the relevant transactions in the
software. Moreover, relevant analysis has been conducted on the financial statement by
analyzing profit and loss and balance sheet of the organization. This has mainly helped in
determining whether the organization is generating adequate revenue to support its
operations.
1. Explaining the financial report of the organisation:
1.1 Financial ratio analysis:
Profitability ratio:
Gross profit margin Net Profit margin
-60.00%
-50.00%
-40.00%
-30.00%
-20.00%
-10.00%
0.00%
10.00%
20.00%
30.00%
Profitability ratio
⊘ This is a preview!⊘
Do you want full access?
Subscribe today to unlock all pages.

Trusted by 1+ million students worldwide

ACCOUNTING AND INFORMATION SYSTEMS
3
The bar graph correctly represents the overall profitability ratio of the organization for
the current transactions conducted in May. Analysis directly indicated that gross profit
margin of organization factor levels of 19.04%, which is relatively adequate to support future
performance of company. However, net profit margin has witnessed a loss of -50.91%, which
is relatively problematic for the company as maximum office its revenue is been given out
which led to the loss for the business (Boyas and Teeter 2017). The reduction in the
administrative expenses of the organization needs to be conducted for maximizing profit and
reducing the losses, which incurred during May.
Liquidity ratio:
Current ratio Quick ratio
-
5.00
10.00
15.00
20.00
25.00
Liquidity ratio
The graph represented above directly provides information about the liquidity ratio of
the organization for the period of 31 May 2019. This evaluation is a relatively help in
protecting that the difference between the current ratio is high due to the increment in
inventory stocks. The current ratio of the company is selectively at the levels of 21.60, while
the quick ratio is at 13.86. The smell indicates that current assets of the organization for
Paraphrase This Document
Need a fresh take? Get an instant paraphrase of this document with our AI Paraphraser

ACCOUNTING AND INFORMATION SYSTEMS
4
greater than its current liabilities and can support its short-term obligations without any
hindrance.
Capital Structure ratio:
Debt ratio Debt to equity ratio
-
0.10
0.20
0.30
0.40
0.50
0.60
0.70
Capital Structure ratio
Capital structure ratio of the organization is calculated in the above graph where both
debt ratio and the debt to equity ratio provide adequate information regarding the current debt
exposure of the company. The company has a relatively adaptor ratio 0.36, which indicates
that equity capital of the company is relatively higher in comparison to debt. In the similar
instance debt to equity ratio as indicated of value of 0.61, this is relatively favorable for
organizations as it minimizes the occurrence of insolvency in future (Rodrigues and
Rodrigues 2018).
1.2 Financial Statement Analysis:
Income Statement:
Profit and Loss
19585150 Pin-Heng Lin

ACCOUNTING AND INFORMATION SYSTEMS
5
For the month ended 31 May 2019
Account May 2019
Trading Income
Interest Income 625.00
Sales 29,794.40
Total Trading Income 30,419.40
Cost of Sales
Cost of Goods Sold 24,628.00
Total Cost of Sales 24,628.00
Gross Profit 5,791.40
Operating Expenses
Advertising 1,000.00
Depreciation 758.34
Freight & Courier 200.00
Insurance 200.00
Interest Expense 1,750.00
miscellaneous office supplies 280.00
Rent 9,090.91
Wages and Salaries 8,000.00
Total Operating Expenses 21,279.25
Net Profit (15,487.85)
The table provides information about the profit and loss statement of the organization
for the financial year of 31st May 2019. The analysis directly indicate that the total sales, cost
of goods sold, and gross profit of the organization is adequate How were the major problem
occurred with the operating expenses of the organization where rent and wages was relatively
high during the financial month. This is the main reason behind the loss that occurred by your
organization during the month of May.
Balance Sheet:
Balance Sheet
19585150 Pin-Heng Lin
As at 31 May 2019
Account 31 May 2019
Assets
⊘ This is a preview!⊘
Do you want full access?
Subscribe today to unlock all pages.

Trusted by 1+ million students worldwide

ACCOUNTING AND INFORMATION SYSTEMS
6
Current Assets
Accounts Receivable 847.00
Cash at Bank 1,20,460.01
Doubtful debts (84.70)
Inventory 2,65,344.73
Investment account 2,50,625.00
Office supplies 220.00
Prepaid rent 99,090.91
Prepayments 3,927.27
Total Current Assets 7,40,430.22
Fixed Assets
Delivery van 23,181.82
Depreciation on delivery van (341.67)
Depreciation on office fittings (416.67)
office fittings 50,000.00
Total Fixed Assets 72,423.48
Total Assets 8,12,853.70
Liabilities
Current Liabilities
Accounts Payable 71,830.00
GST (45,548.45)
Wages Payable - Payroll 8,000.00
Total Current Liabilities 34,281.55
Non-current Liabilities
Loan 2,94,060.00
Total Non-current
Liabilities 2,94,060.00
Total Liabilities 3,28,341.55
Net Assets 4,84,512.15
Equity
Current Year Earnings (15,487.85)
Owner A Share Capital 5,00,000.00
Total Equity 4,84,512.15
The above table provides information about the balance sheet of the organization,
which is relatively appropriate for the month of May. The company has adequately conducted
its operations during the month, which has increased total assets to the levels of 812,853.70,
while the total liabilities of the company are at 328,341.55. This mail indicates that the
overall net assets of the organization are higher. However, the loss incurred during the current
month lead to the reduction in the overall owners share capital (Zainudin and Hashim 2016).
Paraphrase This Document
Need a fresh take? Get an instant paraphrase of this document with our AI Paraphraser

ACCOUNTING AND INFORMATION SYSTEMS
7
Conclusion:
The overall report provides information about the financial condition of the company
that has been created in payroll software. From the relevant valuation it could be identified
that current financial position of the companies adequate, while its profit making capability is
relatively low, which is portrayed by a loss conducted by the organization during the month.
Reference and Bibliography:
Altman, E.I., Iwanicz‐Drozdowska, M., Laitinen, E.K. and Suvas, A., 2017. Financial distress
prediction in an international context: A review and empirical analysis of Altman's Z‐score
model. Journal of International Financial Management & Accounting, 28(2), pp.131-171.
Boyas, E. and Teeter, R., 2017. Teaching Financial Ratio Analysis using XBRL.
In Developments in Business Simulation and Experiential Learning: Proceedings of the
Annual ABSEL conference (Vol. 44, No. 1).
Rakićević, A., Milošević, P., Petrović, B. and Radojević, D.G., 2016. DuPont financial ratio
analysis using logical aggregation. In Soft Computing Applications (pp. 727-739). Springer,
Cham.
Robinson, T.R., Henry, E., Pirie, W.L. and Broihahn, M.A., 2015. International financial
statement analysis. John Wiley & Sons.
Rodrigues, L. and Rodrigues, L., 2018. Economic-financial performance of the Brazilian
sugarcane energy industry: An empirical evaluation using financial ratio, cluster and
discriminant analysis. Biomass and bioenergy, 108, pp.289-296.

ACCOUNTING AND INFORMATION SYSTEMS
8
Zainudin, E.F. and Hashim, H.A., 2016. Detecting fraudulent financial reporting using
financial ratio. Journal of Financial Reporting and Accounting, 14(2), pp.266-278.
8
Zainudin, E.F. and Hashim, H.A., 2016. Detecting fraudulent financial reporting using
financial ratio. Journal of Financial Reporting and Accounting, 14(2), pp.266-278.
⊘ This is a preview!⊘
Do you want full access?
Subscribe today to unlock all pages.

Trusted by 1+ million students worldwide
1 out of 9
Related Documents

Your All-in-One AI-Powered Toolkit for Academic Success.
+13062052269
info@desklib.com
Available 24*7 on WhatsApp / Email
Unlock your academic potential
Copyright © 2020–2025 A2Z Services. All Rights Reserved. Developed and managed by ZUCOL.