Introduction to Accounting and Finance Assessment Report Analysis
VerifiedAdded on 2021/02/19
|17
|4544
|22
Report
AI Summary
This comprehensive report delves into key aspects of accounting and finance, beginning with an introduction that highlights the interrelation between accounting and financial management. The report then presents financial statements for Yarnshaw Limited, including the statement of income and financial position. Part B focuses on Reckturk Plc, performing a break-even analysis, calculating the margin of safety, and computing profit based on varying production and sales volumes, and also presents a new marketing proposal. Finally, Part C evaluates investment appraisal techniques for Roseville Plc, including payback period, net present value, and accounting rate of return, and discusses the benefits and limitations of budgeting as a strategic planning tool. The report provides detailed calculations and analyses throughout, offering insights into financial statement preparation, break-even analysis, and investment appraisal.
Introduction
to Accounting and
Finance Assessment
to Accounting and
Finance Assessment
Paraphrase This Document
Need a fresh take? Get an instant paraphrase of this document with our AI Paraphraser
Table of Contents
INTRODUCTION...........................................................................................................................3
TASK...............................................................................................................................................3
Part A – Yarnshaw Limited:.......................................................................................................3
Statement of Income of Yarnshaw Limited:...............................................................................3
Statement of Financial Position of Yarnshaw Limited:..............................................................4
Part B – Reckturk Plc:.................................................................................................................6
A. Calculation of contribution per wardrobe makes towards covering fixed costs if selling
price is £40:.................................................................................................................................6
B. Computation of break-even point and margin of safety in terms of both units of wardrobe
and revenue if selling price is £40:.............................................................................................7
C. Computation of the profit of company if production and selling units are 54,000 wardrobe
and selling price is £40 per wardrobe:........................................................................................8
D..................................................................................................................................................8
E. Break-even Model:.................................................................................................................9
Part C – Roseville Plc:..............................................................................................................10
A. Calculation of Payback Period, Net Present Value and Accounting Rate of Return of the
machine and recommendation:.................................................................................................10
B. Explanation and analyses of differing investment appraisal technique's major merits and
limitations:.................................................................................................................................12
C. Key benefits and limitations of using budgets as a tool for strategic planning:...................14
CONCLUSION..............................................................................................................................16
REFERENCES..............................................................................................................................17
INTRODUCTION
Finance and Accounting are two different aspects but closely interlinked. Accounting
covers initial recording of fiscal events and transactions whereas finance covers management of
organisation's fiscal resources. Accounting process begin with entering fiscal data, summarising
such data and generation of information which exhibits organisation's actual financial position.
Finance relates to field which is directly related with investing and assigning financial resources
for a specific time frame with aim to get monetary return while considering any risk conditions
and uncertainty associated (Rainer and et.al., 2013). It can be simply defined as art concerned
with effective money management. This study covers preparation of financial statements i.e.
revenue statement and statement of financial position, break-even analysis and margin of safety.
Study report also includes practical aspects of net present value, accounting rate of return,
payback period and other variables help in determining viability of any project or investment.
TASK
Part A – Yarnshaw Limited:
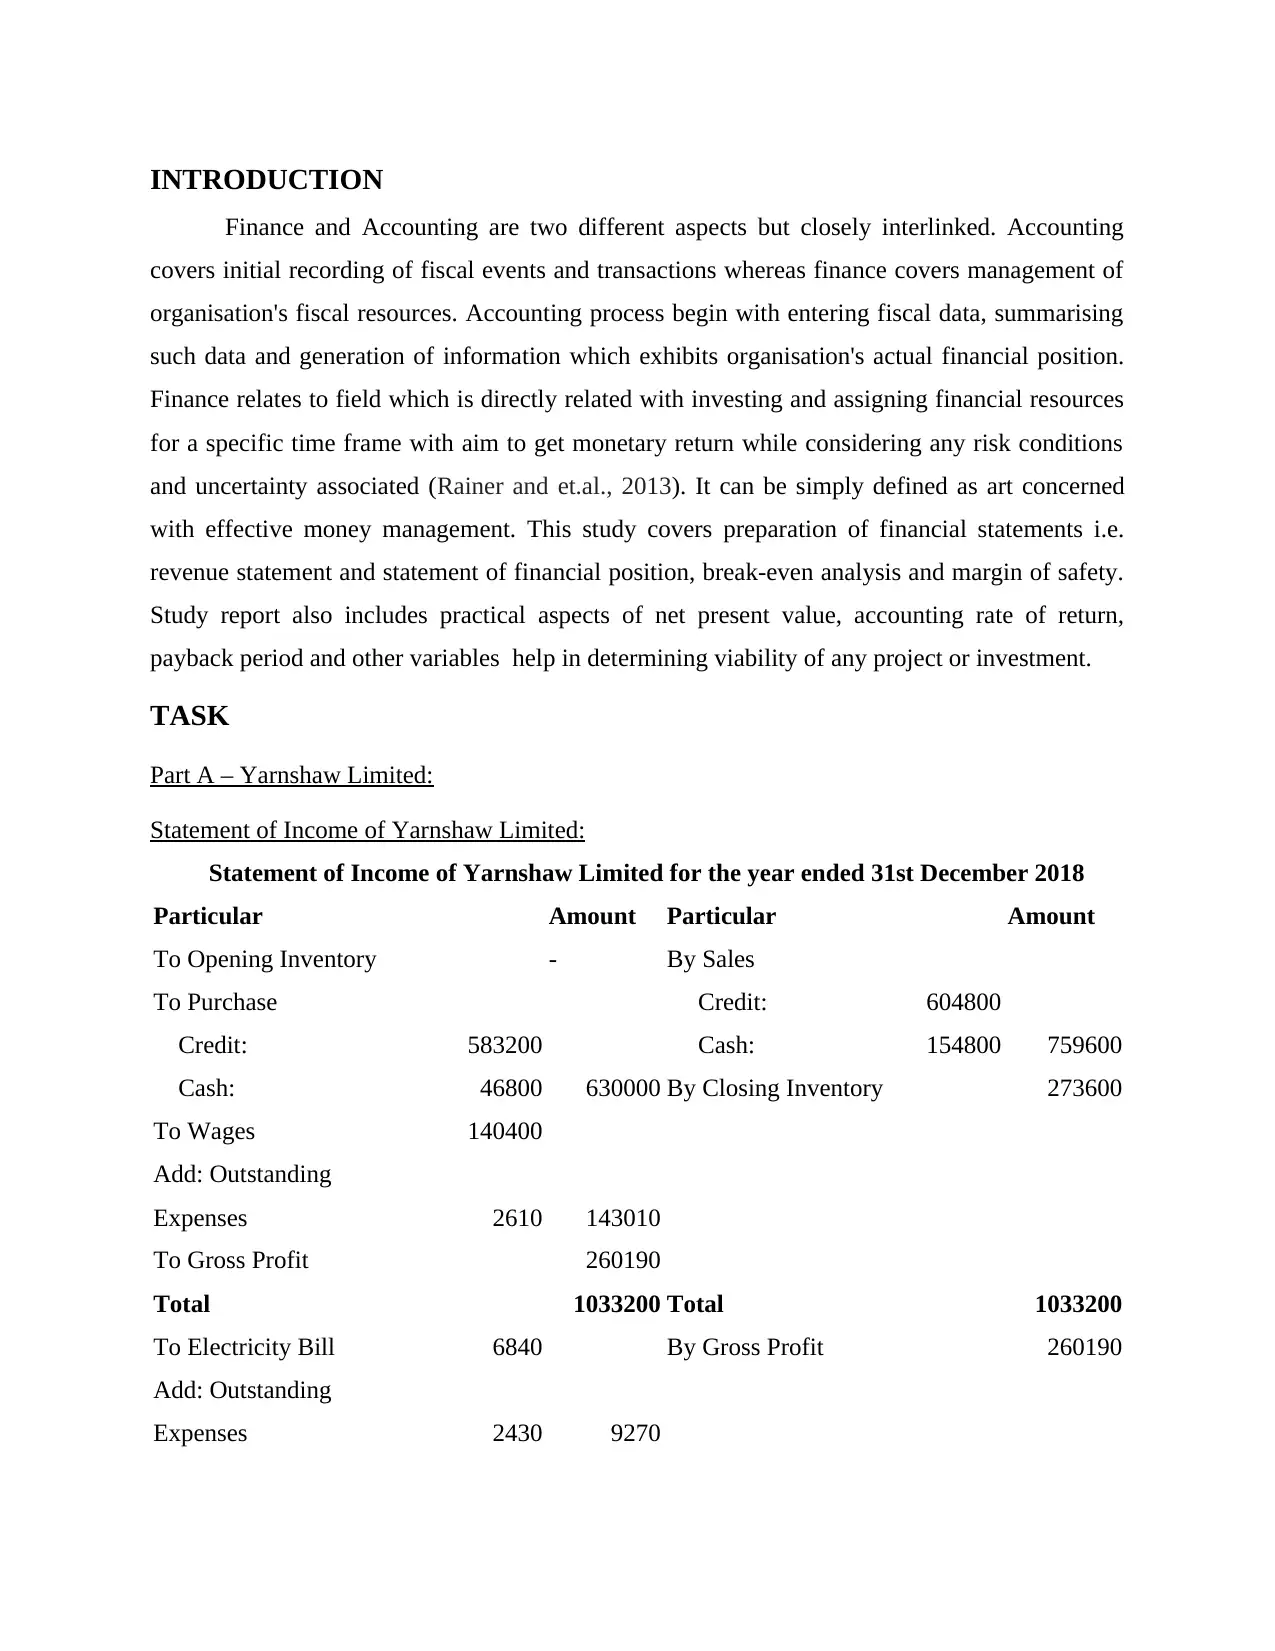
Statement of Income of Yarnshaw Limited:
Statement of Income of Yarnshaw Limited for the year ended 31st December 2018
Particular Amount Particular Amount
To Opening Inventory - By Sales
To Purchase Credit: 604800
Credit: 583200 Cash: 154800 759600
Cash: 46800 630000 By Closing Inventory 273600
To Wages 140400
Add: Outstanding
Expenses 2610 143010
To Gross Profit 260190
Total 1033200 Total 1033200
To Electricity Bill 6840 By Gross Profit 260190
Add: Outstanding
Expenses 2430 9270
Finance and Accounting are two different aspects but closely interlinked. Accounting
covers initial recording of fiscal events and transactions whereas finance covers management of
organisation's fiscal resources. Accounting process begin with entering fiscal data, summarising
such data and generation of information which exhibits organisation's actual financial position.
Finance relates to field which is directly related with investing and assigning financial resources
for a specific time frame with aim to get monetary return while considering any risk conditions
and uncertainty associated (Rainer and et.al., 2013). It can be simply defined as art concerned
with effective money management. This study covers preparation of financial statements i.e.
revenue statement and statement of financial position, break-even analysis and margin of safety.
Study report also includes practical aspects of net present value, accounting rate of return,
payback period and other variables help in determining viability of any project or investment.
TASK
Part A – Yarnshaw Limited:
Statement of Income of Yarnshaw Limited:
Statement of Income of Yarnshaw Limited for the year ended 31st December 2018
Particular Amount Particular Amount
To Opening Inventory - By Sales
To Purchase Credit: 604800
Credit: 583200 Cash: 154800 759600
Cash: 46800 630000 By Closing Inventory 273600
To Wages 140400
Add: Outstanding
Expenses 2610 143010
To Gross Profit 260190
Total 1033200 Total 1033200
To Electricity Bill 6840 By Gross Profit 260190
Add: Outstanding
Expenses 2430 9270
⊘ This is a preview!⊘
Do you want full access?
Subscribe today to unlock all pages.
Trusted by 1+ million students worldwide
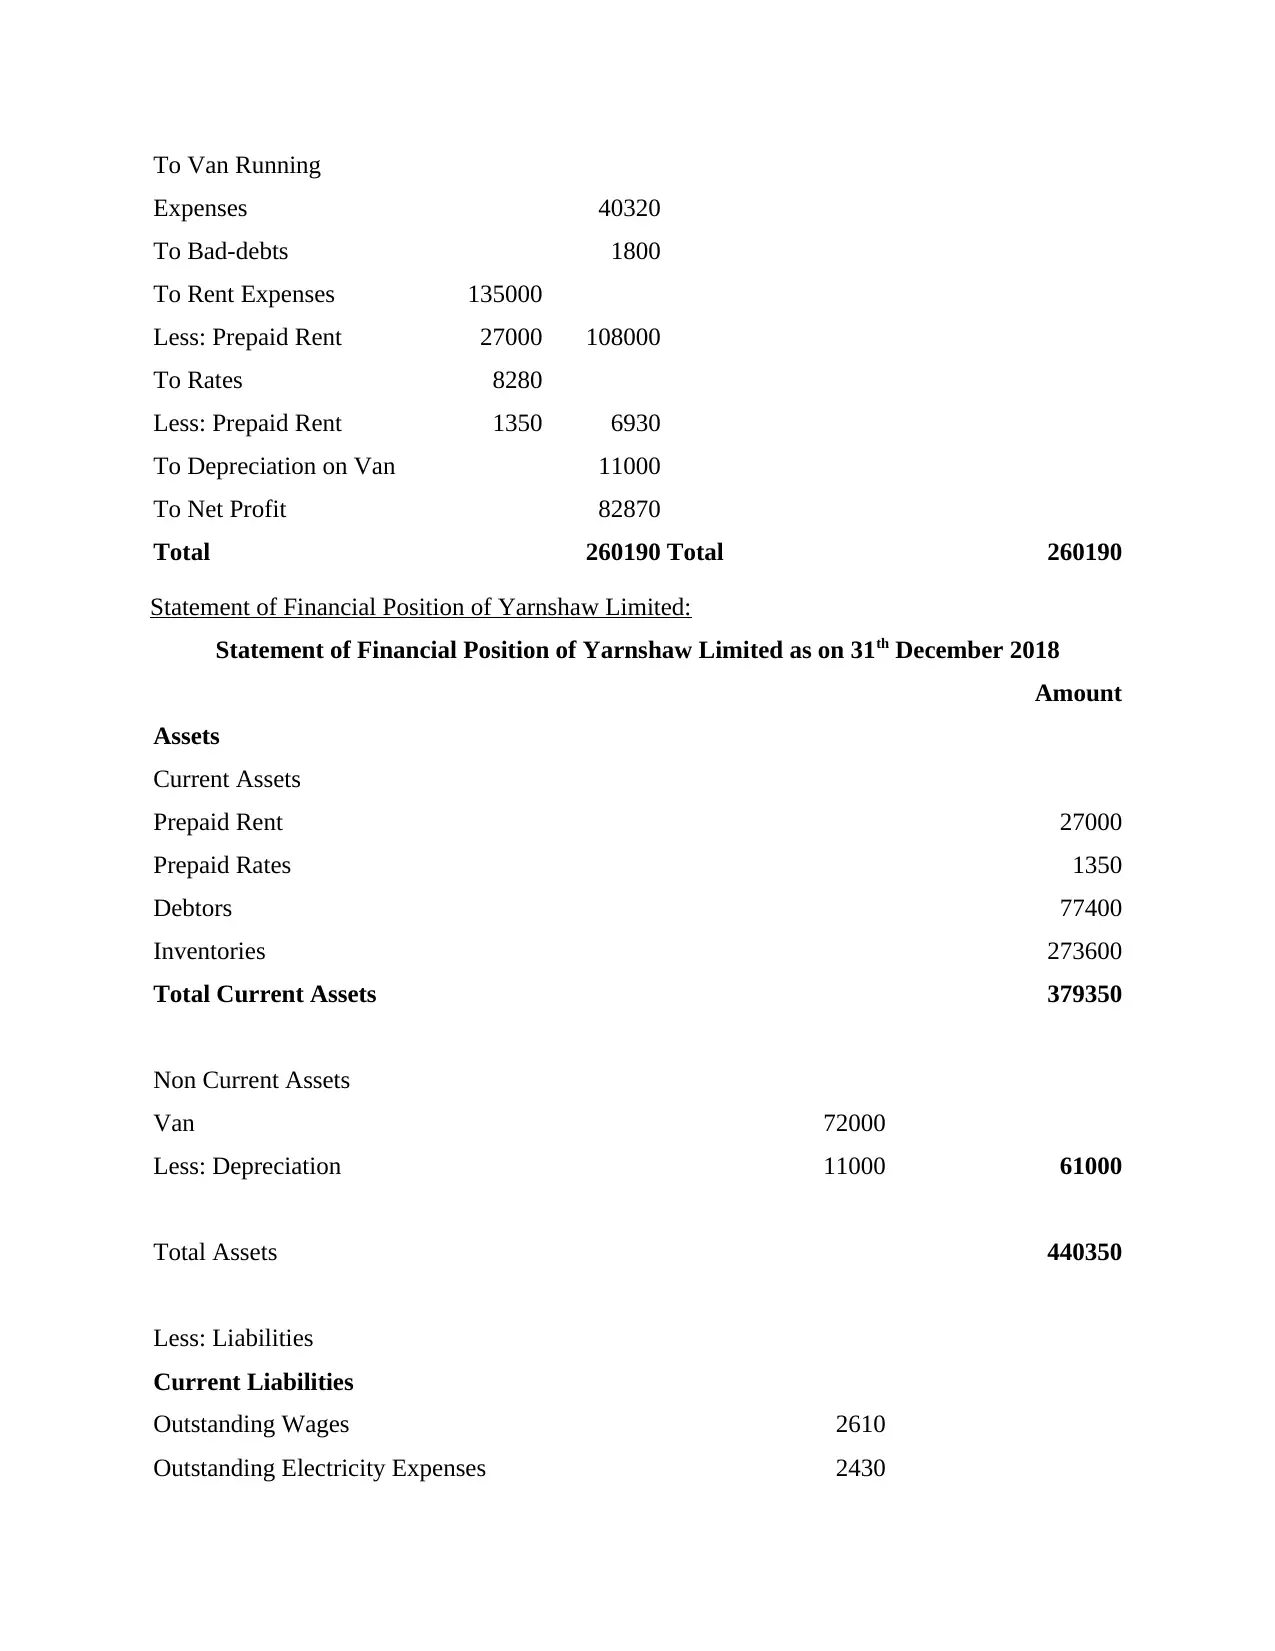
To Van Running
Expenses 40320
To Bad-debts 1800
To Rent Expenses 135000
Less: Prepaid Rent 27000 108000
To Rates 8280
Less: Prepaid Rent 1350 6930
To Depreciation on Van 11000
To Net Profit 82870
Total 260190 Total 260190
Statement of Financial Position of Yarnshaw Limited:
Statement of Financial Position of Yarnshaw Limited as on 31th December 2018
Amount
Assets
Current Assets
Prepaid Rent 27000
Prepaid Rates 1350
Debtors 77400
Inventories 273600
Total Current Assets 379350
Non Current Assets
Van 72000
Less: Depreciation 11000 61000
Total Assets 440350
Less: Liabilities
Current Liabilities
Outstanding Wages 2610
Outstanding Electricity Expenses 2430
Paraphrase This Document
Need a fresh take? Get an instant paraphrase of this document with our AI Paraphraser
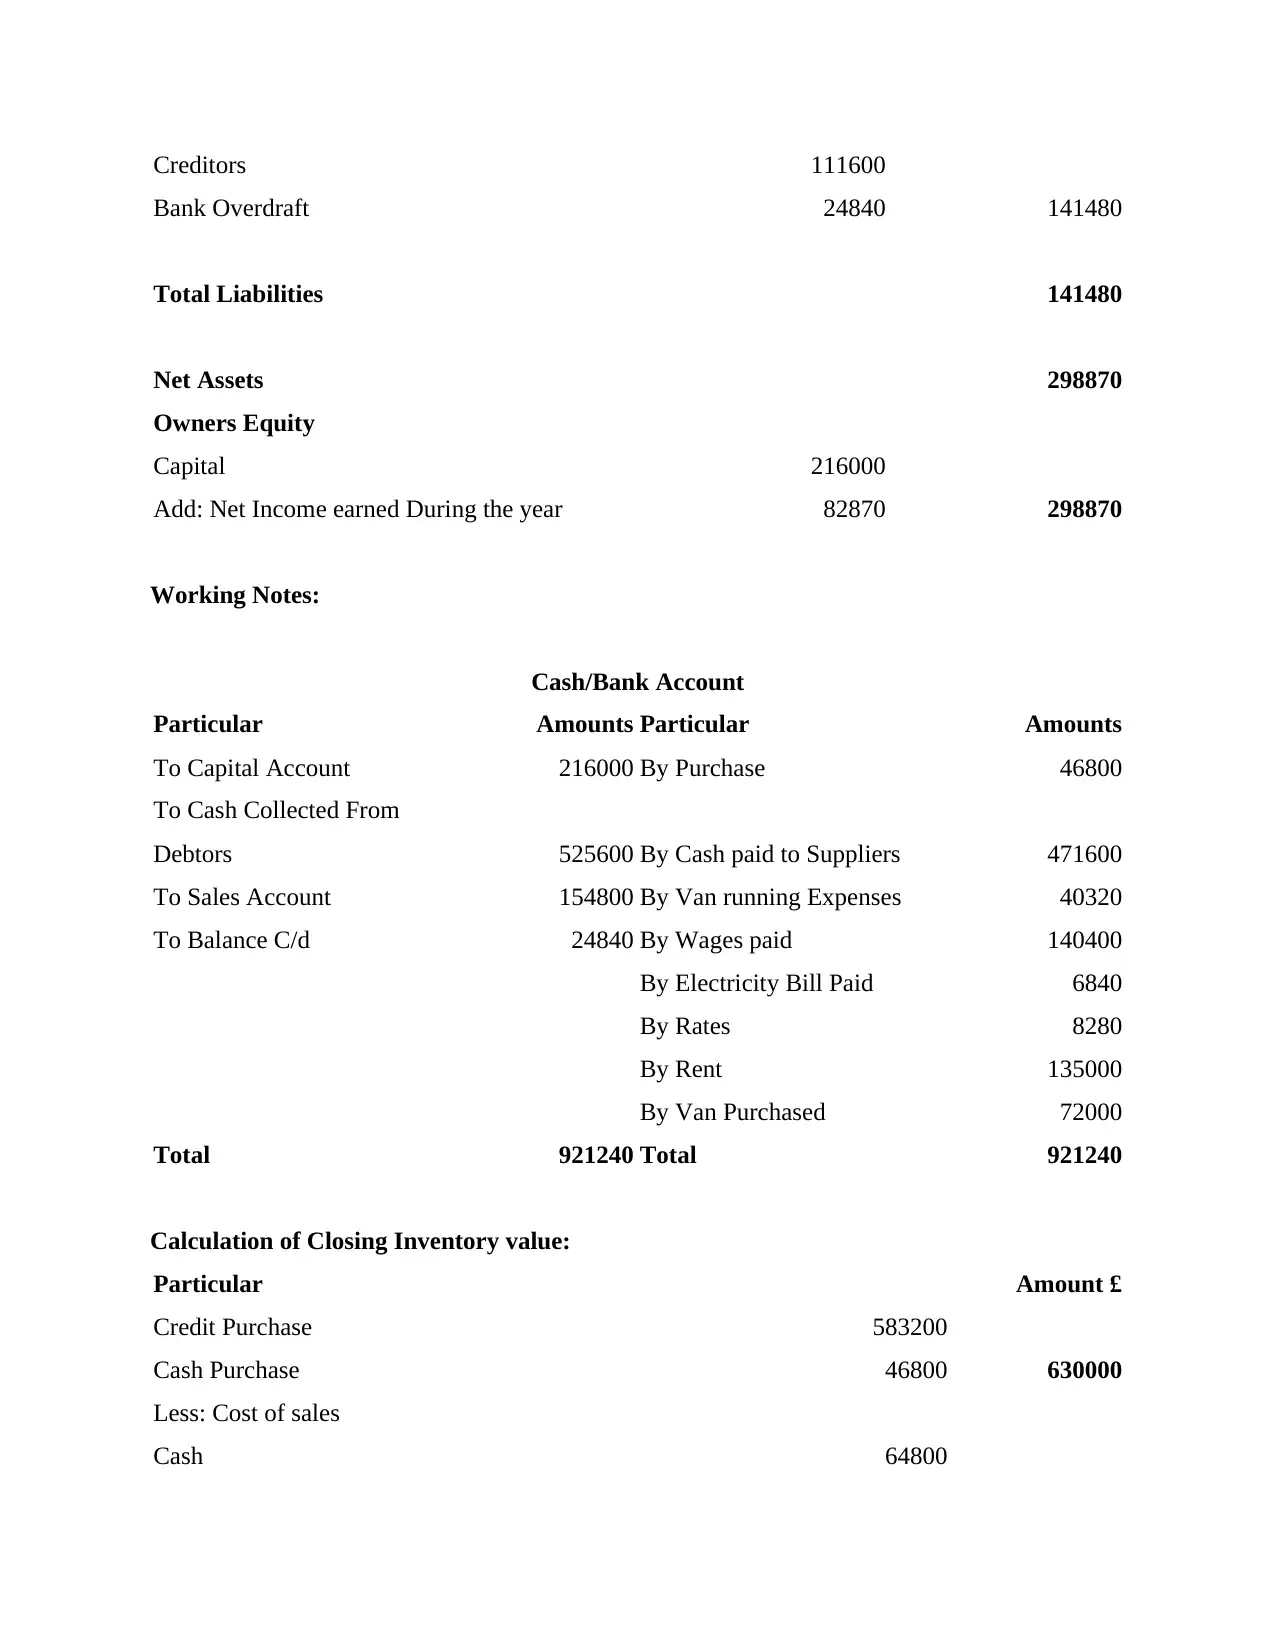
Creditors 111600
Bank Overdraft 24840 141480
Total Liabilities 141480
Net Assets 298870
Owners Equity
Capital 216000
Add: Net Income earned During the year 82870 298870
Working Notes:
Cash/Bank Account
Particular Amounts Particular Amounts
To Capital Account 216000 By Purchase 46800
To Cash Collected From
Debtors 525600 By Cash paid to Suppliers 471600
To Sales Account 154800 By Van running Expenses 40320
To Balance C/d 24840 By Wages paid 140400
By Electricity Bill Paid 6840
By Rates 8280
By Rent 135000
By Van Purchased 72000
Total 921240 Total 921240
Calculation of Closing Inventory value:
Particular Amount £
Credit Purchase 583200
Cash Purchase 46800 630000
Less: Cost of sales
Cash 64800
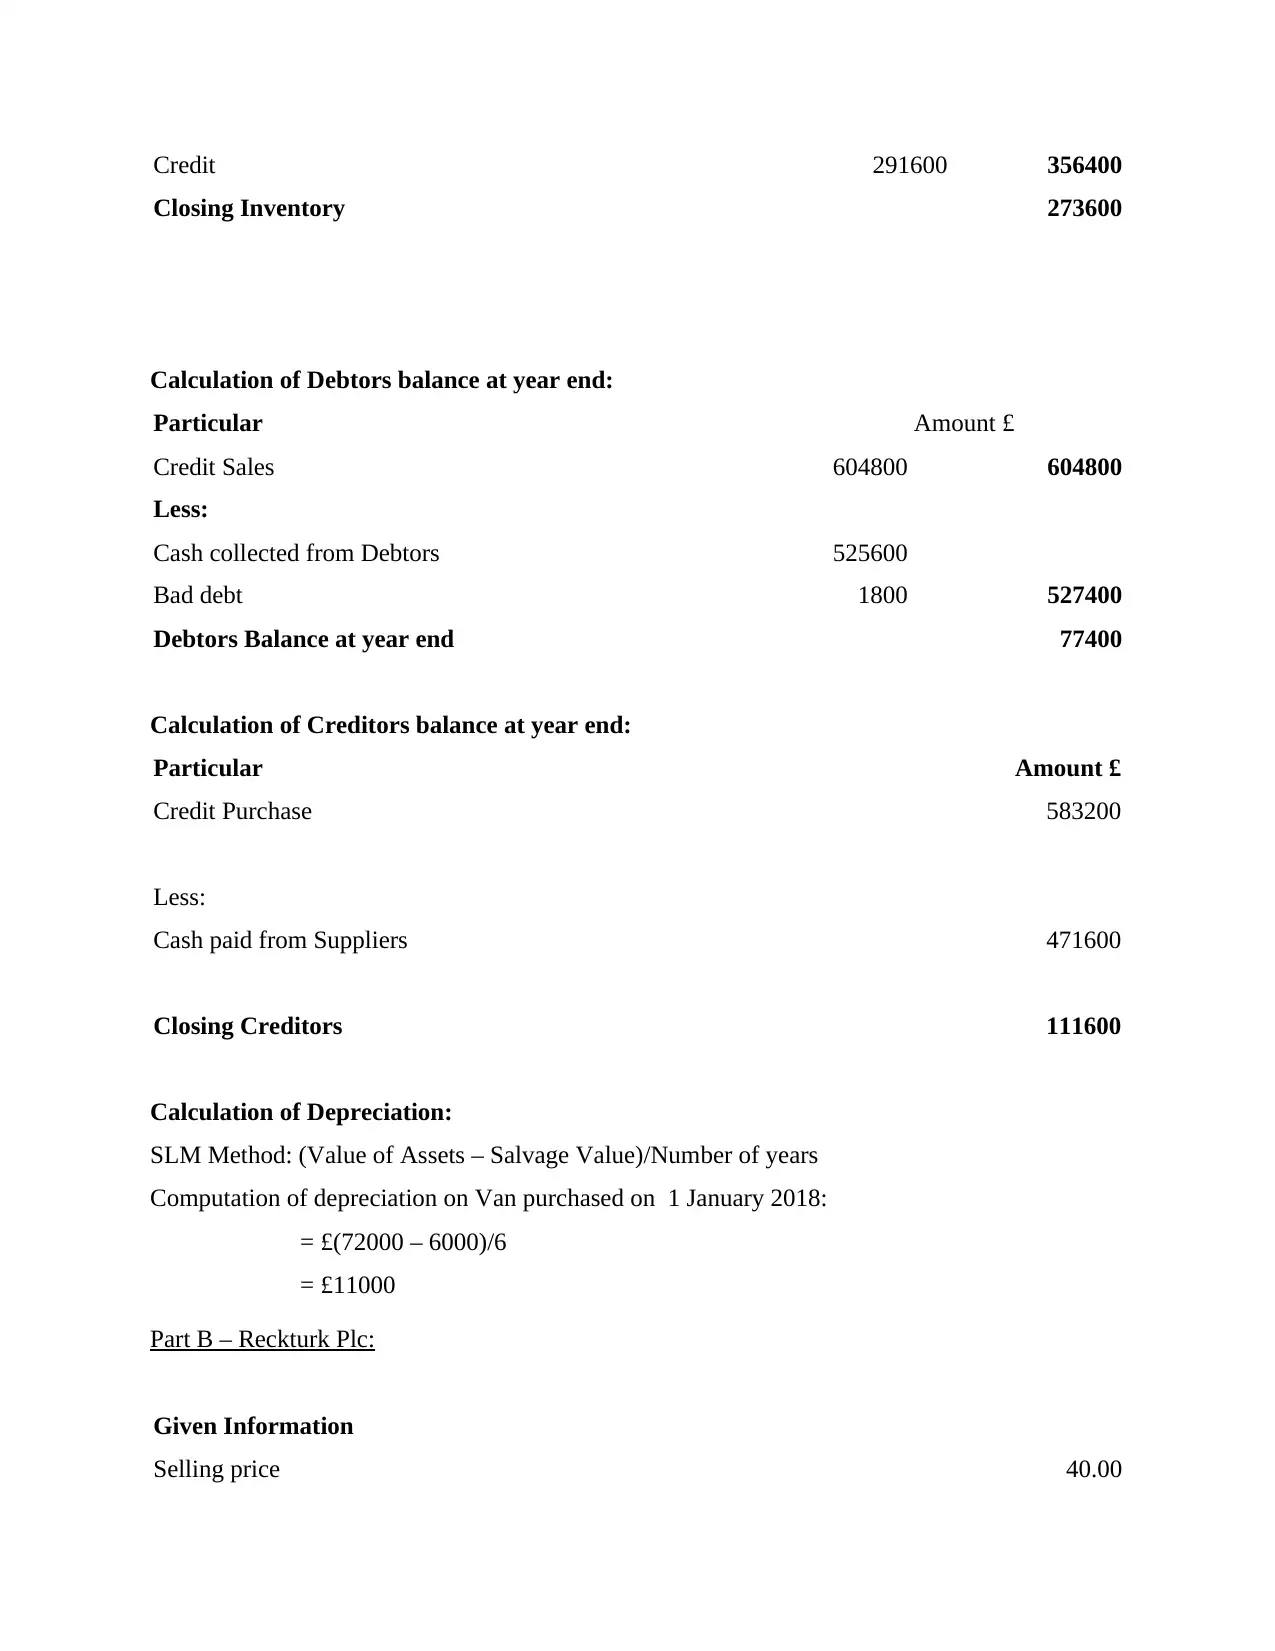
Credit 291600 356400
Closing Inventory 273600
Calculation of Debtors balance at year end:
Particular Amount £
Credit Sales 604800 604800
Less:
Cash collected from Debtors 525600
Bad debt 1800 527400
Debtors Balance at year end 77400
Calculation of Creditors balance at year end:
Particular Amount £
Credit Purchase 583200
Less:
Cash paid from Suppliers 471600
Closing Creditors 111600
Calculation of Depreciation:
SLM Method: (Value of Assets – Salvage Value)/Number of years
Computation of depreciation on Van purchased on 1 January 2018:
= £(72000 – 6000)/6
= £11000
Part B – Reckturk Plc:
Given Information
Selling price 40.00
⊘ This is a preview!⊘
Do you want full access?
Subscribe today to unlock all pages.
Trusted by 1+ million students worldwide
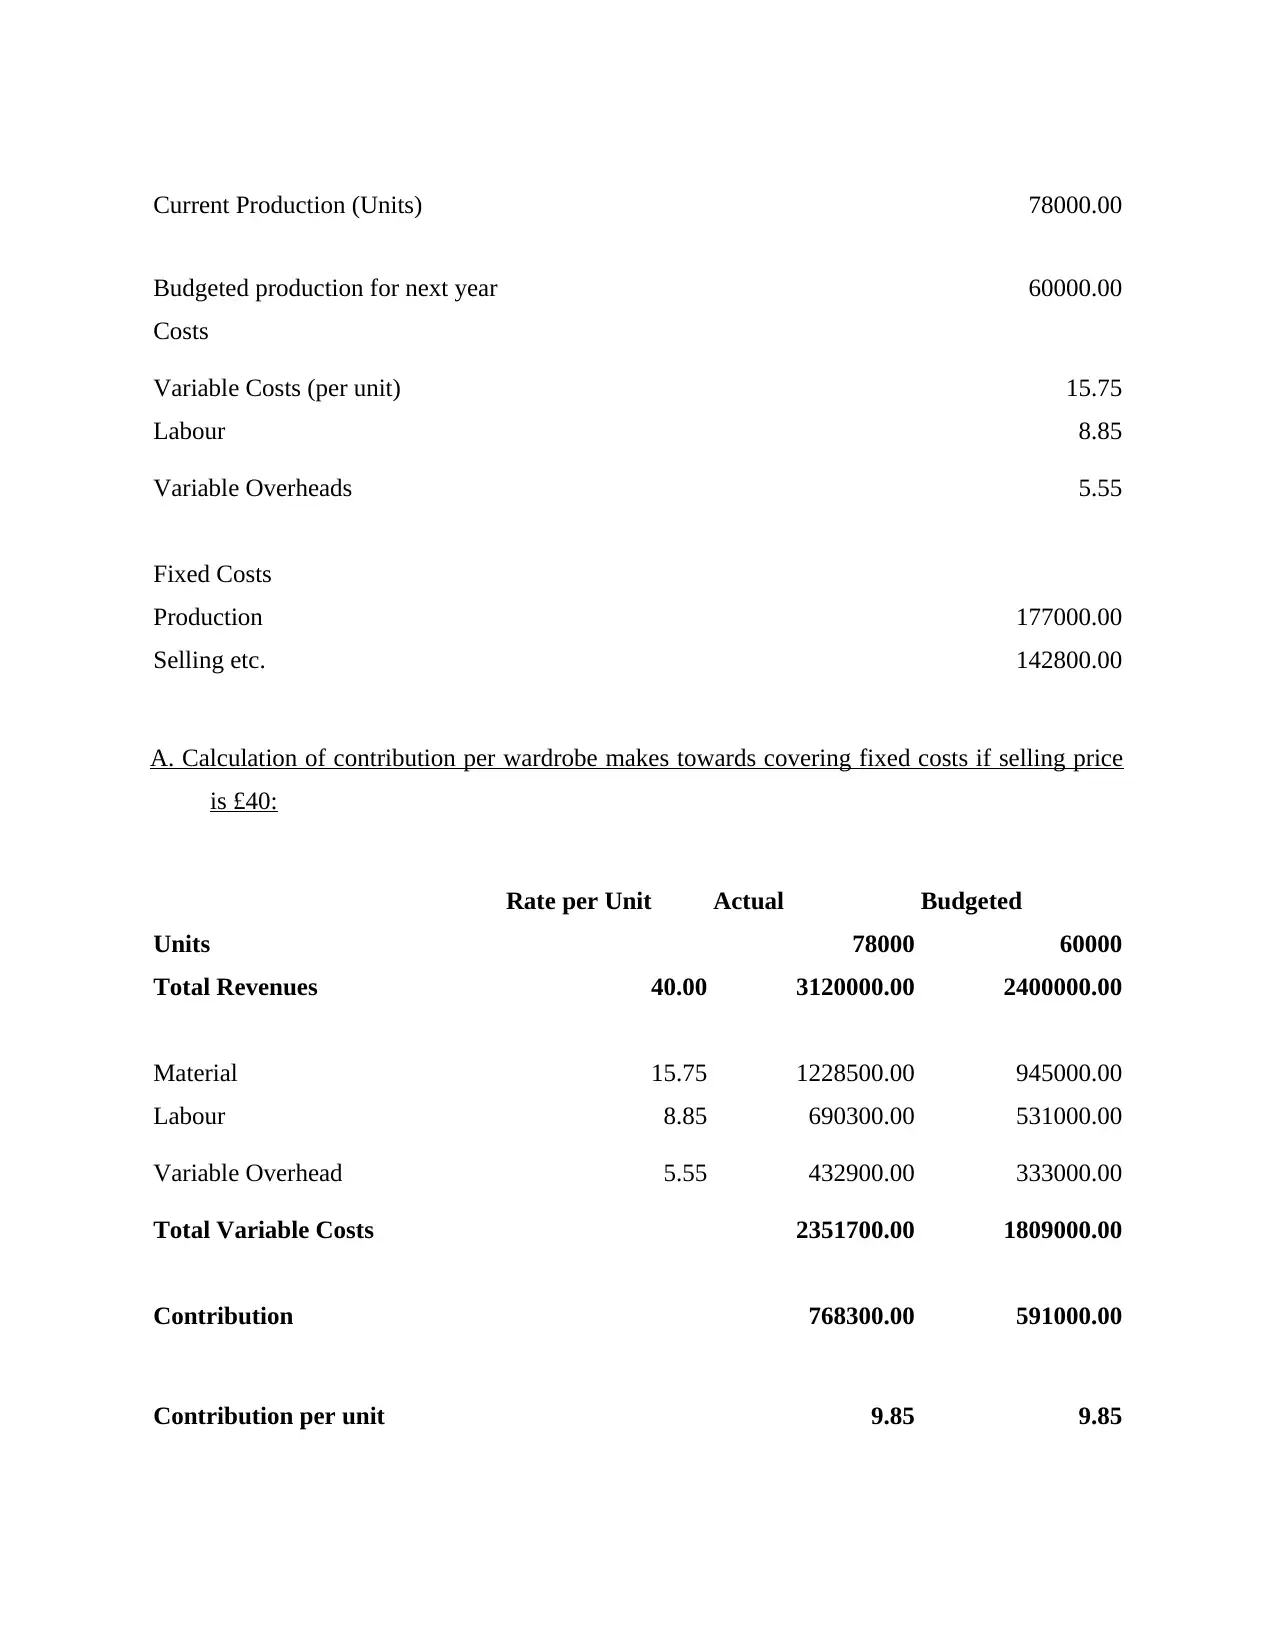
Current Production (Units) 78000.00
Budgeted production for next year 60000.00
Costs
Variable Costs (per unit) 15.75
Labour 8.85
Variable Overheads 5.55
Fixed Costs
Production 177000.00
Selling etc. 142800.00
A. Calculation of contribution per wardrobe makes towards covering fixed costs if selling price
is £40:
Rate per Unit Actual Budgeted
Units 78000 60000
Total Revenues 40.00 3120000.00 2400000.00
Material 15.75 1228500.00 945000.00
Labour 8.85 690300.00 531000.00
Variable Overhead 5.55 432900.00 333000.00
Total Variable Costs 2351700.00 1809000.00
Contribution 768300.00 591000.00
Contribution per unit 9.85 9.85
Paraphrase This Document
Need a fresh take? Get an instant paraphrase of this document with our AI Paraphraser
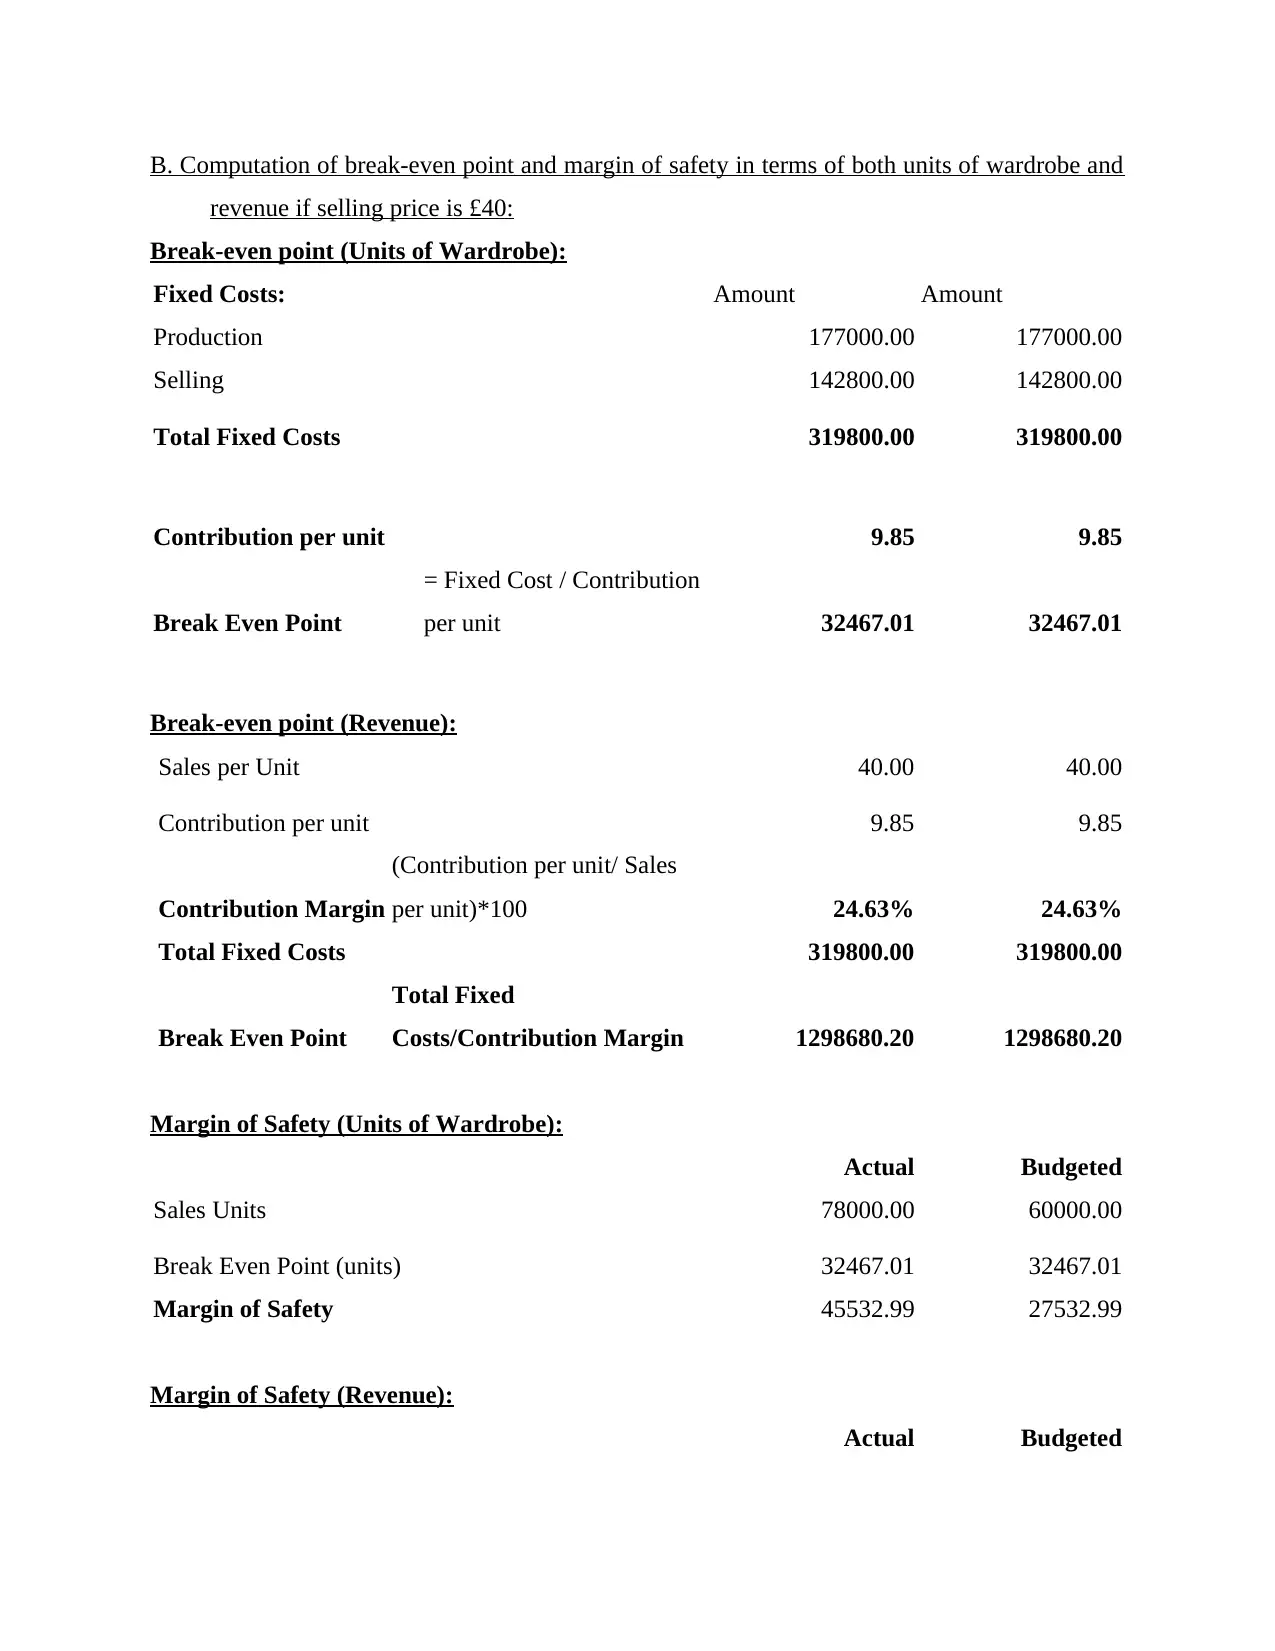
B. Computation of break-even point and margin of safety in terms of both units of wardrobe and
revenue if selling price is £40:
Break-even point (Units of Wardrobe):
Fixed Costs: Amount Amount
Production 177000.00 177000.00
Selling 142800.00 142800.00
Total Fixed Costs 319800.00 319800.00
Contribution per unit 9.85 9.85
Break Even Point
= Fixed Cost / Contribution
per unit 32467.01 32467.01
Break-even point (Revenue):
Sales per Unit 40.00 40.00
Contribution per unit 9.85 9.85
Contribution Margin
(Contribution per unit/ Sales
per unit)*100 24.63% 24.63%
Total Fixed Costs 319800.00 319800.00
Break Even Point
Total Fixed
Costs/Contribution Margin 1298680.20 1298680.20
Margin of Safety (Units of Wardrobe):
Actual Budgeted
Sales Units 78000.00 60000.00
Break Even Point (units) 32467.01 32467.01
Margin of Safety 45532.99 27532.99
Margin of Safety (Revenue):
Actual Budgeted
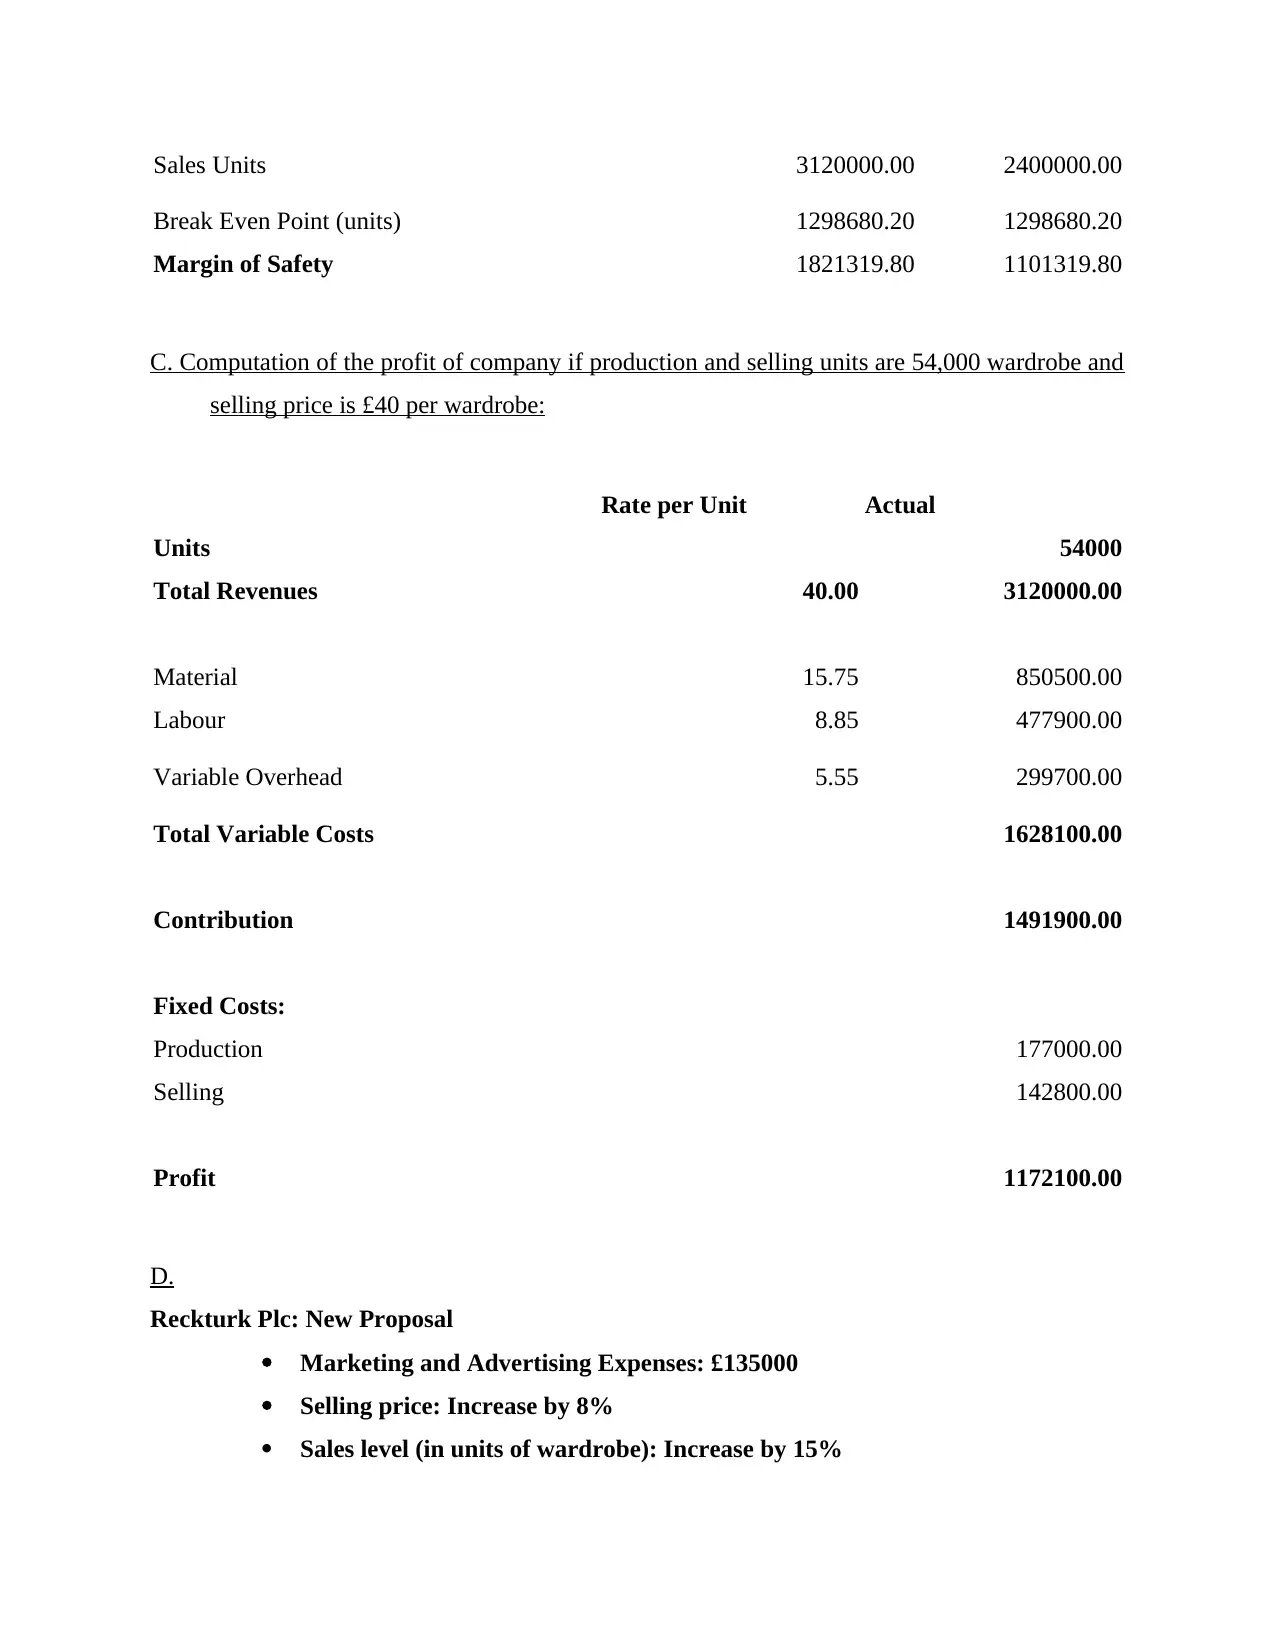
Sales Units 3120000.00 2400000.00
Break Even Point (units) 1298680.20 1298680.20
Margin of Safety 1821319.80 1101319.80
C. Computation of the profit of company if production and selling units are 54,000 wardrobe and
selling price is £40 per wardrobe:
Rate per Unit Actual
Units 54000
Total Revenues 40.00 3120000.00
Material 15.75 850500.00
Labour 8.85 477900.00
Variable Overhead 5.55 299700.00
Total Variable Costs 1628100.00
Contribution 1491900.00
Fixed Costs:
Production 177000.00
Selling 142800.00
Profit 1172100.00
D.
Reckturk Plc: New Proposal
Marketing and Advertising Expenses: £135000
Selling price: Increase by 8%
Sales level (in units of wardrobe): Increase by 15%
⊘ This is a preview!⊘
Do you want full access?
Subscribe today to unlock all pages.
Trusted by 1+ million students worldwide
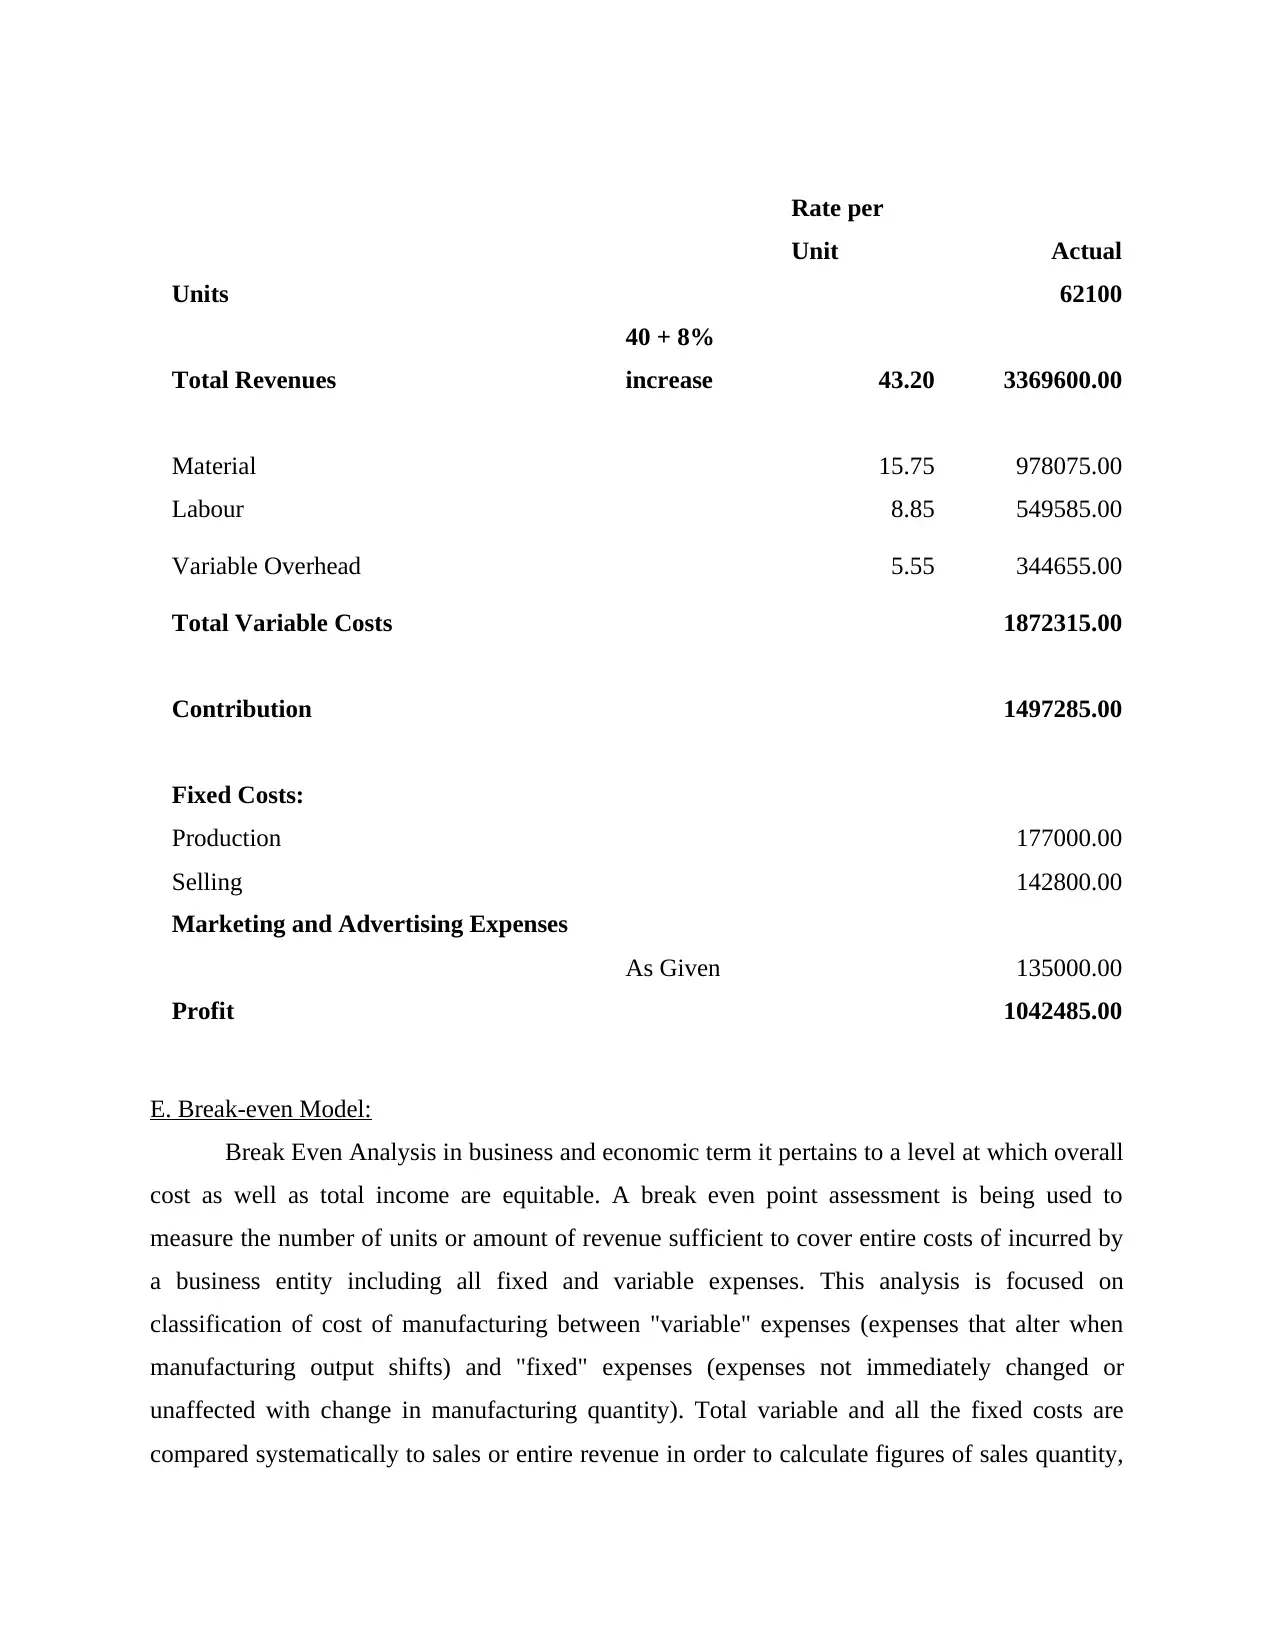
Rate per
Unit Actual
Units 62100
Total Revenues
40 + 8%
increase 43.20 3369600.00
Material 15.75 978075.00
Labour 8.85 549585.00
Variable Overhead 5.55 344655.00
Total Variable Costs 1872315.00
Contribution 1497285.00
Fixed Costs:
Production 177000.00
Selling 142800.00
Marketing and Advertising Expenses
As Given 135000.00
Profit 1042485.00
E. Break-even Model:
Break Even Analysis in business and economic term it pertains to a level at which overall
cost as well as total income are equitable. A break even point assessment is being used to
measure the number of units or amount of revenue sufficient to cover entire costs of incurred by
a business entity including all fixed and variable expenses. This analysis is focused on
classification of cost of manufacturing between "variable" expenses (expenses that alter when
manufacturing output shifts) and "fixed" expenses (expenses not immediately changed or
unaffected with change in manufacturing quantity). Total variable and all the fixed costs are
compared systematically to sales or entire revenue in order to calculate figures of sales quantity,
Paraphrase This Document
Need a fresh take? Get an instant paraphrase of this document with our AI Paraphraser

sales price or outputs level at which enterprise does not make any profit or any loss (Maskell,
Baggaley and Grasso, 2012). It also facilitates determining what quantity is required to sold,
annually or monthly, to recover cost incurred in making such sales. Break even point can be
presented in number of units and amount of revenue. Formulas which help in assessing a break
even point is discussed as follows:
Break even units = Fixed costs / (Sales price per unit – Variable cost per unit)
Break-even point ( Revenue) = Fixed costs / Contribution Margin
Where:
Fixed costs are expenses which do not fluctuate with changes in output.
Sales price p.u. Implies to selling price of each single unit.
Variable cost p.u. is variable expenses associated with manufacturing of single unit.
Contribution Margin = Contribution per unit x 100
Sales per unit
Contribution per unit = Sales price per unit less Variable cost per unit
Break even model can be applied by all form of business entities. It is simple method
which provides appropriate result irrespective of nature of business. Further it act as base for
calculating margin of safety. Because executives understand that fixed and variable costs
influence company profit margins, with the aid of break-even analysis, they could see the impact
of cost adjustments. It enables them to determine the level to which change in costs or cost
adjustments influence profit margins and break-even (Di Pietra, McLeay and Ronen, 2013). The
break-even point could be affected by any shift in sales price. For illustration, the number of
units required to be sold to break-even will be decreased if the sale price is expanded. Similarly,
a company requires to buy more to break-even if the sale price is decreased.
As in given case of Reckturk Plc, from calculation of break even point it has been
analysed that at production and sales level of 78000 units company's break-even sales in units is
32467.01 or 32467 units approx and break-even sales is pound 1298680.20. Which implies that
company is required to maintain their sales and production level at 32467 at least to avoid any
loss. Also revenue benchmark of 1298680.20 is necessary to avoid net loss figures.
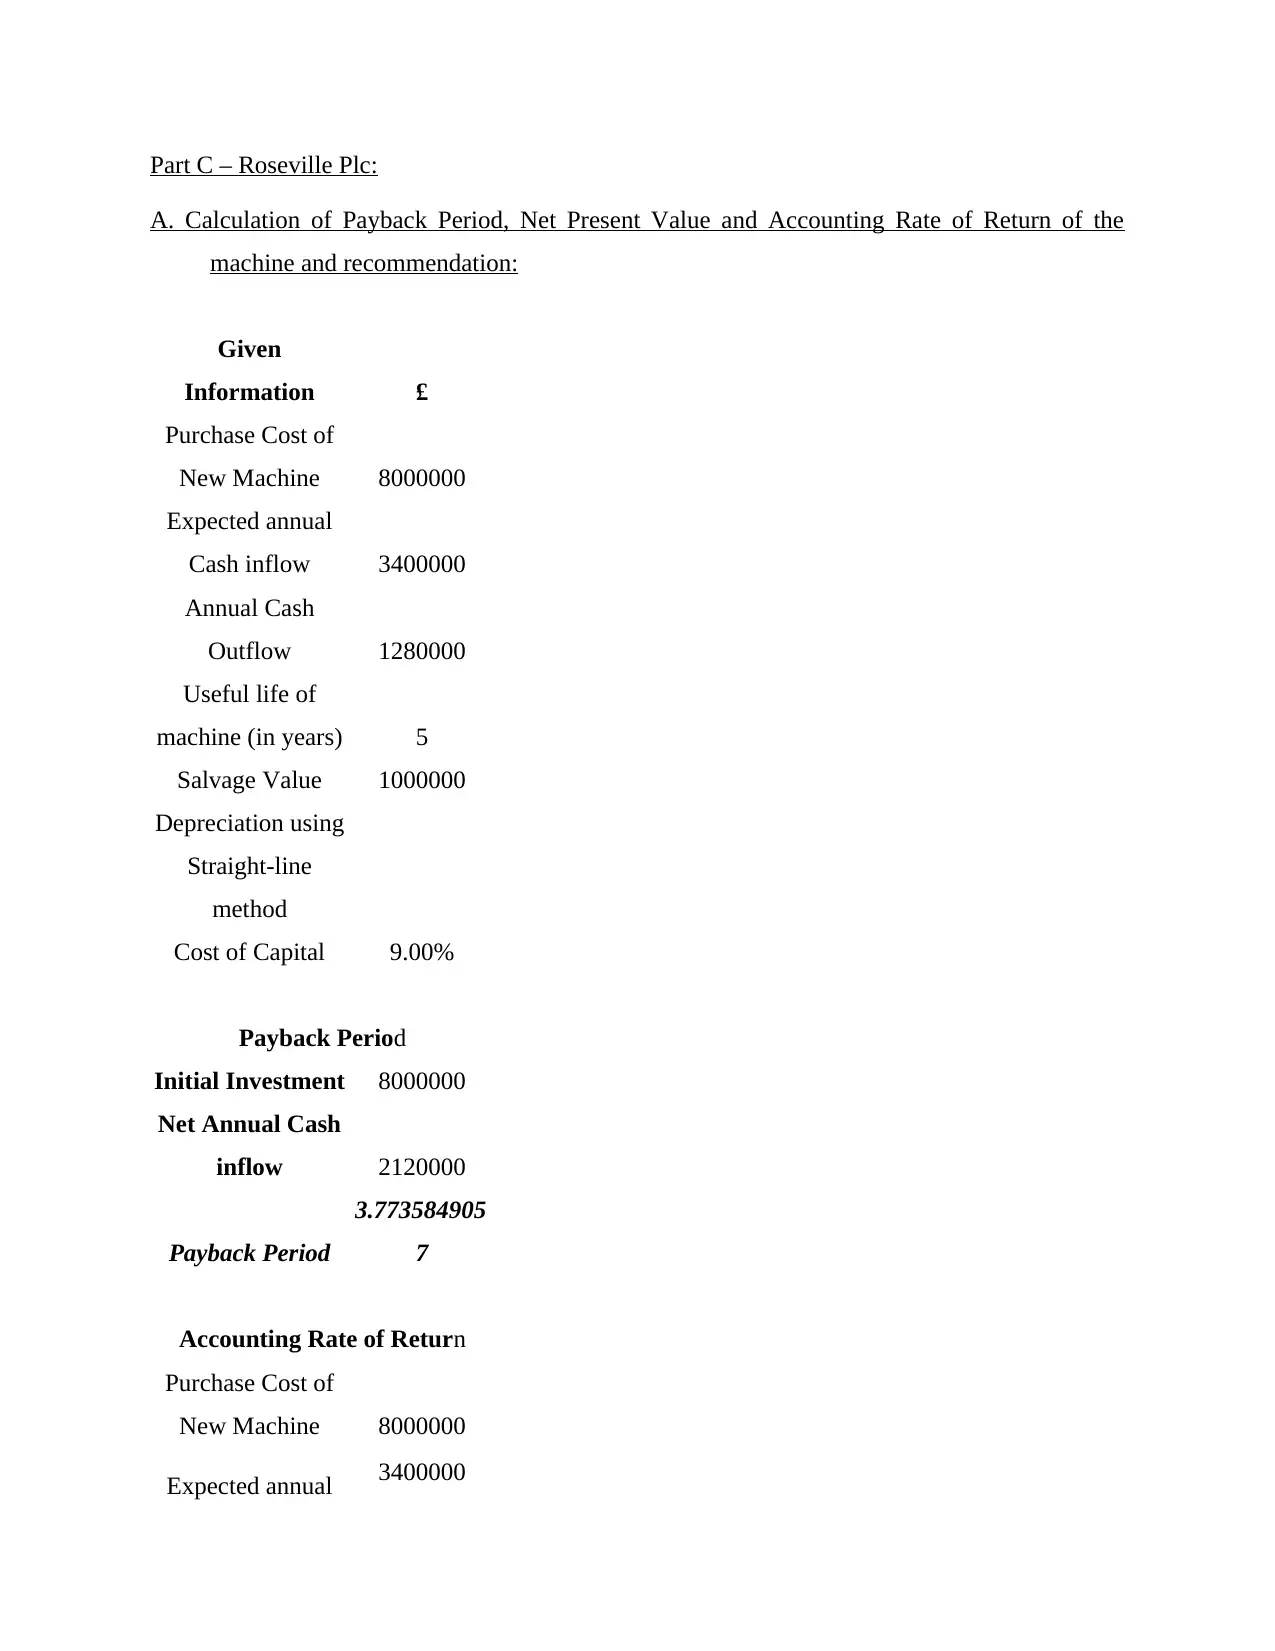
Part C – Roseville Plc:
A. Calculation of Payback Period, Net Present Value and Accounting Rate of Return of the
machine and recommendation:
Given
Information £
Purchase Cost of
New Machine 8000000
Expected annual
Cash inflow 3400000
Annual Cash
Outflow 1280000
Useful life of
machine (in years) 5
Salvage Value 1000000
Depreciation using
Straight-line
method
Cost of Capital 9.00%
Payback Period
Initial Investment 8000000
Net Annual Cash
inflow 2120000
Payback Period
3.773584905
7
Accounting Rate of Return
Purchase Cost of
New Machine 8000000
Expected annual 3400000
⊘ This is a preview!⊘
Do you want full access?
Subscribe today to unlock all pages.
Trusted by 1+ million students worldwide
1 out of 17
Related Documents


Your All-in-One AI-Powered Toolkit for Academic Success.
+13062052269
info@desklib.com
Available 24*7 on WhatsApp / Email
![[object Object]](/_next/static/media/star-bottom.7253800d.svg)
Unlock your academic potential
Copyright © 2020–2026 A2Z Services. All Rights Reserved. Developed and managed by ZUCOL.