Finance for Managers: Financial Analysis and Budgeting Report
VerifiedAdded on 2020/02/05
|15
|4080
|35
Report
AI Summary
This report, designed for finance managers, begins with an overview of financial statements including balance sheets, income statements, cash flow statements, and statements of equity, detailing their uses and significance. It then delves into management accounting, comparing it with financial accounting and highlighting its role in decision-making and cost control. The report proceeds to calculate the selling price of a new ice cream product, incorporating direct materials, labor, and various costs to determine a profitable selling point, and then explores break-even analysis. The report also examines flexible budgeting, comparing original, revised, and actual budgets to assess performance and variance. Finally, it performs a project appraisal, calculating net present value (NPV), average rate of return (ARR), internal rate of return (IRR), and payback period for two projects, providing recommendations for investment based on these financial metrics.

FINANCE FOR MANAGERS
Paraphrase This Document
Need a fresh take? Get an instant paraphrase of this document with our AI Paraphraser
TABLE OF CONTENTS
Introduction .........................................................................................................................................3
Task 1....................................................................................................................................................3
1.1...............................................................................................................................................3
1.2...............................................................................................................................................4
1.3...............................................................................................................................................4
1.4...............................................................................................................................................5
Task 2....................................................................................................................................................6
2.1...............................................................................................................................................6
Task 3....................................................................................................................................................8
3.1...............................................................................................................................................8
3.2.............................................................................................................................................11
3.3.............................................................................................................................................12
CONCLUSION..................................................................................................................................13
References..........................................................................................................................................14
INTRODUCTION
Finance is a pillar of corporate and it deals in investment. It can be easily converted into
cash. Identification and analysis of financial problems has been carried out in this report. The
purpose of this project is to identify the uses of financial statements in different accounting and to
know about the selling price of the product. Budgets are estimated for launching a new product. Net
present value, payback period and internal rate of return estimated so that entity can launch the new
product (Ishikawa and Takahashi, 2010). In this report, the budget planning is to be described. To
get proper financial information of the company it is necessary to estimate the financial position of
the company. Investment policies are based on the fair and true financial report of the company.
TASK 1
1.1
Financial statement explains the financial activities of the company. By these statements, the
performance and stability of the entity can be identified (Fernandes, 2014). Mainly four financial
statements is there that is statement of cash flow, balance sheet, income statement and the statement
of equity.
Balance sheet: It is a most prominent financial document of the company. It contains three
elements i.e. assets, equity and liability. Assets are something which is possessed by the
business for example, land, building, machinery. Liability is the obligation for the
organization. It is mentioned in the balance sheet (Lambert, 2012). Some examples of
liabilities are creditors, bank loans and overdraft. In short, it can be assessed that equity is
the difference between assets and liability.
Statement of equity: - It signifies the changes in equity during the period. It includes the sale
and purchase of stock and payment of dividend. In this statement, profit and loss generally
fluctuates as per the financial position of the entity.
Cash flow statement: - It indicates the inflow and outflow of cash and bank as well as
describes the movement of cash. It is divided into different segments: - Operating activity
represents the first activity of cash in entity. Investing activity denotes the purchase and sale
of assets except inventory (Bean and Hussey, 2012). Financing activity describes the sources
of funds and uses of find. It is helpful in taking decisions for the business.
Income statement: - It signifies the net profit and loss of the corporate and through this it
identifies the company's financial position. It is divided into parts: - Income which is earned
⊘ This is a preview!⊘
Do you want full access?
Subscribe today to unlock all pages.
Trusted by 1+ million students worldwide
by the business in a year such as dividend income. Expenses are that cost which is suffered
by the company such as wages.
1.2
Uses of the financial statements: - With the help these statements, it can be determined that
whether the entity can sustain in the market or not (Mohsin, 2013). According to the cash flow, the
company can take decision that where the investment should be done and cash should be used.
Evaluation can be carried out by these statements according to the performance (Director, 2012). It
is used by the government for checking the correctness of the payment of taxes. The documents are
helpful in taking the long term decisions and are also used as a source of historical records. These
assertions are used by the customers, employees, government, competitors etc.
Financial accounting denotes the position of the entity to its external shareholders whereas
the management accounting is used by the managers for daily operations of the business. Budgeting
count includes balance sheet, income statement and cash flow statement while administration rate
includes capital budgeting, breakeven point.
Significance of management accounting:-
1. Helps in increasing the efficiency of the management and assist in decision making (Vieira,
2016). Management accounting controls the cost of production; it can lead to increments in profits.
2. It aids to identify the risk, and resources should be allocated. Performance of the company is
measured by the management accounting.
3. For small business, management accounting is very powerful tool for making better decisions.
4. For achieving the goals, price determination should be done by evaluating, planning and
controlling the manufacturing operations (Marciukaityte and Szewczyk, 2011).
Substance of financial accounting:-
It helps to improve the financial position of the company and provide information related to
finance of the entity.
Management accounting is helpful in finding the omitted facts and figures.
1.3
Finding the selling price of new ice cream product:
Units produced is 8000
Direct material cost is £9000
Paraphrase This Document
Need a fresh take? Get an instant paraphrase of this document with our AI Paraphraser
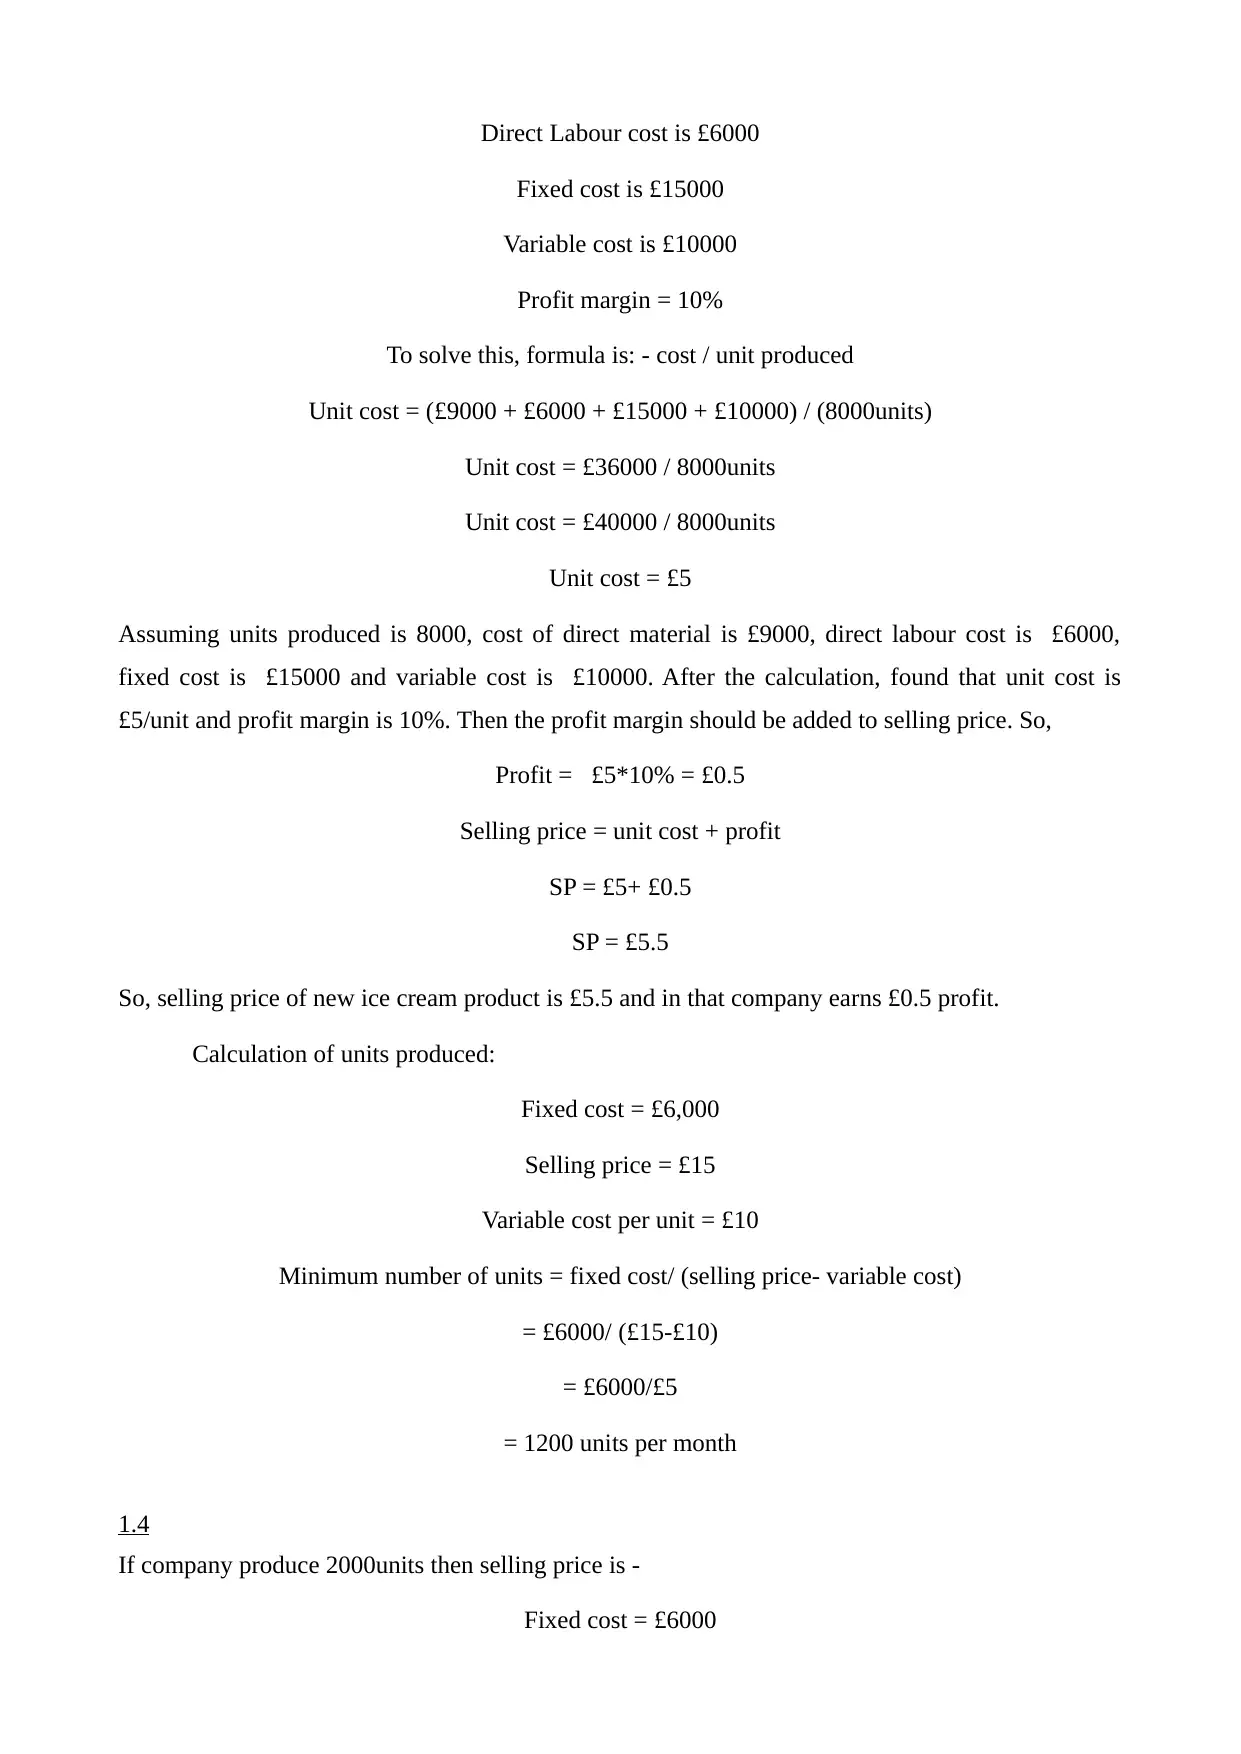
Direct Labour cost is £6000
Fixed cost is £15000
Variable cost is £10000
Profit margin = 10%
To solve this, formula is: - cost / unit produced
Unit cost = (£9000 + £6000 + £15000 + £10000) / (8000units)
Unit cost = £36000 / 8000units
Unit cost = £40000 / 8000units
Unit cost = £5
Assuming units produced is 8000, cost of direct material is £9000, direct labour cost is £6000,
fixed cost is £15000 and variable cost is £10000. After the calculation, found that unit cost is
£5/unit and profit margin is 10%. Then the profit margin should be added to selling price. So,
Profit = £5*10% = £0.5
Selling price = unit cost + profit
SP = £5+ £0.5
SP = £5.5
So, selling price of new ice cream product is £5.5 and in that company earns £0.5 profit.
Calculation of units produced:
Fixed cost = £6,000
Selling price = £15
Variable cost per unit = £10
Minimum number of units = fixed cost/ (selling price- variable cost)
= £6000/ (£15-£10)
= £6000/£5
= 1200 units per month
1.4
If company produce 2000units then selling price is -
Fixed cost = £6000
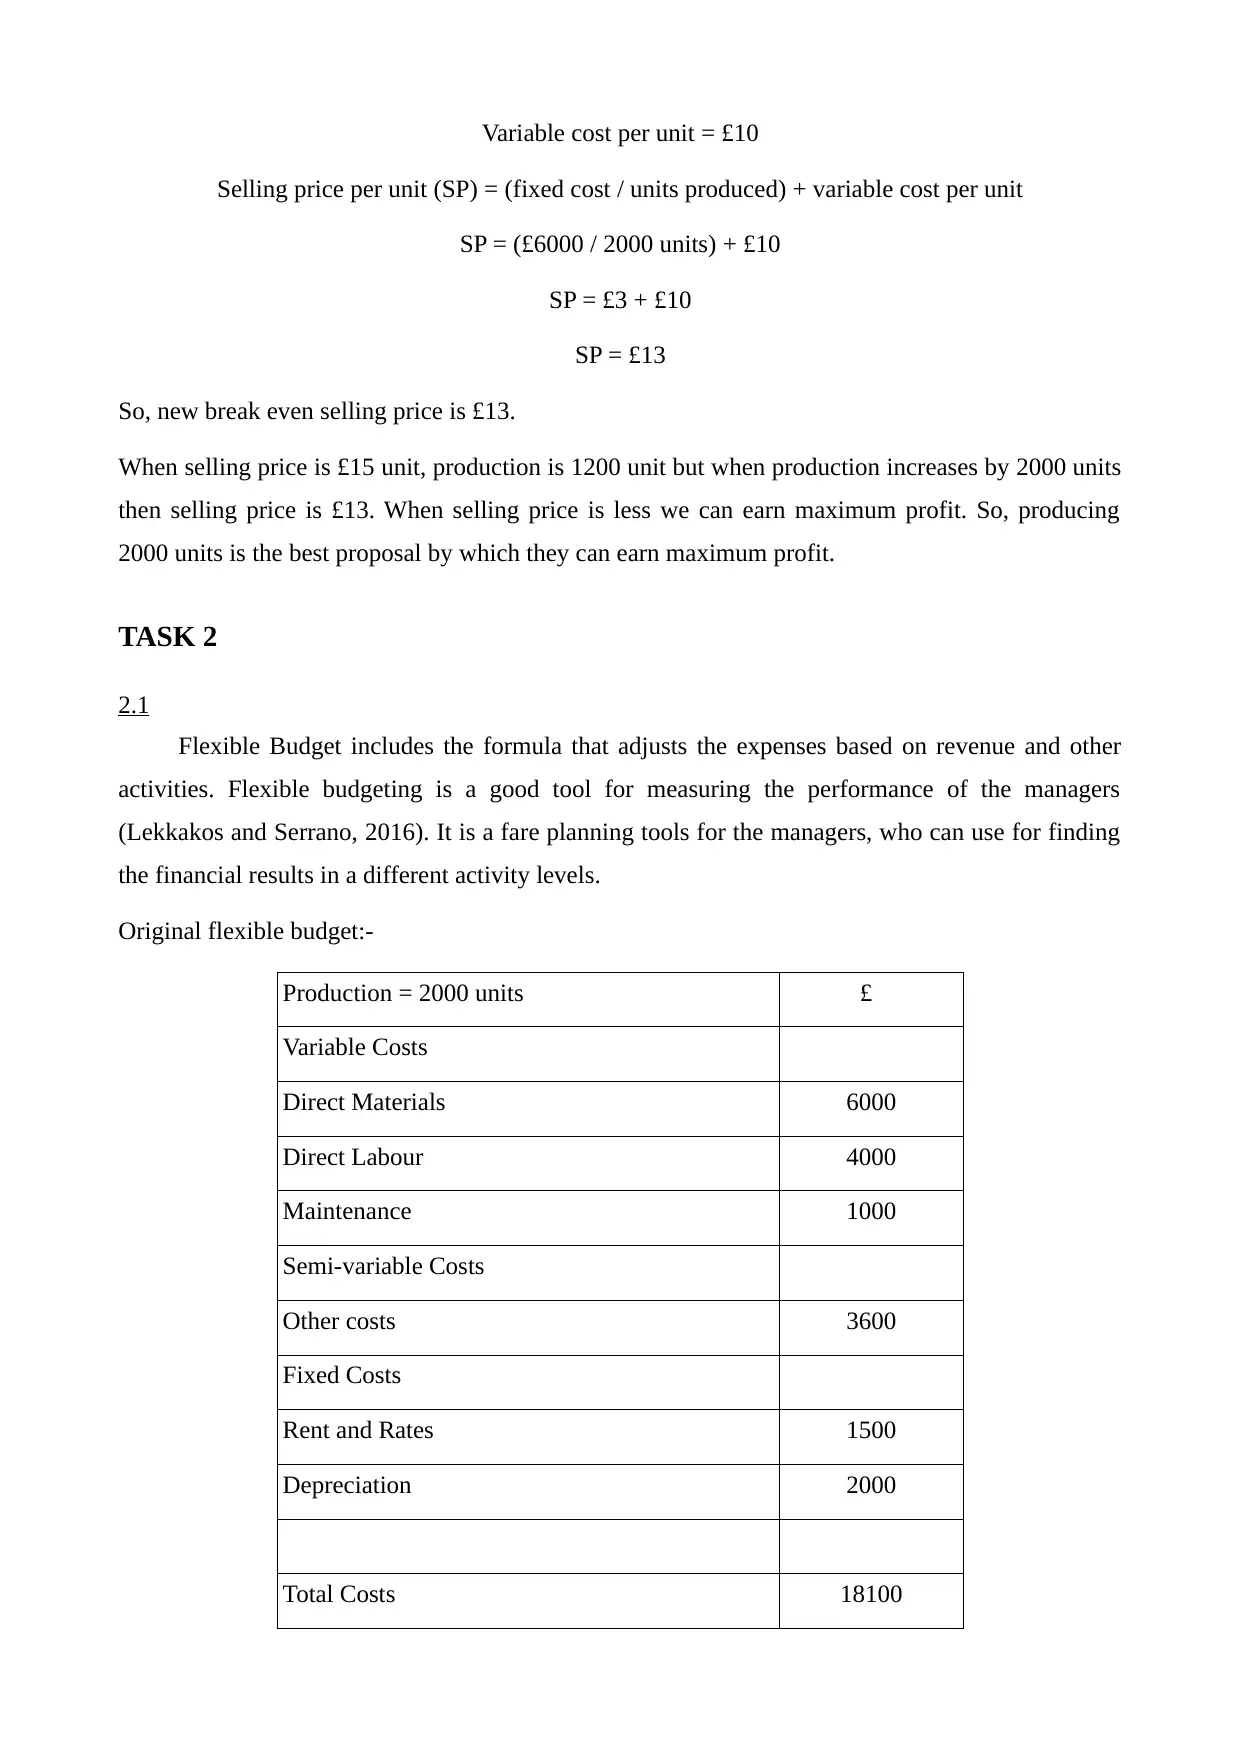
Variable cost per unit = £10
Selling price per unit (SP) = (fixed cost / units produced) + variable cost per unit
SP = (£6000 / 2000 units) + £10
SP = £3 + £10
SP = £13
So, new break even selling price is £13.
When selling price is £15 unit, production is 1200 unit but when production increases by 2000 units
then selling price is £13. When selling price is less we can earn maximum profit. So, producing
2000 units is the best proposal by which they can earn maximum profit.
TASK 2
2.1
Flexible Budget includes the formula that adjusts the expenses based on revenue and other
activities. Flexible budgeting is a good tool for measuring the performance of the managers
(Lekkakos and Serrano, 2016). It is a fare planning tools for the managers, who can use for finding
the financial results in a different activity levels.
Original flexible budget:-
Production = 2000 units £
Variable Costs
Direct Materials 6000
Direct Labour 4000
Maintenance 1000
Semi-variable Costs
Other costs 3600
Fixed Costs
Rent and Rates 1500
Depreciation 2000
Total Costs 18100
⊘ This is a preview!⊘
Do you want full access?
Subscribe today to unlock all pages.
Trusted by 1+ million students worldwide
Due to increasing demand, production has been increased by 50% by considering direct
material, direct labour and maintenance as a variable. Rent and rates as well as depreciation are
considered to be as the fixed cost. Other cost is £1600 but when the production increases cost
increase by £1 per unit.
Revised Flexible Budget:-
Production = 3000 units £
Variable Costs
Direct Materials 9000
Direct Labour 6000
Maintenance 1500
Semi-variable Costs
Other Costs 4600
Fixed Costs
Rent & Rates 1500
Depreciation 2000
Total Costs 22600
Actual Budget for the year:-
Production = 3000 units £
Variable Costs
Direct Materials 8500
Direct Labour 4500
Maintenance 1400
Semi-variable Costs
Other Costs 5000
Fixed Costs
Rent & Rates 1600
Paraphrase This Document
Need a fresh take? Get an instant paraphrase of this document with our AI Paraphraser
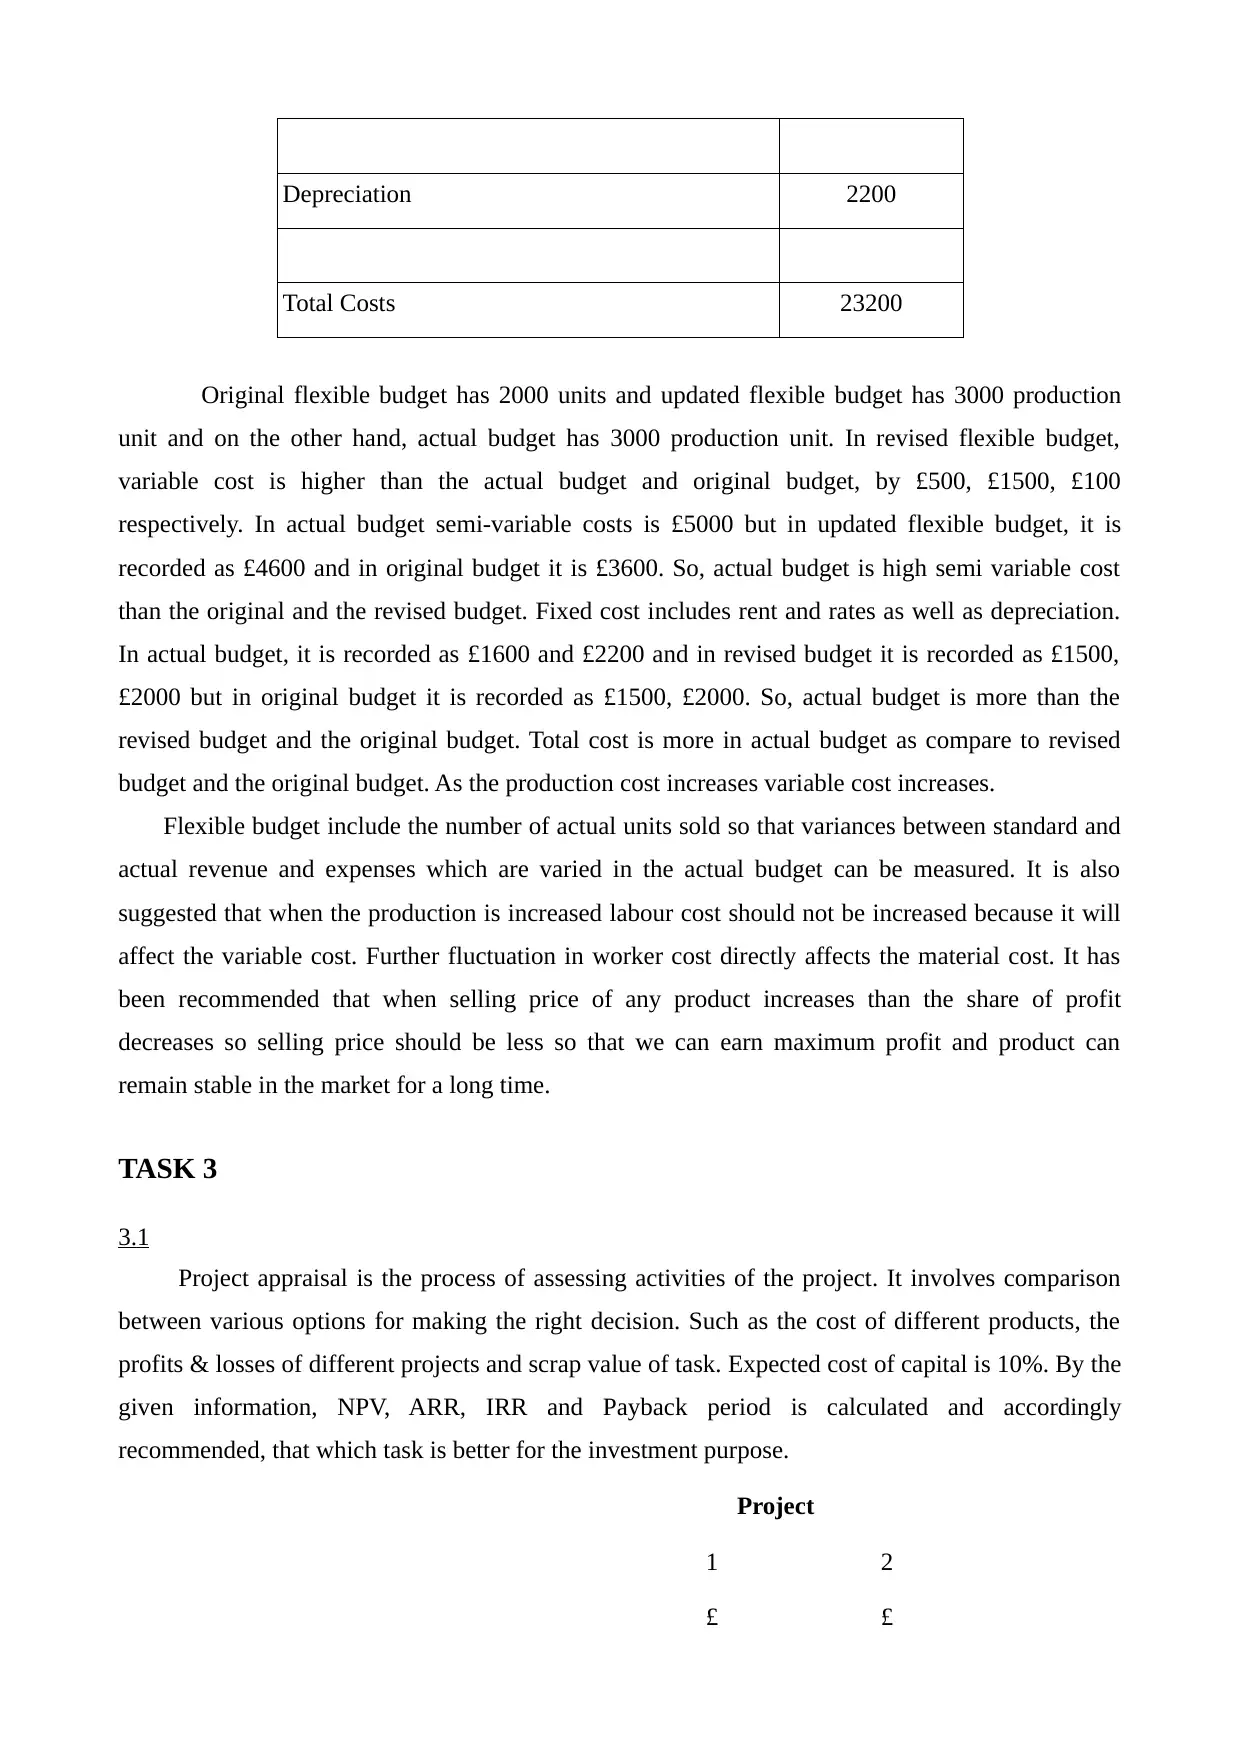
Depreciation 2200
Total Costs 23200
Original flexible budget has 2000 units and updated flexible budget has 3000 production
unit and on the other hand, actual budget has 3000 production unit. In revised flexible budget,
variable cost is higher than the actual budget and original budget, by £500, £1500, £100
respectively. In actual budget semi-variable costs is £5000 but in updated flexible budget, it is
recorded as £4600 and in original budget it is £3600. So, actual budget is high semi variable cost
than the original and the revised budget. Fixed cost includes rent and rates as well as depreciation.
In actual budget, it is recorded as £1600 and £2200 and in revised budget it is recorded as £1500,
£2000 but in original budget it is recorded as £1500, £2000. So, actual budget is more than the
revised budget and the original budget. Total cost is more in actual budget as compare to revised
budget and the original budget. As the production cost increases variable cost increases.
Flexible budget include the number of actual units sold so that variances between standard and
actual revenue and expenses which are varied in the actual budget can be measured. It is also
suggested that when the production is increased labour cost should not be increased because it will
affect the variable cost. Further fluctuation in worker cost directly affects the material cost. It has
been recommended that when selling price of any product increases than the share of profit
decreases so selling price should be less so that we can earn maximum profit and product can
remain stable in the market for a long time.
TASK 3
3.1
Project appraisal is the process of assessing activities of the project. It involves comparison
between various options for making the right decision. Such as the cost of different products, the
profits & losses of different projects and scrap value of task. Expected cost of capital is 10%. By the
given information, NPV, ARR, IRR and Payback period is calculated and accordingly
recommended, that which task is better for the investment purpose.
Project
1 2
£ £
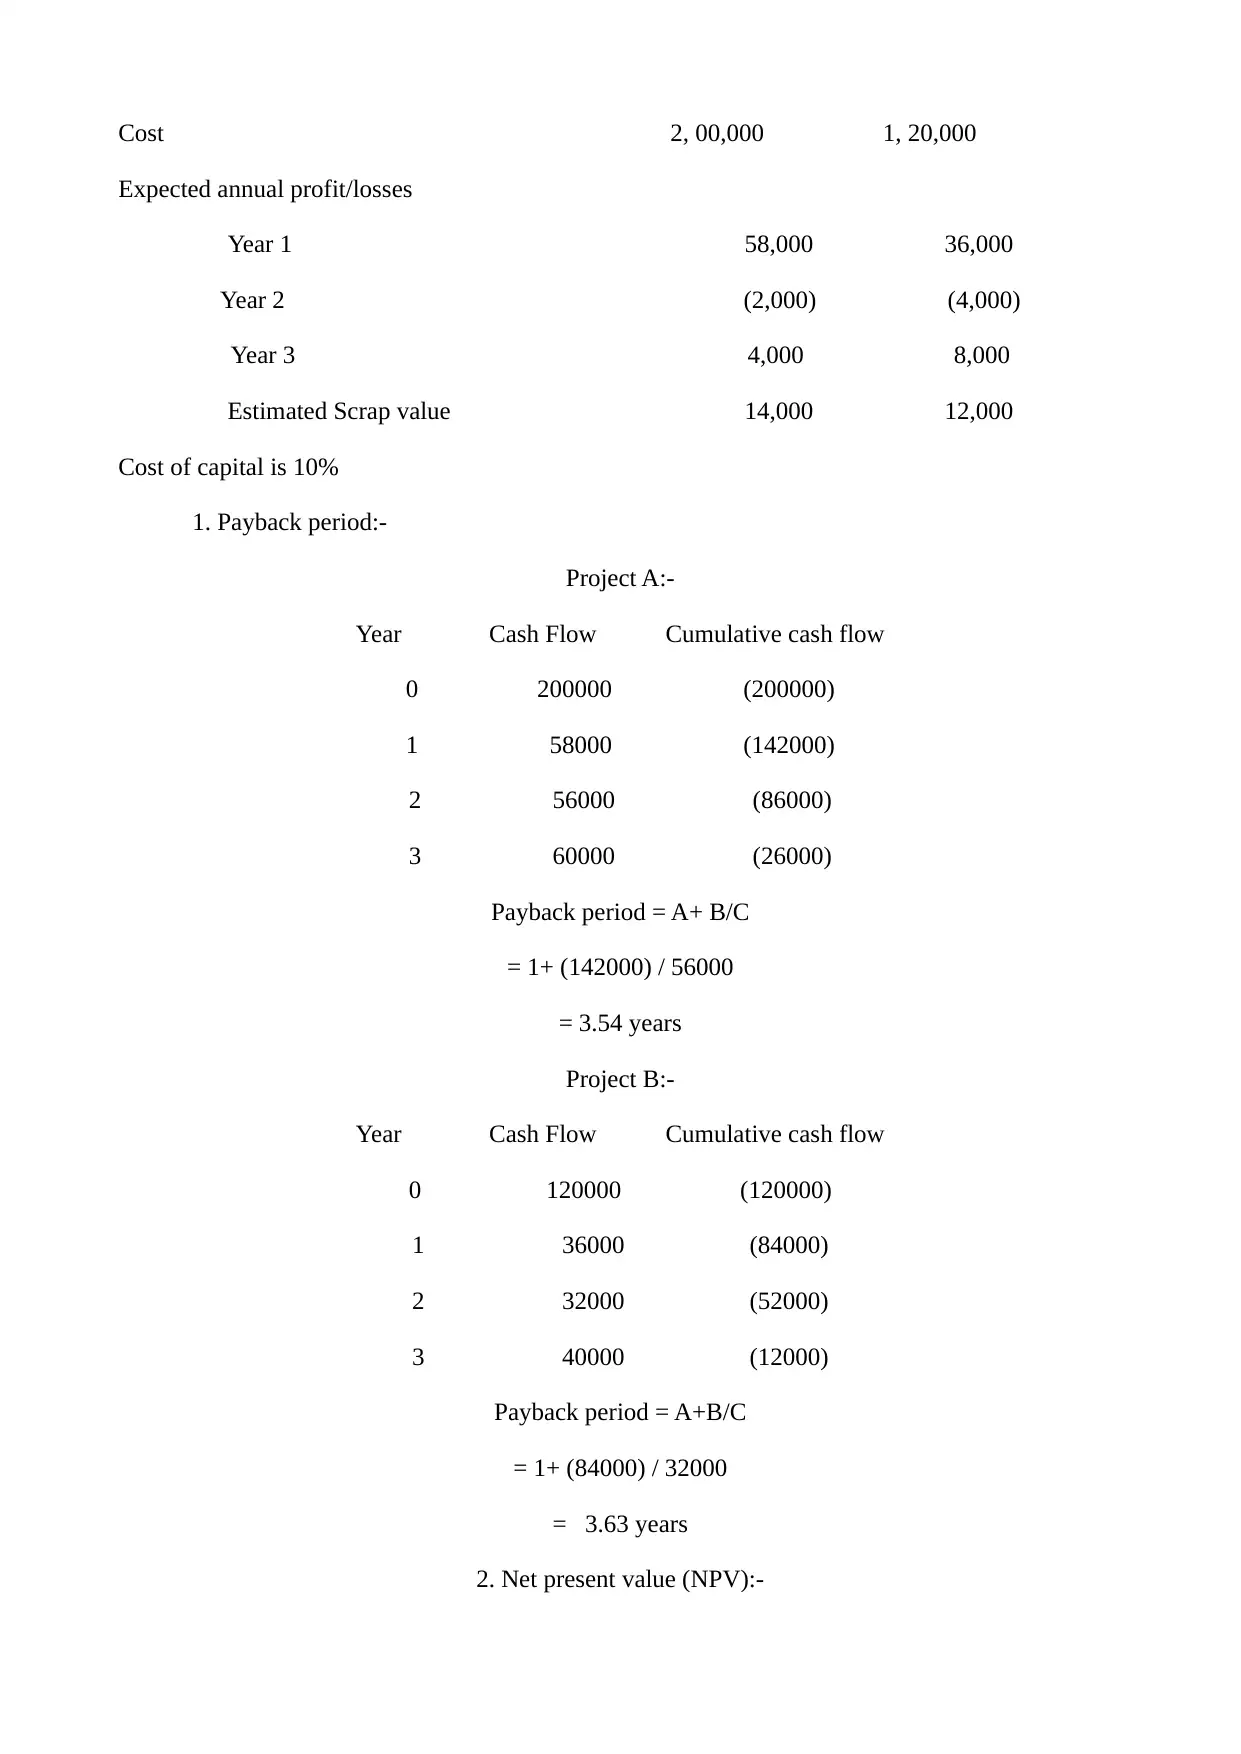
Cost 2, 00,000 1, 20,000
Expected annual profit/losses
Year 1 58,000 36,000
Year 2 (2,000) (4,000)
Year 3 4,000 8,000
Estimated Scrap value 14,000 12,000
Cost of capital is 10%
1. Payback period:-
Project A:-
Year Cash Flow Cumulative cash flow
0 200000 (200000)
1 58000 (142000)
2 56000 (86000)
3 60000 (26000)
Payback period = A+ B/C
= 1+ (142000) / 56000
= 3.54 years
Project B:-
Year Cash Flow Cumulative cash flow
0 120000 (120000)
1 36000 (84000)
2 32000 (52000)
3 40000 (12000)
Payback period = A+B/C
= 1+ (84000) / 32000
= 3.63 years
2. Net present value (NPV):-
⊘ This is a preview!⊘
Do you want full access?
Subscribe today to unlock all pages.
Trusted by 1+ million students worldwide
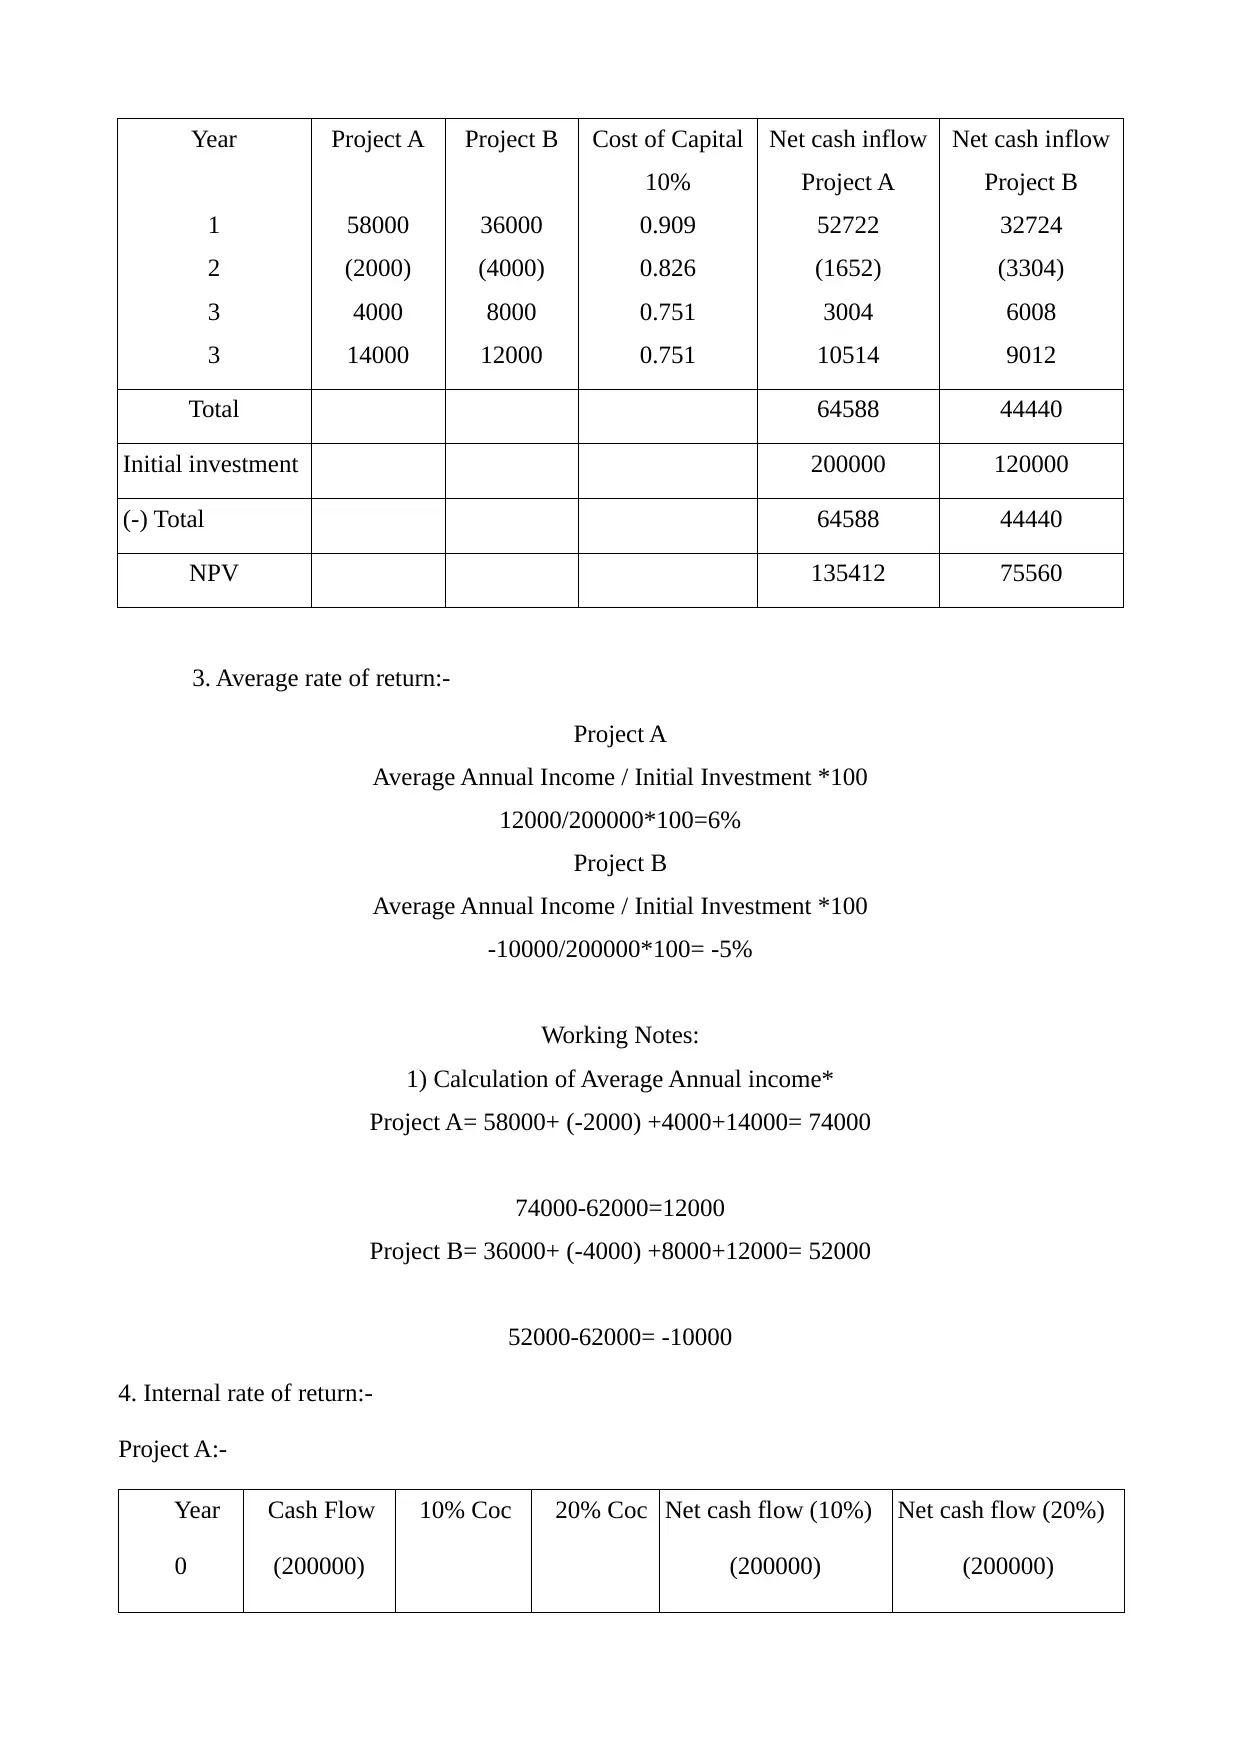
Year
1
2
3
3
Project A
58000
(2000)
4000
14000
Project B
36000
(4000)
8000
12000
Cost of Capital
10%
0.909
0.826
0.751
0.751
Net cash inflow
Project A
52722
(1652)
3004
10514
Net cash inflow
Project B
32724
(3304)
6008
9012
Total 64588 44440
Initial investment 200000 120000
(-) Total 64588 44440
NPV 135412 75560
3. Average rate of return:-
Project A
Average Annual Income / Initial Investment *100
12000/200000*100=6%
Project B
Average Annual Income / Initial Investment *100
-10000/200000*100= -5%
Working Notes:
1) Calculation of Average Annual income*
Project A= 58000+ (-2000) +4000+14000= 74000
74000-62000=12000
Project B= 36000+ (-4000) +8000+12000= 52000
52000-62000= -10000
4. Internal rate of return:-
Project A:-
Year
0
Cash Flow
(200000)
10% Coc 20% Coc Net cash flow (10%)
(200000)
Net cash flow (20%)
(200000)
Paraphrase This Document
Need a fresh take? Get an instant paraphrase of this document with our AI Paraphraser
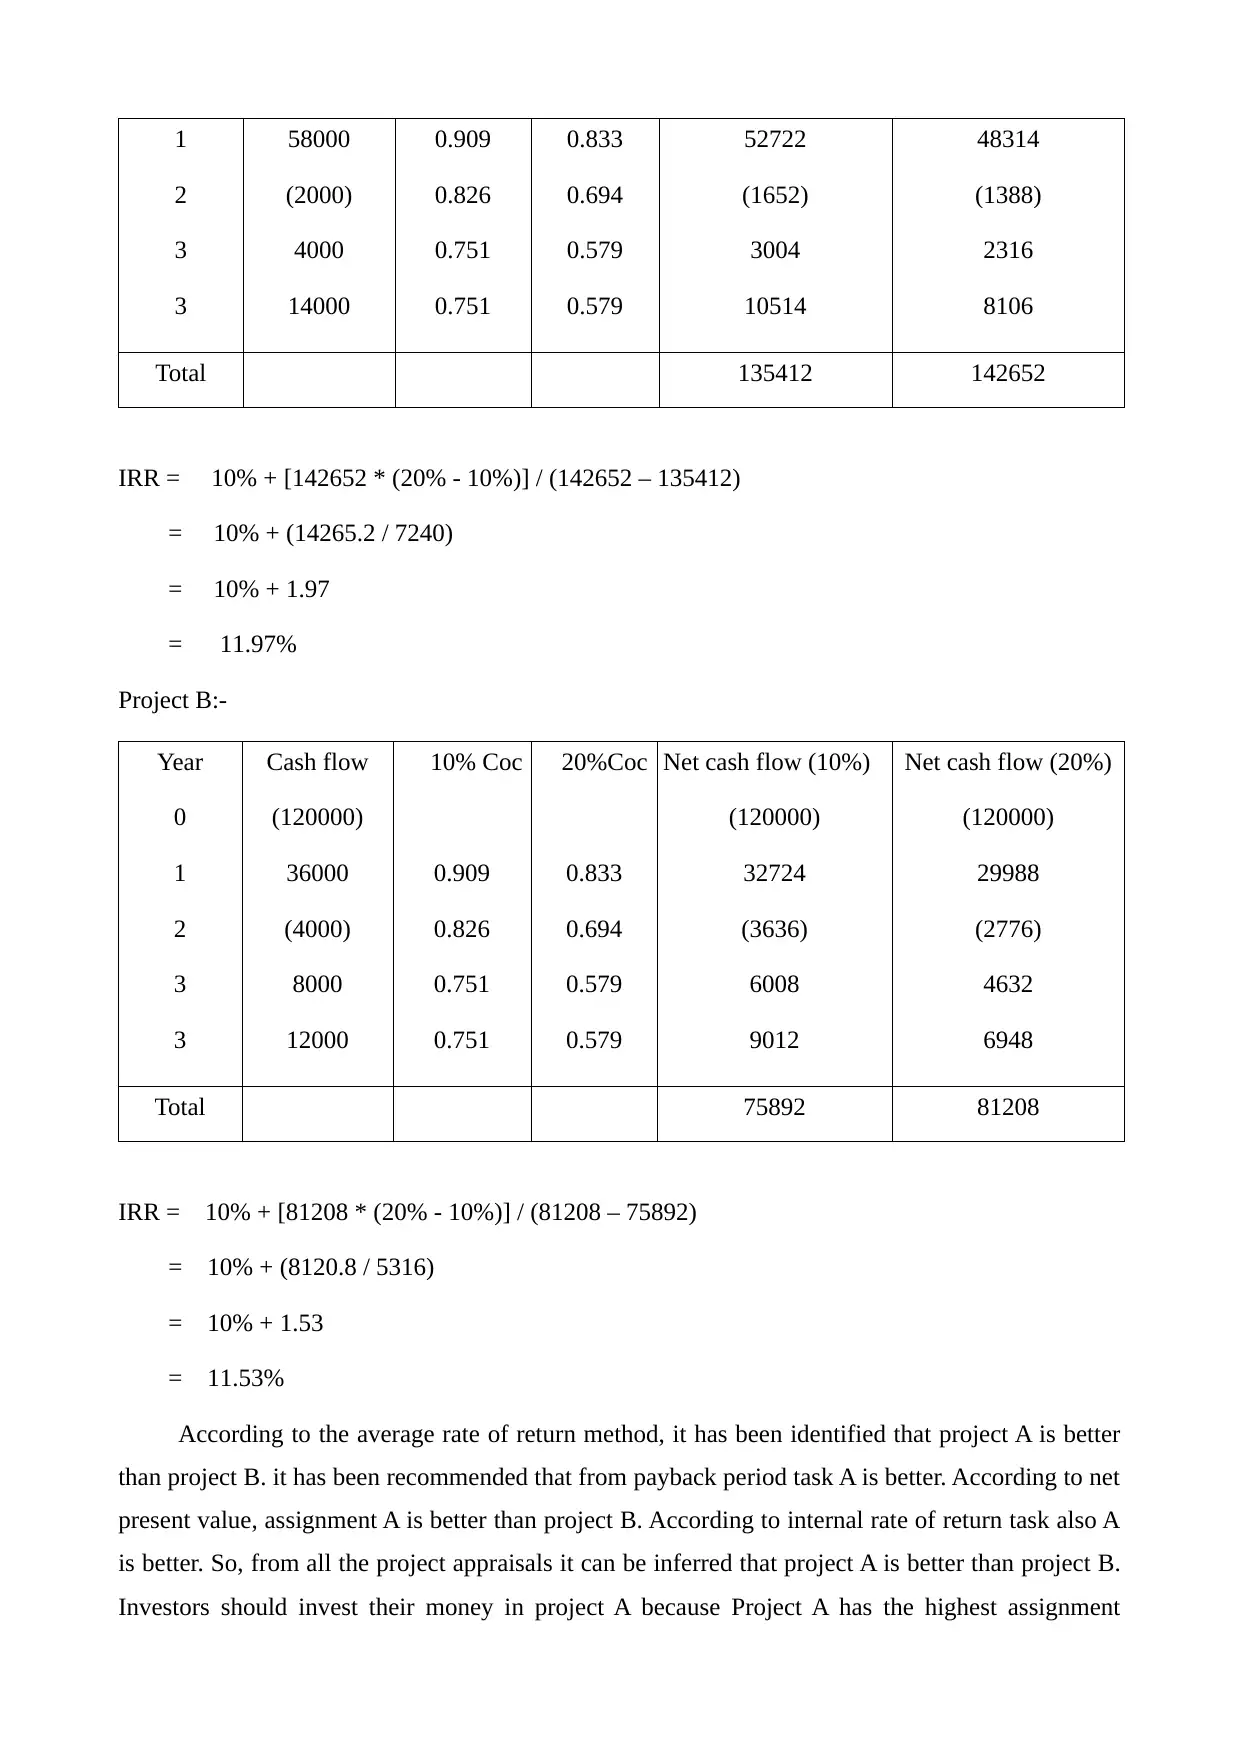
1
2
3
3
58000
(2000)
4000
14000
0.909
0.826
0.751
0.751
0.833
0.694
0.579
0.579
52722
(1652)
3004
10514
48314
(1388)
2316
8106
Total 135412 142652
IRR = 10% + [142652 * (20% - 10%)] / (142652 – 135412)
= 10% + (14265.2 / 7240)
= 10% + 1.97
= 11.97%
Project B:-
Year
0
1
2
3
3
Cash flow
(120000)
36000
(4000)
8000
12000
10% Coc
0.909
0.826
0.751
0.751
20%Coc
0.833
0.694
0.579
0.579
Net cash flow (10%)
(120000)
32724
(3636)
6008
9012
Net cash flow (20%)
(120000)
29988
(2776)
4632
6948
Total 75892 81208
IRR = 10% + [81208 * (20% - 10%)] / (81208 – 75892)
= 10% + (8120.8 / 5316)
= 10% + 1.53
= 11.53%
According to the average rate of return method, it has been identified that project A is better
than project B. it has been recommended that from payback period task A is better. According to net
present value, assignment A is better than project B. According to internal rate of return task also A
is better. So, from all the project appraisals it can be inferred that project A is better than project B.
Investors should invest their money in project A because Project A has the highest assignment
2
3
3
58000
(2000)
4000
14000
0.909
0.826
0.751
0.751
0.833
0.694
0.579
0.579
52722
(1652)
3004
10514
48314
(1388)
2316
8106
Total 135412 142652
IRR = 10% + [142652 * (20% - 10%)] / (142652 – 135412)
= 10% + (14265.2 / 7240)
= 10% + 1.97
= 11.97%
Project B:-
Year
0
1
2
3
3
Cash flow
(120000)
36000
(4000)
8000
12000
10% Coc
0.909
0.826
0.751
0.751
20%Coc
0.833
0.694
0.579
0.579
Net cash flow (10%)
(120000)
32724
(3636)
6008
9012
Net cash flow (20%)
(120000)
29988
(2776)
4632
6948
Total 75892 81208
IRR = 10% + [81208 * (20% - 10%)] / (81208 – 75892)
= 10% + (8120.8 / 5316)
= 10% + 1.53
= 11.53%
According to the average rate of return method, it has been identified that project A is better
than project B. it has been recommended that from payback period task A is better. According to net
present value, assignment A is better than project B. According to internal rate of return task also A
is better. So, from all the project appraisals it can be inferred that project A is better than project B.
Investors should invest their money in project A because Project A has the highest assignment
evaluation.
3.2
Project appraisal methods are used to check the project potential success and growth. These
methods are used to evaluate the appropriateness of project by considering different things such as
available funds.
Net Present Value (NPV):- It is determined by the discounting cost of capital, annual cash
flow and the deduction of initial outlay. It is used in capital budgeting for analyzing the
profitability of investment. The discounted cash flow technique is used in comparison of
appraisal of investment proposals where the flow of income varies over time. Formula for
finding the NPV :-
NPV = Present value of inflow – Present value of outflow
It reflects the time value of money. It depends on the cost of capital and when discount rate
increases present value will decline.
Payback Method: - Company chooses the number of years required to recover an original
investment (Ahmed, 2010). It ignores the cash flow after the payback period and does not
include the timing of cash flow. Formula :-
Payback period = Initial Investment / Net annual cash inflow
Internal Rate of return (IRR):- This method equates the net present value to zero. Use of
IRR may does not lead in maximization of the shareholders wealth. If the IRR of a new
project exceeds the required rate of return, then the project is accepted (Ahmad and Hassan,
2009). If IRR falls below the required rate of return, then the project should be rejected.
Average rate of return (ARR):- Average profit earned by the investment as compared with
the average value of investment. ARR does not consider the time value of money and cash
flows which is an important part of maintaining a business. Formula for finding the ARR is
ARR = Average profit / Average value *100
According to the average rate of return method, shareholders can access the performance of the
company. It is not based on cash flow and does not include the time value of money.
3.3
The term inflation refers to the increase in level of goods and services in the economy. It
creates many uncertainties because of the increment in price of input, output and the other factors of
production (Xiang and Worthington, 2015). While evaluating the projects under inflationary
⊘ This is a preview!⊘
Do you want full access?
Subscribe today to unlock all pages.
Trusted by 1+ million students worldwide
1 out of 15
Related Documents


Your All-in-One AI-Powered Toolkit for Academic Success.
+13062052269
info@desklib.com
Available 24*7 on WhatsApp / Email
![[object Object]](/_next/static/media/star-bottom.7253800d.svg)
Unlock your academic potential
Copyright © 2020–2026 A2Z Services. All Rights Reserved. Developed and managed by ZUCOL.