Financial Statistics Report: Descriptive Statistics and Analysis

Verified

Added on  2023/01/23

|16
|2280
|65
Report
AI Summary
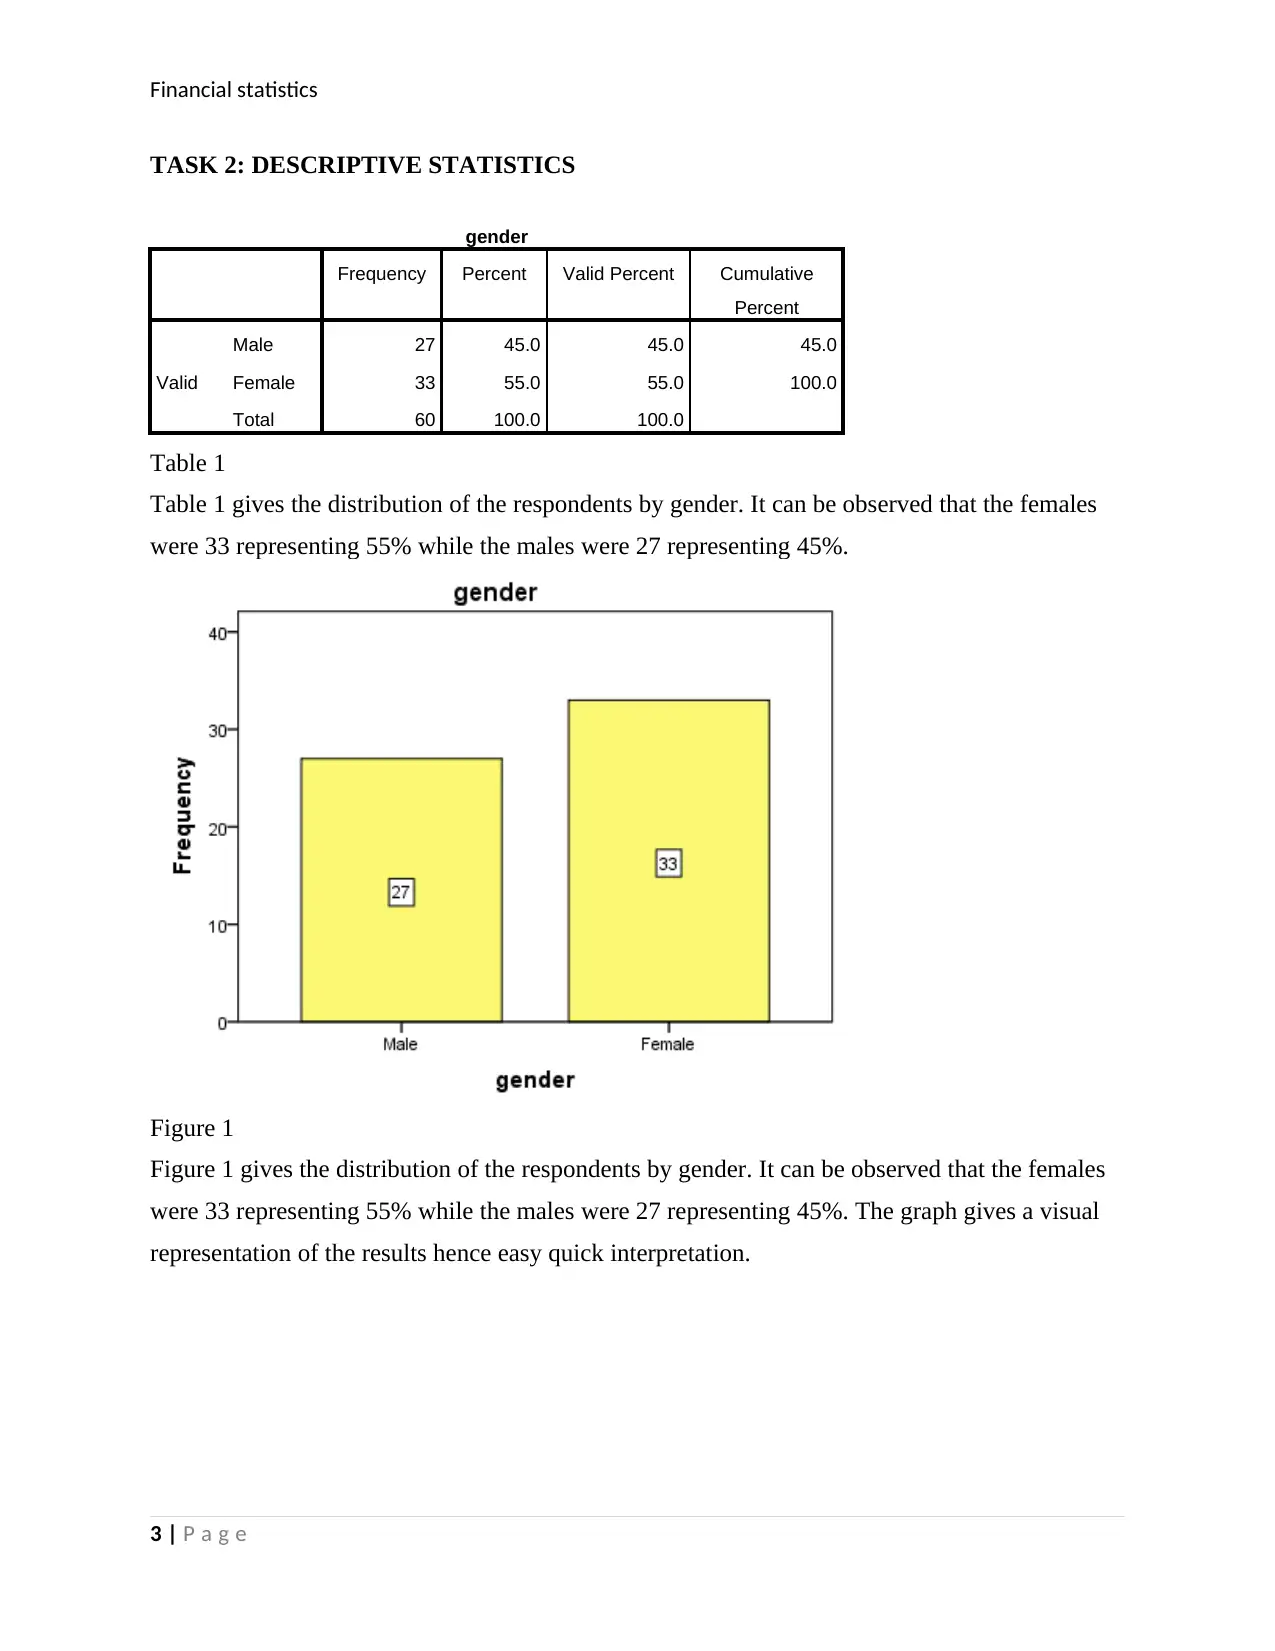
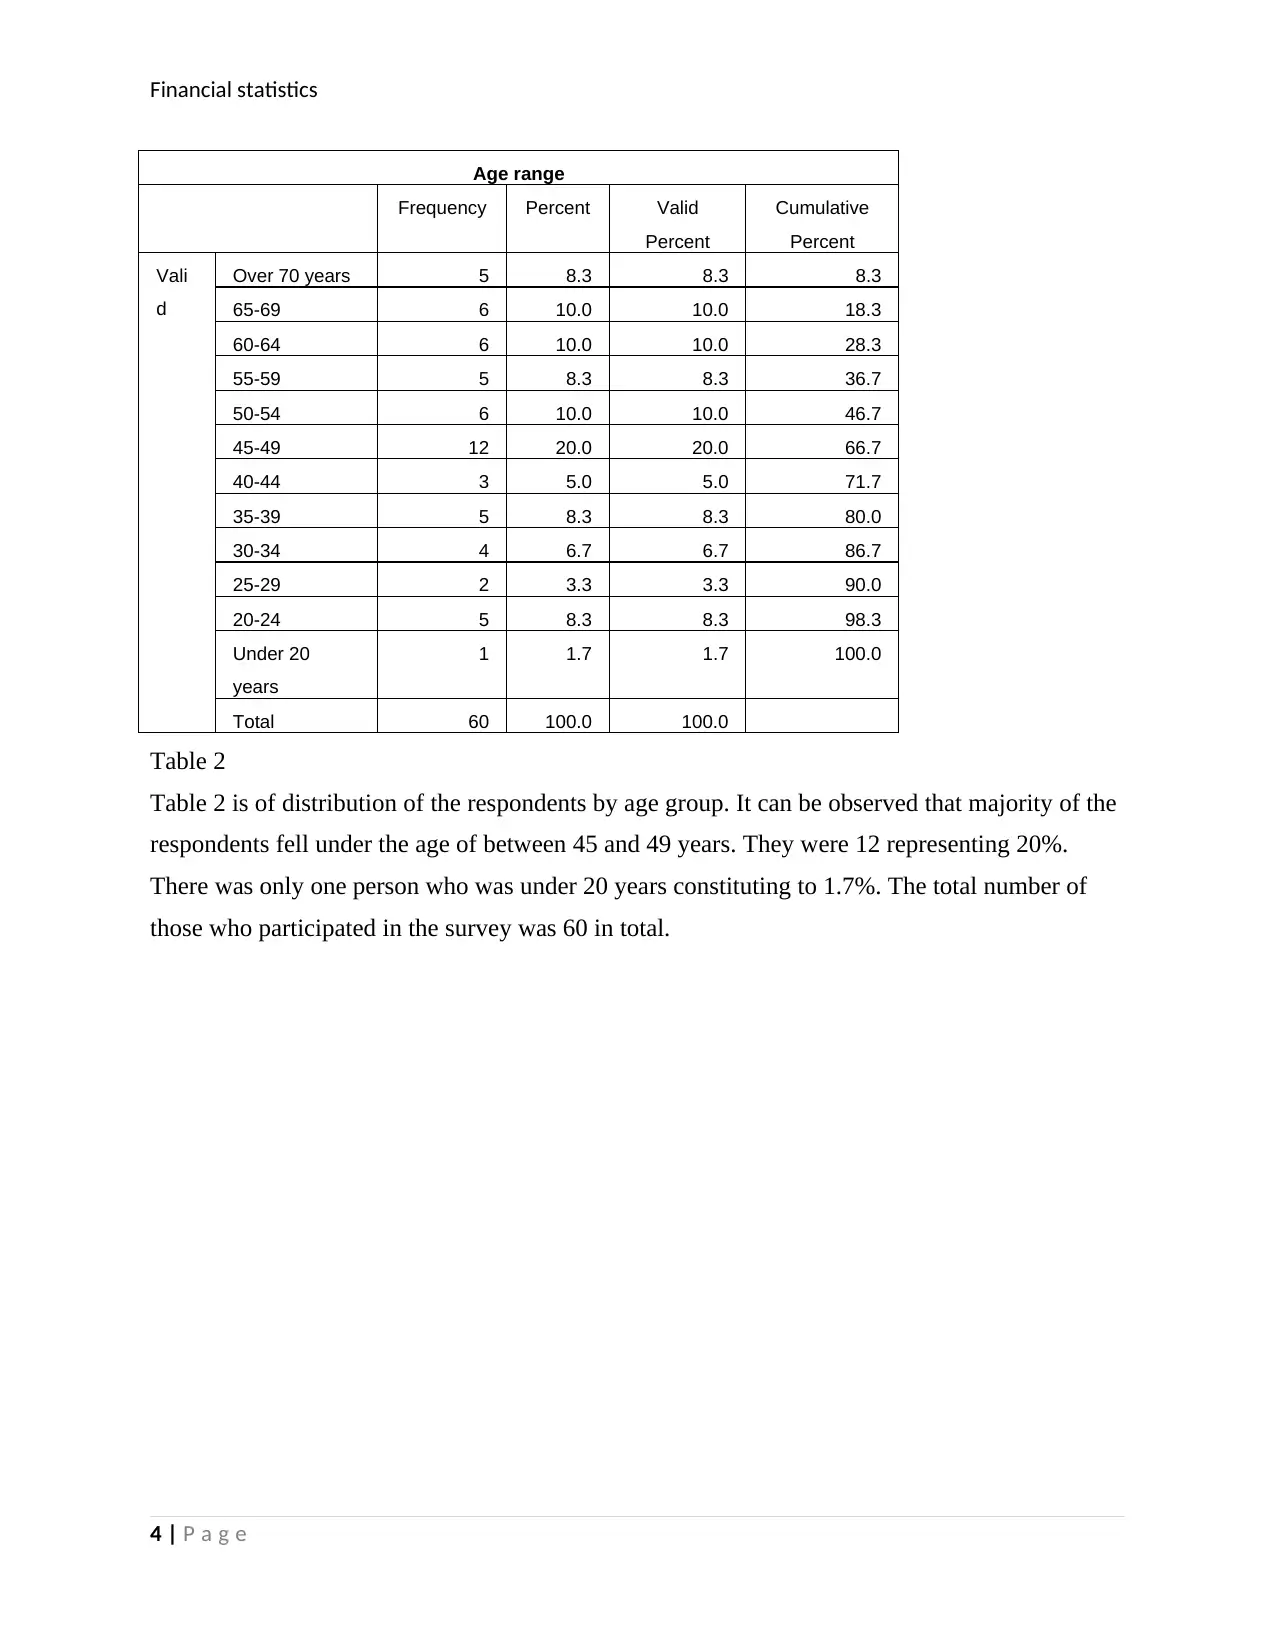
This report presents a comprehensive analysis of financial statistics, examining the relationship between variables such as age, gender, and occupation with income levels. The study utilized questionnaire data and simple random sampling to collect information, followed by the computation of descriptive statistics like mean, median, standard deviation, and variance. The findings, presented in tables and graphs, reveal the distribution of respondents by gender, age, and occupation. The report further delves into confidence intervals for total mean income and work-related deductions, followed by hypothesis testing to determine significant differences in income between various groups. Finally, the report explores correlation and regression models, including a scatterplot and a regression equation, to assess the relationship between taxable income and age range. The report concludes with a summary of key findings and insights.
Document Page
Financial statistics
Student name:
Tutor name:
1 | P a g e
tabler-icon-diamond-filled.svg

Paraphrase This Document

Need a fresh take? Get an instant paraphrase of this document with our AI Paraphraser
Document Page
Financial statistics
Executive summary
This business study was conducted in order to find out the relationship between variables and
how independent variables such as age, gender and occupation affected income level. The
research also sought to answer various hypotheses. For example, was there significant
relationship between age group and amount of income? The method of data collection that was
used in this study was through the use of questionnaire. Sampling was done through simple
random sampling since it was easier and took less time. Some of the statistics computed were
measures of central tendencies like mean and median. Measures of spread such as standard
deviation and variance were determined. The results of this research were presented in tables and
graphs. It was found that there were more female (33) than male (27). It was also found that there
was no significant difference in mean total income between technician traders and professionals.
2 | P a g e
Document Page
Financial statistics
TASK 2: DESCRIPTIVE STATISTICS
gender
Frequency Percent Valid Percent Cumulative
Percent
Valid
Male 27 45.0 45.0 45.0
Female 33 55.0 55.0 100.0
Total 60 100.0 100.0
Table 1
Table 1 gives the distribution of the respondents by gender. It can be observed that the females
were 33 representing 55% while the males were 27 representing 45%.
Figure 1
Figure 1 gives the distribution of the respondents by gender. It can be observed that the females
were 33 representing 55% while the males were 27 representing 45%. The graph gives a visual
representation of the results hence easy quick interpretation.
3 | P a g e
Document Page
Financial statistics
Age range
Frequency Percent Valid
Percent
Cumulative
Percent
Vali
d
Over 70 years 5 8.3 8.3 8.3
65-69 6 10.0 10.0 18.3
60-64 6 10.0 10.0 28.3
55-59 5 8.3 8.3 36.7
50-54 6 10.0 10.0 46.7
45-49 12 20.0 20.0 66.7
40-44 3 5.0 5.0 71.7
35-39 5 8.3 8.3 80.0
30-34 4 6.7 6.7 86.7
25-29 2 3.3 3.3 90.0
20-24 5 8.3 8.3 98.3
Under 20
years
1 1.7 1.7 100.0
Total 60 100.0 100.0
Table 2
Table 2 is of distribution of the respondents by age group. It can be observed that majority of the
respondents fell under the age of between 45 and 49 years. They were 12 representing 20%.
There was only one person who was under 20 years constituting to 1.7%. The total number of
those who participated in the survey was 60 in total.
4 | P a g e
tabler-icon-diamond-filled.svg

Paraphrase This Document

Need a fresh take? Get an instant paraphrase of this document with our AI Paraphraser
Document Page
Financial statistics
Figure 2
The figure above is a graphical representation of the distribution of the respondents by age
group. It can be observed from the bar graph that the majority of the respondents were from age
45 to 49 years.
occupation
Frequenc
y
Percent Valid
Percent
Cumulative
Percent
Vali
d
Not specified 17 28.3 28.3 28.3
Managers 3 5.0 5.0 33.3
Professionals 4 6.7 6.7 40.0
Technicians and trades
workers
5 8.3 8.3 48.3
Community and personal
service workers
6 10.0 10.0 58.3
Clerical and
administrative worker
6 10.0 10.0 68.3
Sales worker 5 8.3 8.3 76.7
Machinery operator and 6 10.0 10.0 86.7
5 | P a g e
Document Page
Financial statistics
driver
Laborers 2 3.3 3.3 90.0
Consultant, apprentices 6 10.0 10.0 100.0
Total 60 100.0 100.0
Table 3
The table above is of the distribution of the participants by their professions. There were 12
professions in total. The managers were 3, professionals were 4, technicians and traders were 5,
community and personal service workers were 6, clerical and administrative workers were 6,
sales workers were 5, machinery operators and drivers were 6, laborers were 2 while consultants
were 6.
Figure 3
The figure above is of the distribution of the participants by their professions. There were 12
professions in total. The managers were 3, professionals were 4, technicians and traders were 5,
6 | P a g e
Document Page
Financial statistics
community and personal service workers were 6, clerical and administrative workers were 6,
sales workers were 5, machinery operators and drivers were 6, laborers were 2 while consultants
were 6.
Lodgment method
Frequency Percent Valid Percent Cumulative
Percent
Valid
Agent 48 80.0 80.0 80.0
Self 12 20.0 20.0 100.0
Total 60 100.0 100.0
Table 4
Table 4 gives the distribution of the respondents by lodgment method. It can be observed that the
agents were 48 representing 80% while the self were 12 representing 20%.
Figure 4
Figure 4 gives the distribution of the respondents by lodgment method. It can be observed that
the agents were 48 representing 80% while the self were 12 representing 20%.
7 | P a g e
tabler-icon-diamond-filled.svg

Paraphrase This Document

Need a fresh take? Get an instant paraphrase of this document with our AI Paraphraser
Document Page
Financial statistics
DESCRIPTIVE STATISTICS
Statistics
Total income Work related
deductions
Taxable
income
N Valid 60 40 60
Missin
g
0 20 0
Mean 50895.2167 1810.5250 47004.6833
Median 42593.5000 584.5000 38382.0000
Std. Deviation 43377.58263 3329.62512 41499.93931
Variance 1881614674.
6
11086403.43
5
1722244962.
864
Minimum 1.00 117.00 1.00
Maximum 193302.00 14756.00 193299.00
Table 5
Table 5 above is of the descriptive statistics of total income, work related deductions and taxable
income. It can be observed that the mean taxable income was 47,004.68 dollars. The median
taxable income was 38,382.00 dollars. The highest taxable income was 193299 dollars while the
lowest taxable income was 1 dollar. The mean total income was 50895.21 dollars. The median
total income was 42,593.5 dollars. The highest total income was 193302 dollars while the lowest
total income was 1 dollar. The mean work related deduction was 1810.52 dollars. The median
work related deduction was 584.5 dollars. The highest work related deduction was 14756 dollars
while the lowest total income was 117 dollar.
8 | P a g e
Document Page
Financial statistics
Graph of total income
Figure 5
Graph of work related deductions
Figure 6
9 | P a g e
Document Page
Financial statistics
Graph of taxable income
Figure 7
TASK 3: CONFIDENCE INTERVALS
95% confidence interval for total mean income
Total income amount
Mean 56732.4375
Median 47663.5
Standard Deviation
45538.6782
9
Sample Variance 2073771220
Count 48
Confidence Level
(95.0%) 13223.0538
Table 6
The table above shows the 95% confidence interval for the mean total income. It can be observed
that the mean lies between 56,732.44 ± 13,223.05 dollars. This means that we are 95% confident
that the populations mean lies in the range 56,732.44 ± 13,223.05.
10 | P a g e
tabler-icon-diamond-filled.svg

Paraphrase This Document

Need a fresh take? Get an instant paraphrase of this document with our AI Paraphraser
Document Page
Financial statistics
95% confidence interval mean work related deductions
Work related deductions
Mean 1207.01666
7
Median 281.5
Standard Deviation 2840.61467
1
Sample Variance 8069091.71
2
Count 60
Confidence Level
(95.0%)
733.808581
2
Table 7
The table above shows the 95% confidence interval for the mean work related deductions. It can
be observed that the mean lies between 1,207.02 ± 733.8 dollars. This means that we are 95%
confident that the populations mean lies in the range 1,207.02 ± 733.8.
Population means
Population total mean income for agents = $ 57,233
Population mean work related deductions = $ 1,195
Comparing the population means with the confidence interval computed, it can be concluded that
the population mean is within the 95% confidence interval.
TASK 4: HYPOTHESIS TESTING
a. Test for the difference in means of total income between professionals and
technicians and trade workers.
H0: There is no significant difference in total income between professionals and technicians and
trade workers.
Versus
H1: There is a significant difference in total income between professionals and technicians and
trade workers.
The level of significance is 0.05
11 | P a g e
Document Page
Financial statistics
Independent sample t-test is appropriate in this case since we are comparing the means of two
independent variables.
Results table
Independent Samples Test
Levene's Test
for Equality of
Variances
t-test for Equality of Means
F Sig. t df Sig. (2-
tailed)
Mean
Difference
Std. Error
Difference
95% Confidence
Interval of the
Difference
Lower Upper
Total
income
Equal variances
assumed
.648 .447 -.554 7 .597 -
13911.8500
0
25120.1383
0
-
73311.5382
3
45487.838
23
Equal variances
not assumed
-.584 6.754 .578 -
13911.8500
0
23801.5705
9
-
70611.6479
9
42787.947
99
Table 8
Table 8 above shows the results of the independent sample t-test. Comparing the p-value and the
level of significance, it can be observed that p-value computed (0.45) is greater than the level of
significance (0.05). This leads to a decision of not rejecting the null hypothesis. The conclusion
is that there is no significant difference in total income between professionals and technicians
and trade workers.
b. Test for the difference in means of total income between professionals and
technicians and trade workers.
H0: There is no significant difference in taxable income between male and females.
Versus
H1: There is a significant difference in taxable income between male and females.
The level of significance is 0.05
Independent sample t-test is appropriate in this case since we are comparing the means of two
independent variables.
12 | P a g e
chevron_up_icon
1 out of 16
circle_padding
hide_on_mobile
zoom_out_icon
[object Object]