University Financial Statistics Homework: Household Data Analysis
VerifiedAdded on 2022/12/29
|10
|1354
|65
Homework Assignment
AI Summary
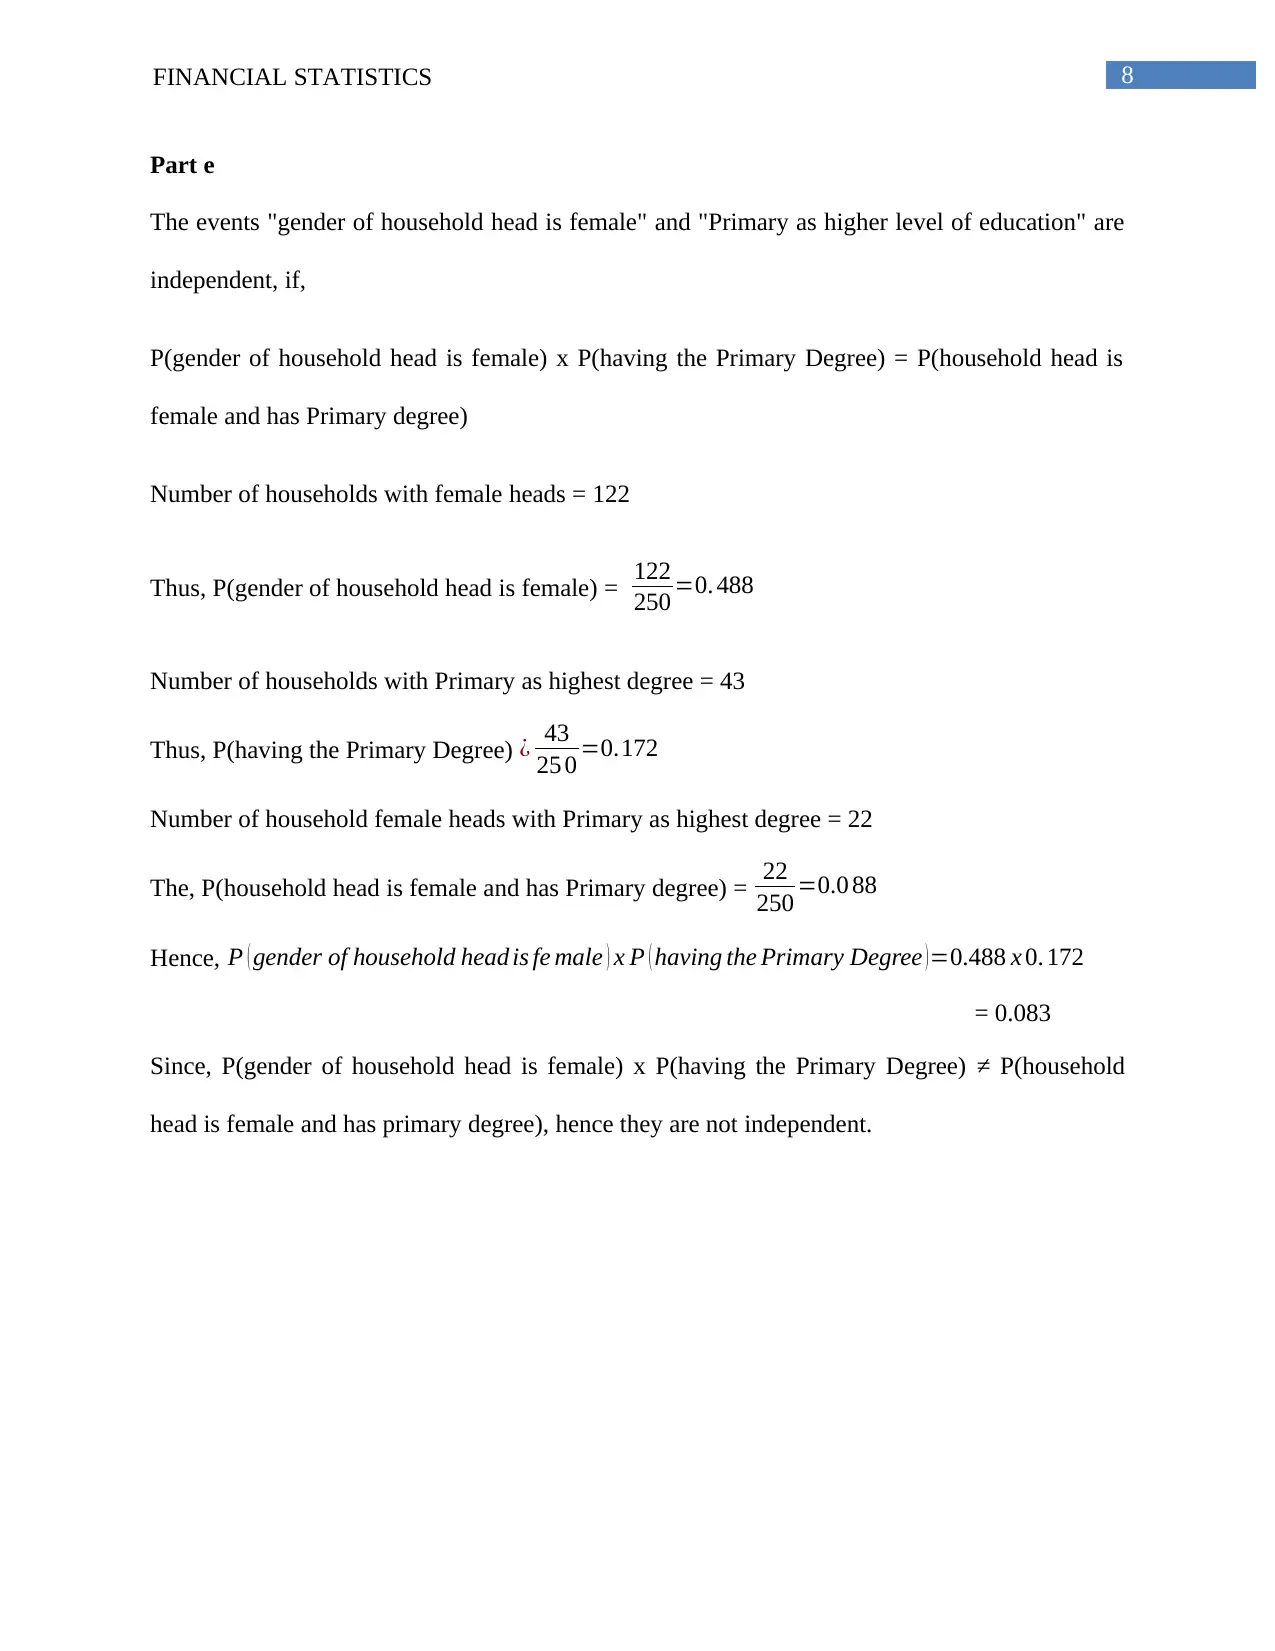
This financial statistics assignment analyzes a dataset of 250 households, examining expenditures on alcohol, meals, fuel, and phone, alongside income data. The assignment begins with descriptive statistics, including mean, standard deviation, and box-whisker plots, revealing the distribution of expenditures and their skewness. It then delves into income analysis, comparing the top and bottom 10% of earners, and calculates the proportion of households owning a house. Regression analysis is performed to explore the relationship between total expenditures and after-tax income, determining the correlation coefficient. Finally, the assignment investigates the relationship between gender, education level, and their probabilities, including the determination of independence between these variables. The analysis employs techniques such as contingency tables and probability calculations to derive meaningful insights from the household data.
1 out of 10
Related Documents


Your All-in-One AI-Powered Toolkit for Academic Success.
+13062052269
info@desklib.com
Available 24*7 on WhatsApp / Email
![[object Object]](/_next/static/media/star-bottom.7253800d.svg)
Copyright © 2020–2026 A2Z Services. All Rights Reserved. Developed and managed by ZUCOL.