FIN10002 Financial Statistics Report: Movie Download Analysis
VerifiedAdded on  2023/06/04
|18
|1986
|65
Report
AI Summary
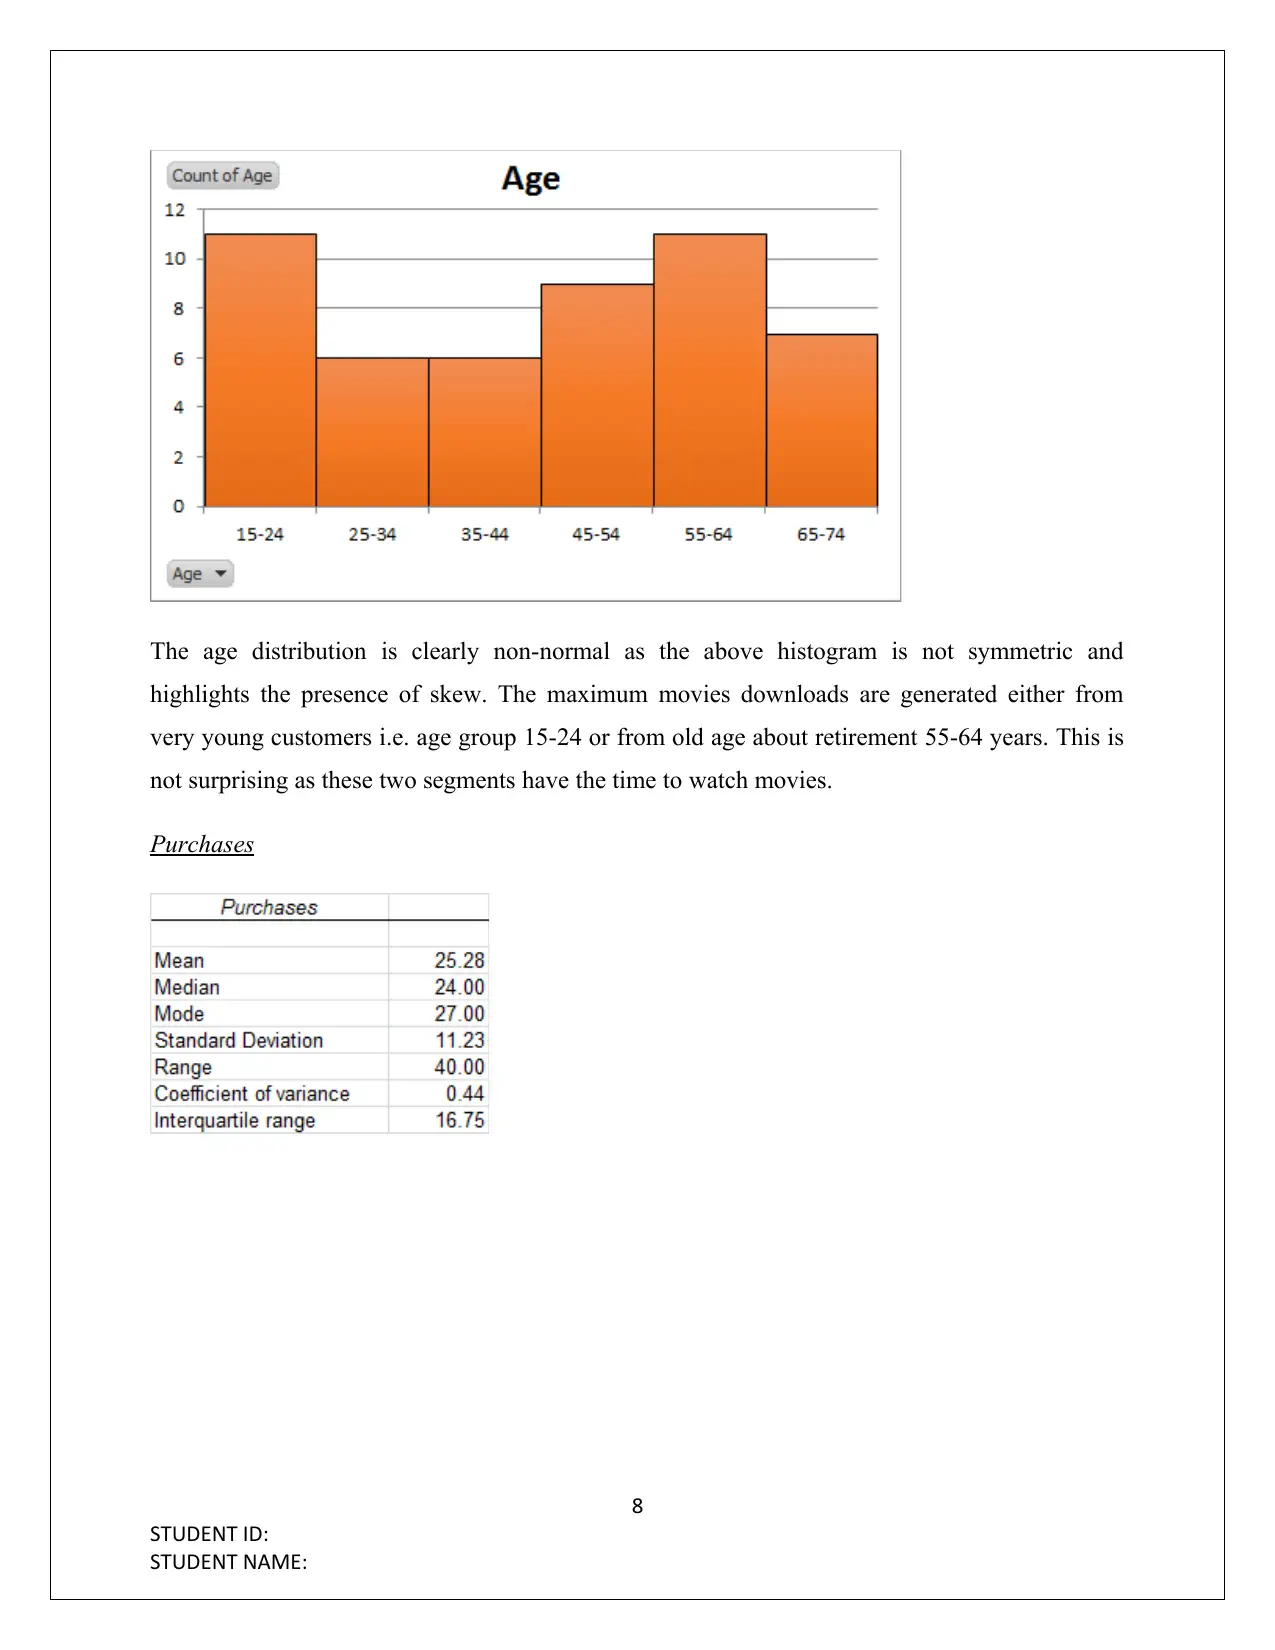
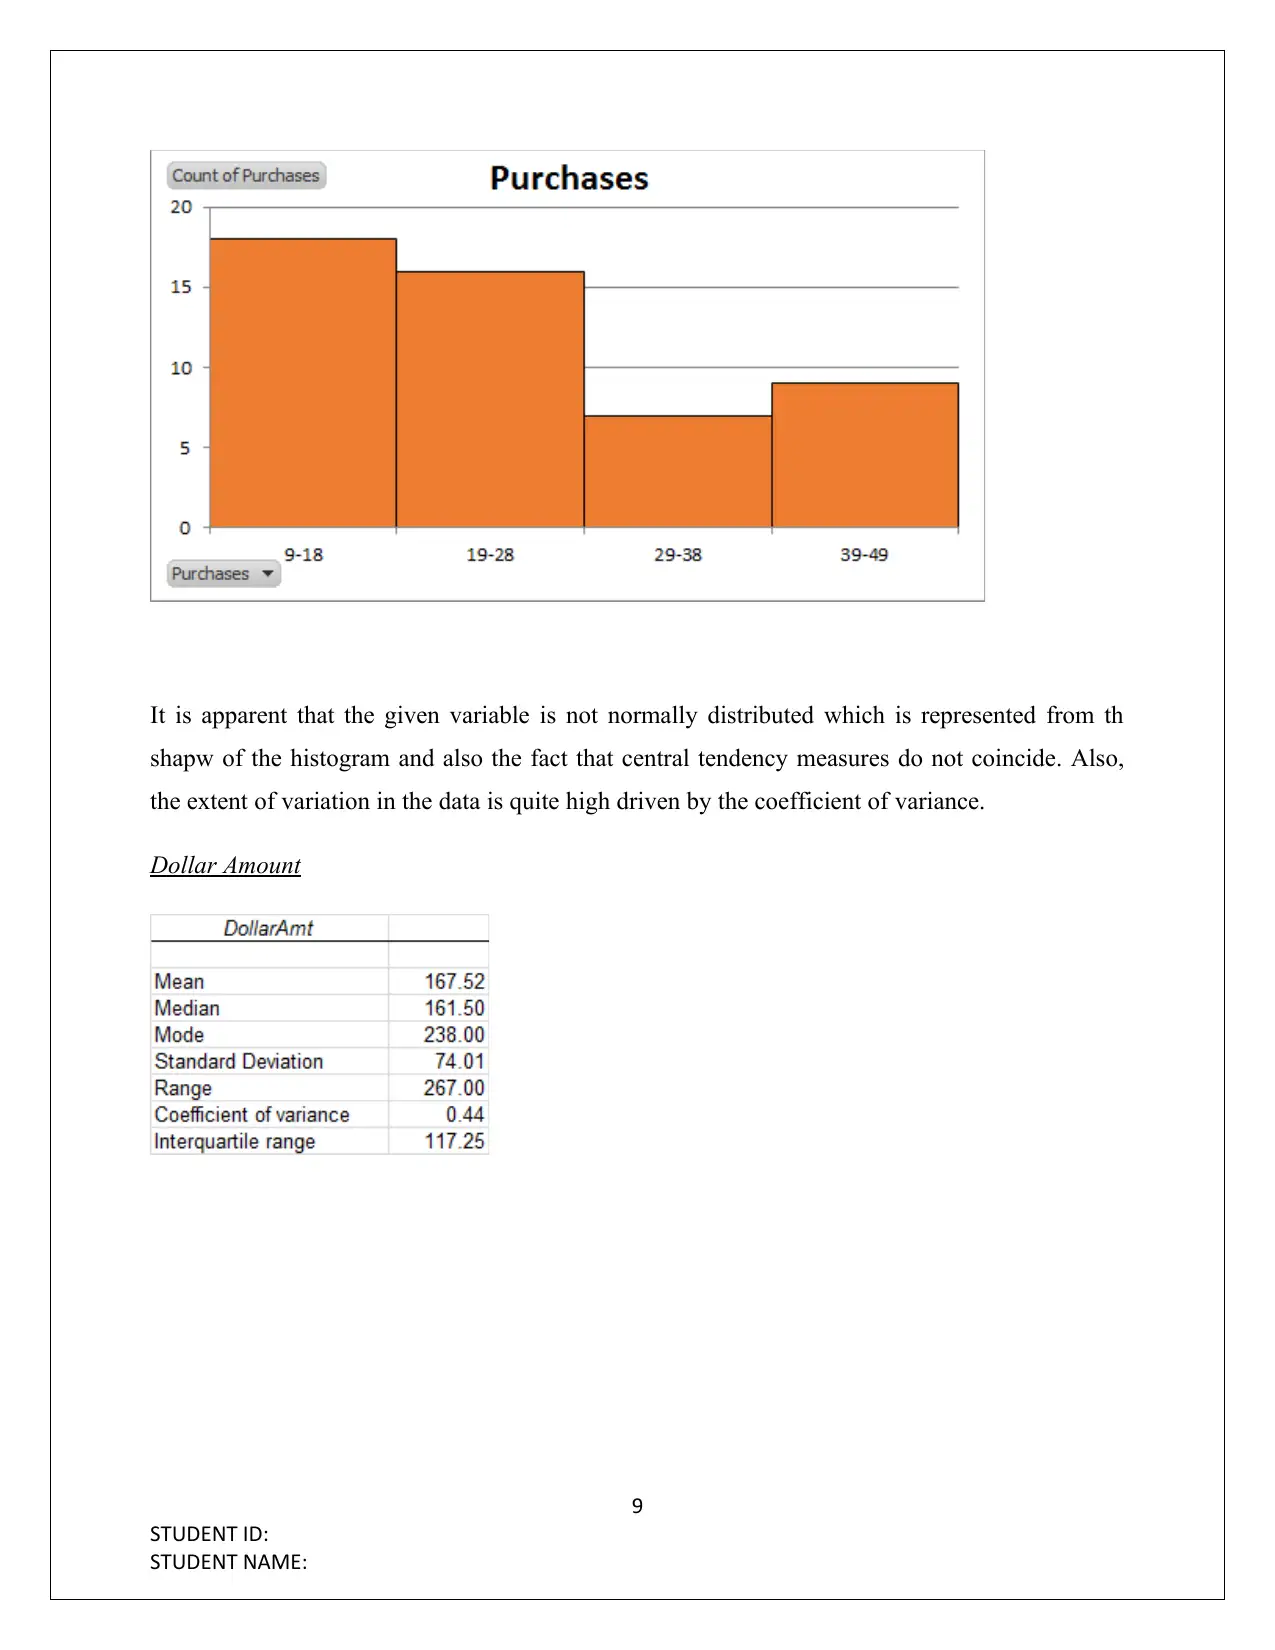
This report presents a statistical analysis of movie download data from an internet website. A random sample of 50 customers was drawn from a population of 4815. The analysis includes descriptive statistics of variables such as state, city, gender, movie preferences, age, purchases, and dollar amounts spent. The study uses 95% confidence intervals to estimate average Sci-Fi movie purchases and average dollar amounts spent, comparing them to population means. Hypothesis tests were conducted to assess claims regarding spending habits based on movie genre and gender. Additionally, correlation and regression analysis was performed to determine the influence of customer age on spending. The report concludes with a summary of findings, including the limitations of the analysis due to sample size, and suggestions for future research.

FINANCIAL STATISTICS
STUDENT ID:
[Pick the date]
STUDENT ID:
[Pick the date]
Paraphrase This Document
Need a fresh take? Get an instant paraphrase of this document with our AI Paraphraser

TABLE OF CONTENT
Executive Summary.........................................................................................................................2
Introduction......................................................................................................................................2
Task 1...............................................................................................................................................2
Task 2...............................................................................................................................................2
Task 3.............................................................................................................................................10
Task 4.............................................................................................................................................11
Task 5.............................................................................................................................................11
Task 6 (Conclusion).......................................................................................................................12
Appendix........................................................................................................................................13
1
STUDENT ID:
STUDENT NAME:

Executive Summary
The aim of the report is to highlight the results obtained by the statistical analysis of the data
provided with regards to movie downloads from an internet site. From the population data, a
random sample of 50 consumers has been drawn. Using numerical and graphical techniques, a
summary of the various variables of the sample data has been presented. Further, 95%
confidence interval has been estimated for the purchases of Sci-Fi movie as the first choice and
also the average dollar amount spent. These are then compared with actual population means.
Also, hypothesis test has been used to test the claim whether the average spend on comedy as
first choice exceeds that of drama. This claim is not supported by the sample data. Also, the other
claim regarding purchase being gender dependent also lacked supported from sample data.
Besides, age of customer is not a significant variable influencing the dollar amount spent by the
customers as determined from correlation and regression analysis.
.
Introduction
Data has been provided with regards to the type of movies that have been downloaded during a
given year from an internet website. The population data comprises of 4815 customers but based
on the specific random customers assigned to me, a sample which consists of 50 customers has
been formed. A host of statistical techniques (descriptive & inferential) have been performed on
the sample data with the objective of ascertaining the sample summary and population
characteristics. The objective of this report is to present the various findings based on the
analysis conducted.
Task 1
Based on the random sample of 50 customers allocated to my student ID, the sample data
comprising of the specified customers has been formed using the population data provided and is
illustrated in the attached appendix.
Task 2
The requisite descriptive statistics of the various variables is presented below.
2
STUDENT ID:
STUDENT NAME:
⊘ This is a preview!⊘
Do you want full access?
Subscribe today to unlock all pages.

Trusted by 1+ million students worldwide

State
The distribution of customers across the six states does not seem even owing to the highest
number of customers from a state being 11 and the lowest being 2. The maximum customers for
the internet website tend to hail from FL and CA while the minimum customers tend to belong to
IN.
City
3
STUDENT ID:
STUDENT NAME:
Paraphrase This Document
Need a fresh take? Get an instant paraphrase of this document with our AI Paraphraser

.
The representation of the city in regards to the customers shows some variation considering the
fact that New Orleans has the maximum representation at 9 customers while Orlando and
Phoenix have just 2 customers each. However, there is no major dependence for the internet
website with regards to a particular city as the customers seem to be well distributed.
Gender
4
STUDENT ID:
STUDENT NAME:

From the above, it is apparent that for the given sample, the female customers tend to be higher
than the males. Assuming that the given sample is representative of the population of 4815
customers, it is apparent that a dominant portion of the customers of the internet website tend to
be female.
First Choice
5
STUDENT ID:
STUDENT NAME:
than the males. Assuming that the given sample is representative of the population of 4815
customers, it is apparent that a dominant portion of the customers of the internet website tend to
be female.
First Choice
5
STUDENT ID:
STUDENT NAME:
⊘ This is a preview!⊘
Do you want full access?
Subscribe today to unlock all pages.

Trusted by 1+ million students worldwide

From the above, it is apparent that the distribution of first choice genre for customers seems to be
equally divided between action, comedy and Sci-Fi. The only aberration on the lower end if
drama. Assuming the sample to be representative of population, it is apparent that drama seems
to be least popular genre as the first choice.
Second Choice
6
STUDENT ID:
STUDENT NAME:
equally divided between action, comedy and Sci-Fi. The only aberration on the lower end if
drama. Assuming the sample to be representative of population, it is apparent that drama seems
to be least popular genre as the first choice.
Second Choice
6
STUDENT ID:
STUDENT NAME:
Paraphrase This Document
Need a fresh take? Get an instant paraphrase of this document with our AI Paraphraser

It is evident that a lot of customers tend to prefer drama as their second choice genre. The next in
line is comedy followed by Sci-Fi. However, the lowest share is commanded by action .
Age
7
STUDENT ID:
STUDENT NAME:
line is comedy followed by Sci-Fi. However, the lowest share is commanded by action .
Age
7
STUDENT ID:
STUDENT NAME:

The age distribution is clearly non-normal as the above histogram is not symmetric and
highlights the presence of skew. The maximum movies downloads are generated either from
very young customers i.e. age group 15-24 or from old age about retirement 55-64 years. This is
not surprising as these two segments have the time to watch movies.
Purchases
8
STUDENT ID:
STUDENT NAME:
highlights the presence of skew. The maximum movies downloads are generated either from
very young customers i.e. age group 15-24 or from old age about retirement 55-64 years. This is
not surprising as these two segments have the time to watch movies.
Purchases
8
STUDENT ID:
STUDENT NAME:
⊘ This is a preview!⊘
Do you want full access?
Subscribe today to unlock all pages.

Trusted by 1+ million students worldwide

It is apparent that the given variable is not normally distributed which is represented from th
shapw of the histogram and also the fact that central tendency measures do not coincide. Also,
the extent of variation in the data is quite high driven by the coefficient of variance.
Dollar Amount
9
STUDENT ID:
STUDENT NAME:
shapw of the histogram and also the fact that central tendency measures do not coincide. Also,
the extent of variation in the data is quite high driven by the coefficient of variance.
Dollar Amount
9
STUDENT ID:
STUDENT NAME:
Paraphrase This Document
Need a fresh take? Get an instant paraphrase of this document with our AI Paraphraser

It is apparent that the given variable is not normally distributed which is represented from th
shapw of the histogram and also the fact that central tendency measures do not coincide. Also,
the extent of variation in the data is quite high driven by the coefficient of variance.
Task 3
We are 95% confident that the average purchases for the Sci-Fi movies at the first choice would
lie between 28.65 and 39.49. The corresponding population average in this regards is 25.64.
Considering the fact that the given 95% confidence interval does not contain the actual
population mean, hence it may be concluded that the sample selected in this case does not
present a fair representation of the population of 4815 customers.
We are 95% confident that the average dollar spent by population of 4815 consumers on all types
of movies should lie between $ 147 and $ 188. The corresponding population average in this
regards is $166.71. Considering the fact that the given 95% confidence interval does contain the
actual population mean, hence it may be concluded that the sample selected in this case does
present a fair representation of the population of 4815 customers
10
STUDENT ID:
STUDENT NAME:

Task 4
Hypothesis test is a type of inferential statistical technique which is deployed for estimating the
characteristics of the population based on the given sample data. For testing of hypothesis, a null
hypothesis is there coupled with an alternative hypothesis. Then using a suitable test statistics,
the test is performed to determine if the null hypothesis can be rejected or not. The rejection of
null hypothesis leads to acceptance of alternative hypothesis.
The results of the hypothesis test (highlighted in Appendix) do not support the claim that average
money spent in the Comedy first choice is greater than average money spent in the Drama first
choice. Also, hypothesis test (highlighted in Appendix) indicates that there is no significant
difference between the average purchases for the two genders.
Task 5
The scatter plot is illustrated as highlighted below.
The above scatter plot indicates that a weak and positive relationship tends to exist between the
customer age and the dollar amount spent. A confirmation of this can also be obtained from the
correlation coefficient which is computed as 0.2549. The coefficient of determination has come
11
STUDENT ID:
STUDENT NAME:
⊘ This is a preview!⊘
Do you want full access?
Subscribe today to unlock all pages.

Trusted by 1+ million students worldwide
1 out of 18
Related Documents

Your All-in-One AI-Powered Toolkit for Academic Success.
 +13062052269
info@desklib.com
Available 24*7 on WhatsApp / Email
Unlock your academic potential
Copyright © 2020–2025 A2Z Services. All Rights Reserved. Developed and managed by ZUCOL.