Financial Data Analysis: A Report on Statistics & Regression Analysis
VerifiedAdded on 2023/06/15
|14
|2087
|314
Report
AI Summary
This report presents a comprehensive analysis of financial data using statistical methods and regression analysis. It includes calculations of sum, variance, mean, and standard deviation from expenditure data, followed by a comparison of grouped and ungrouped data. The report also covers cross-sectional and time-series data, network diagrams for project activities, correlation matrix development, and regression equation analysis. Furthermore, it calculates coefficients of variation for different business ventures and applies the high-low method for cost analysis, including variable costs, fixed costs, break-even point calculation, and margin of safety. The report concludes with a reflective learning section, highlighting the skills developed and challenges faced during the project, with references to books and journals.
MN4063QA
Paraphrase This Document
Need a fresh take? Get an instant paraphrase of this document with our AI Paraphraser
Table of Contents
PART 1........................................................................................................................................................4
Task 1..........................................................................................................................................................4
(a) Calculate the sum and variance....................................................................................................4
(b) Infer the mean and standard deviation from the data given..........................................................4
Task 2 .........................................................................................................................................................4
(a) Complete the following tables by extracting the values...............................................................4
Part (b) Give the reason of difference in mean and standard deviation of grouped and ungrouped data
and which one is more accurate? .....................................................................................................6
Part(c) Comment on the minimum amount of the consumer needs estimated to spend.....................6
Task 3..........................................................................................................................................................6
Task 4..........................................................................................................................................................7
(a) Frame a network diagram which shows the movement of forwards and backward passes of the
activities............................................................................................................................................7
..................................................................................................................................................................... 8
(b) Classify the critical path and duration of the project....................................................................9
(c) Differentiate between critical and non – critical activities............................................................9
Task 5..............................................................................................................................................10
Part (a) Develop a correlation matrix and work out the coefficients between quarterly revenues and
different variables............................................................................................................................10
Part (b) The best predictor for quarterly sales revenue could be the correlation of sales and revenue
total costs.........................................................................................................................................10
Part (c) Draw a scatter graph and show a trend line of the regression equation. .............................10
(d) Interpret the coefficient of correlation and determination..........................................................11
(e) State the equation of regression and interpret the value of intercepts.........................................11
Task 6..............................................................................................................................................11
Part (1)Calculate the coefficients of variation for business A and B................................................11
Task 7........................................................................................................................................................12
Give a reflective learning through the project..................................................................................12
By participating in above project helps me to develop several skills. It gives me the overall scenario and
gives me the instance of finance that will be beneficial for my professional career. I was so excited at the
time of doing this project because I know it will enhance my knowledge and productivity. My confidence
has increased after the completion of above presentation. The most challenging aspects that faced during
the assignment is due miscalculations of numbers. Due to such issues I faced issues in matching the
numbers. Next time my focus will be on learning of formulas that will ease the difficult numericals for
my future project.......................................................................................................................................12
PART-2.....................................................................................................................................................12
6. Interpret the above calculations...................................................................................................12
REFERENCES..........................................................................................................................................14
Books and Journals..........................................................................................................................14
⊘ This is a preview!⊘
Do you want full access?
Subscribe today to unlock all pages.
Trusted by 1+ million students worldwide
PART 1
Task 1
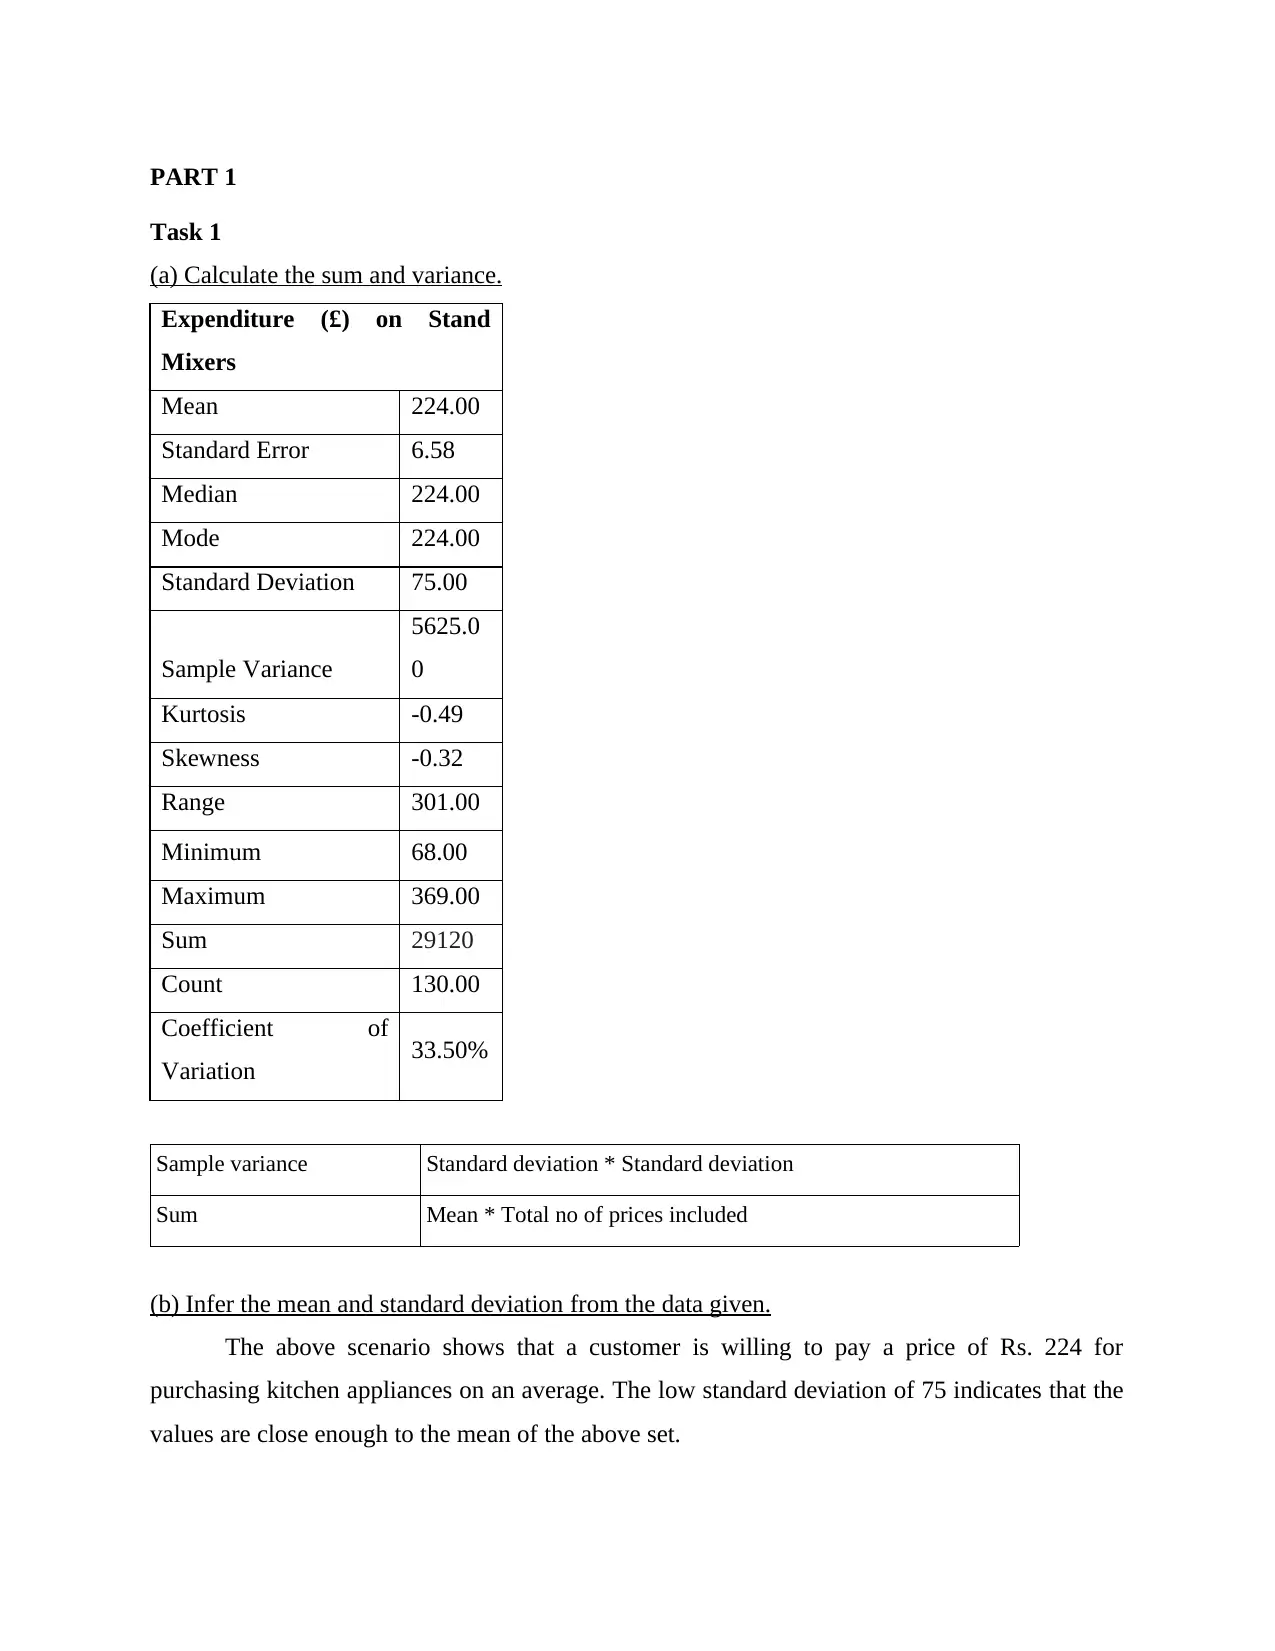
(a) Calculate the sum and variance.
Expenditure (£) on Stand
Mixers
Mean 224.00
Standard Error 6.58
Median 224.00
Mode 224.00
Standard Deviation 75.00
Sample Variance
5625.0
0
Kurtosis -0.49
Skewness -0.32
Range 301.00
Minimum 68.00
Maximum 369.00
Sum 29120
Count 130.00
Coefficient of
Variation 33.50%
Sample variance Standard deviation * Standard deviation
Sum Mean * Total no of prices included
(b) Infer the mean and standard deviation from the data given.
The above scenario shows that a customer is willing to pay a price of Rs. 224 for
purchasing kitchen appliances on an average. The low standard deviation of 75 indicates that the
values are close enough to the mean of the above set.
Task 1
(a) Calculate the sum and variance.
Expenditure (£) on Stand
Mixers
Mean 224.00
Standard Error 6.58
Median 224.00
Mode 224.00
Standard Deviation 75.00
Sample Variance
5625.0
0
Kurtosis -0.49
Skewness -0.32
Range 301.00
Minimum 68.00
Maximum 369.00
Sum 29120
Count 130.00
Coefficient of
Variation 33.50%
Sample variance Standard deviation * Standard deviation
Sum Mean * Total no of prices included
(b) Infer the mean and standard deviation from the data given.
The above scenario shows that a customer is willing to pay a price of Rs. 224 for
purchasing kitchen appliances on an average. The low standard deviation of 75 indicates that the
values are close enough to the mean of the above set.
Paraphrase This Document
Need a fresh take? Get an instant paraphrase of this document with our AI Paraphraser
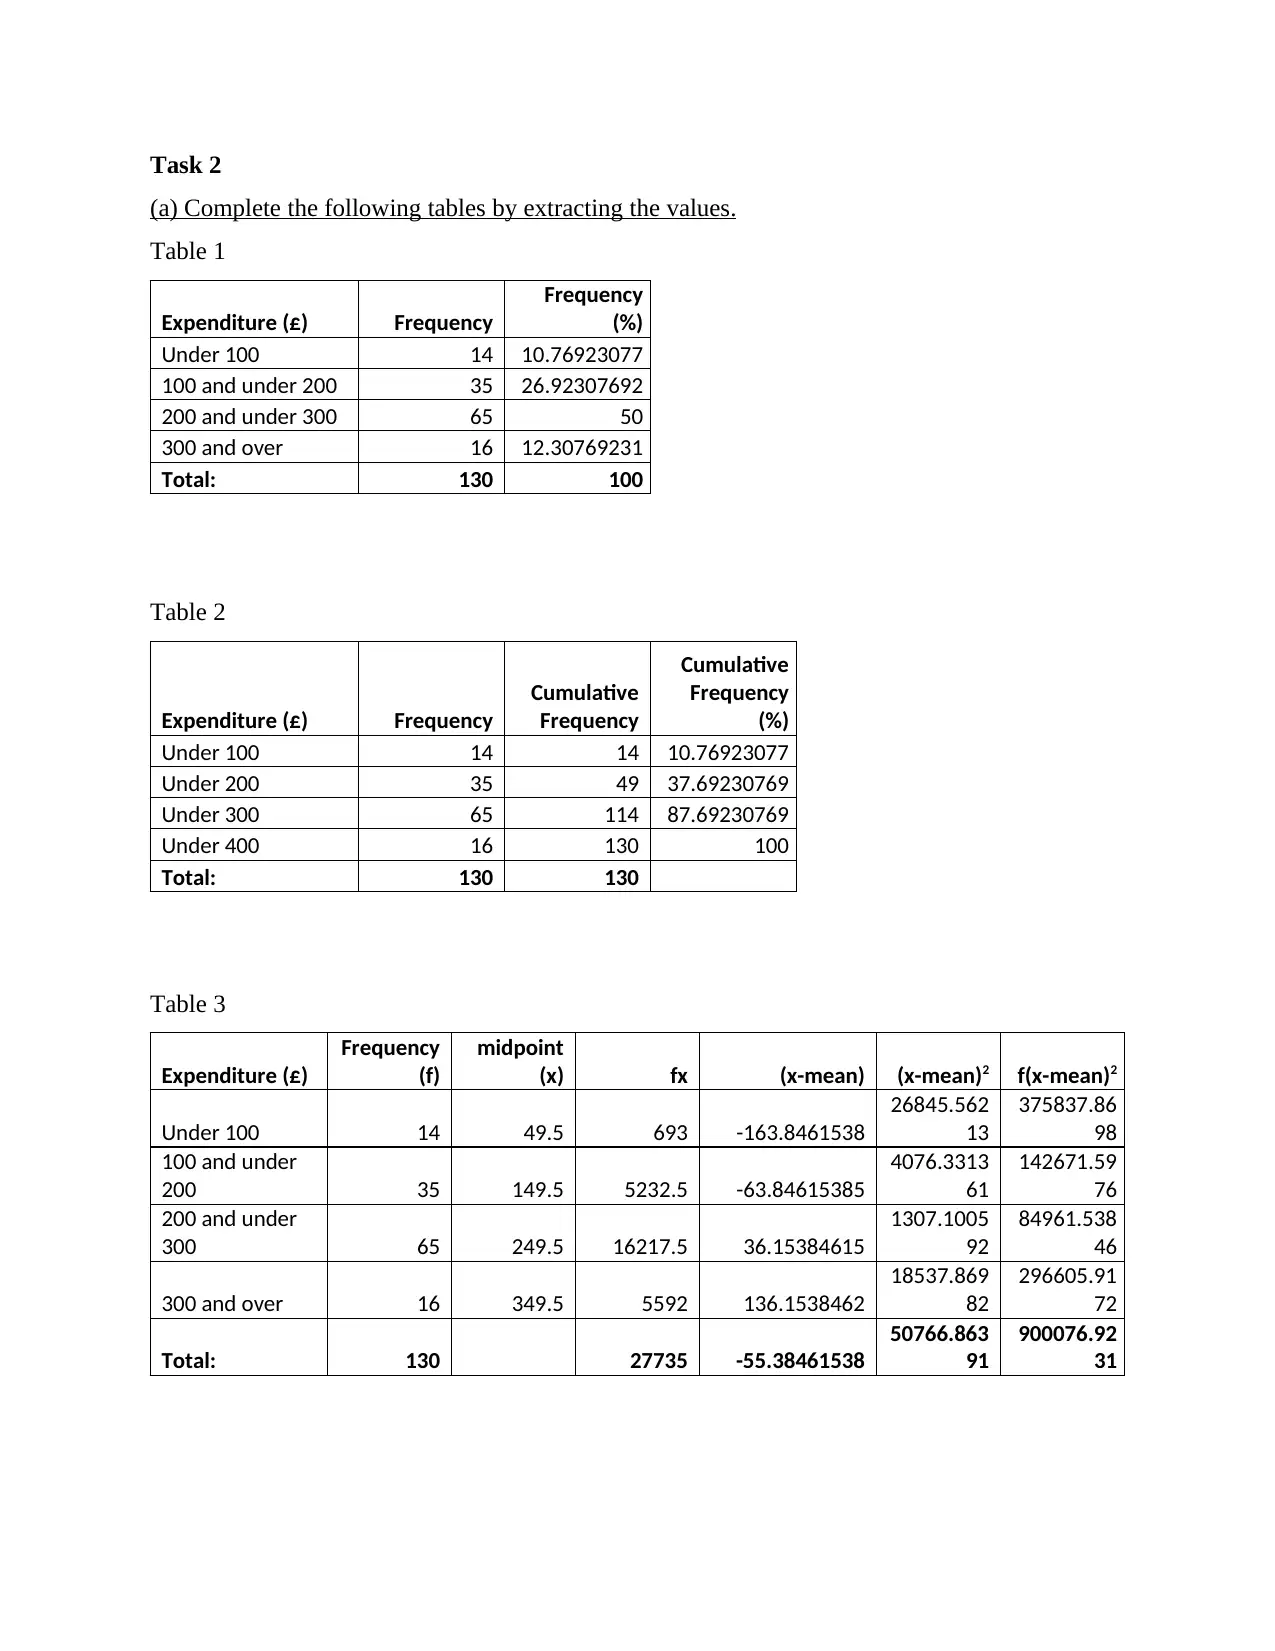
Task 2
(a) Complete the following tables by extracting the values.
Table 1
Expenditure (£) Frequency
Frequency
(%)
Under 100 14 10.76923077
100 and under 200 35 26.92307692
200 and under 300 65 50
300 and over 16 12.30769231
Total: 130 100
Table 2
Expenditure (£) Frequency
Cumulative
Frequency
Cumulative
Frequency
(%)
Under 100 14 14 10.76923077
Under 200 35 49 37.69230769
Under 300 65 114 87.69230769
Under 400 16 130 100
Total: 130 130
Table 3
Expenditure (£)
Frequency
(f)
midpoint
(x) fx (x-mean) (x-mean)2 f(x-mean)2
Under 100 14 49.5 693 -163.8461538
26845.562
13
375837.86
98
100 and under
200 35 149.5 5232.5 -63.84615385
4076.3313
61
142671.59
76
200 and under
300 65 249.5 16217.5 36.15384615
1307.1005
92
84961.538
46
300 and over 16 349.5 5592 136.1538462
18537.869
82
296605.91
72
Total: 130 27735 -55.38461538
50766.863
91
900076.92
31
Mean 213.3461538
Variance 390.5143377
Standard Deviation 19.76143562
Part (b) Give the reason of difference in mean and standard deviation of grouped and ungrouped
data and which one is more accurate?
The grouped data gives a mean and standard deviation of 224 and 75 while the
ungrouped data gives a mean and standard deviation of 213 and 19.76. The results of the
ungrouped data would be more accurate as the ungrouped data has been classified into different
categories before using in the calculation.
Part(c) Comment on the minimum amount of the consumer needs estimated to spend.
A consumer need to spend a amount of 250(approx) and above to belong to the top 25% in terms
of expenditure.
Task 3
Give the difference between the cross – sectional data and time series data with reference to the
examples considering the demographic profile and lifestyle nature of the consumers.
Cross-Sectional Data
1. This data focuses on observations of
several variables at the same point of
time.
2. For example: Sales of several
commodities in a year by a company.
Time Series Data
1. This type of data focuses on the same
variable over a period of time.
2. For example: Total sales of a
particular commodity over a period
of 3 years.
The retailer must consider the method of Cross-Sectional data as it involves collecting the data of
many variables as demographic profiles and lifestyle preferences. Hence, this method will be efficient for
the retailer in understanding its target audience.
⊘ This is a preview!⊘
Do you want full access?
Subscribe today to unlock all pages.
Trusted by 1+ million students worldwide
Task 4
(a) Frame a network diagram which shows the movement of forwards and backward passes of
the activities.
(a) Frame a network diagram which shows the movement of forwards and backward passes of
the activities.
Paraphrase This Document
Need a fresh take? Get an instant paraphrase of this document with our AI Paraphraser
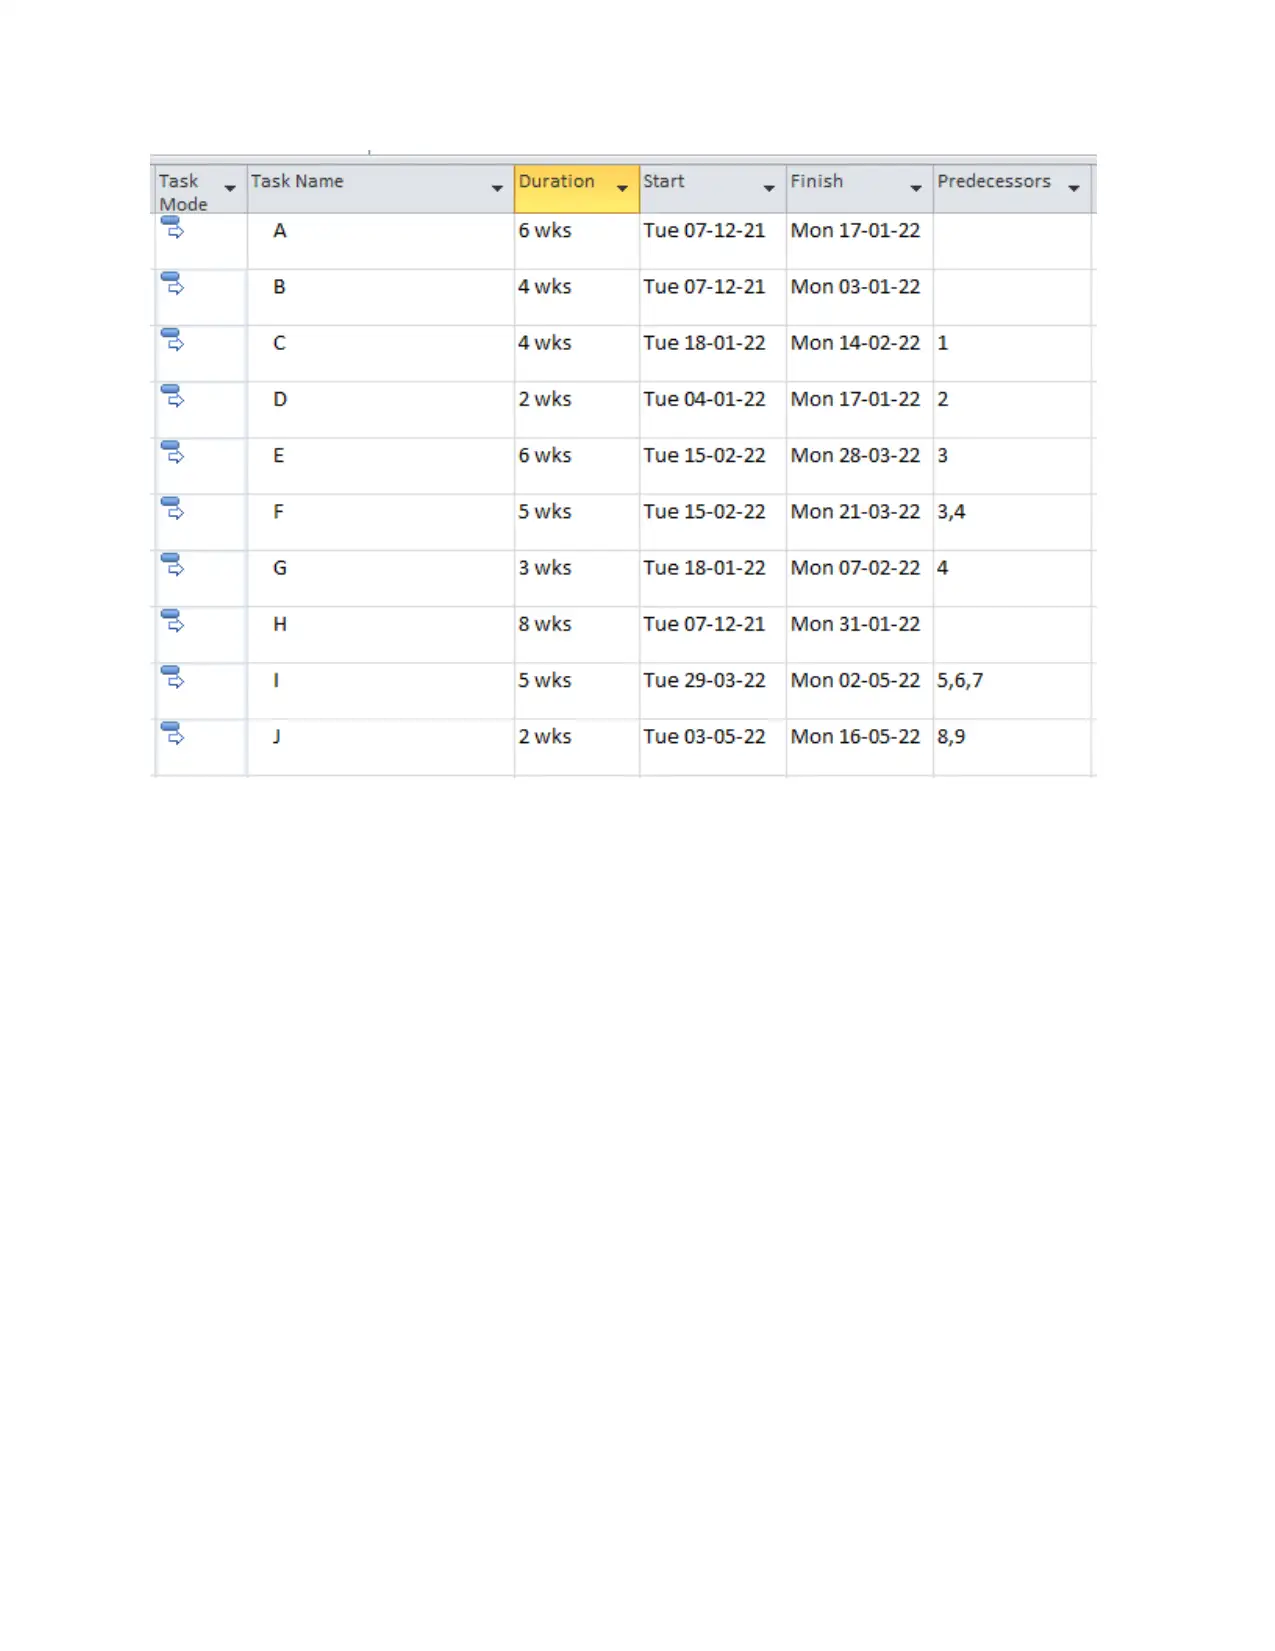
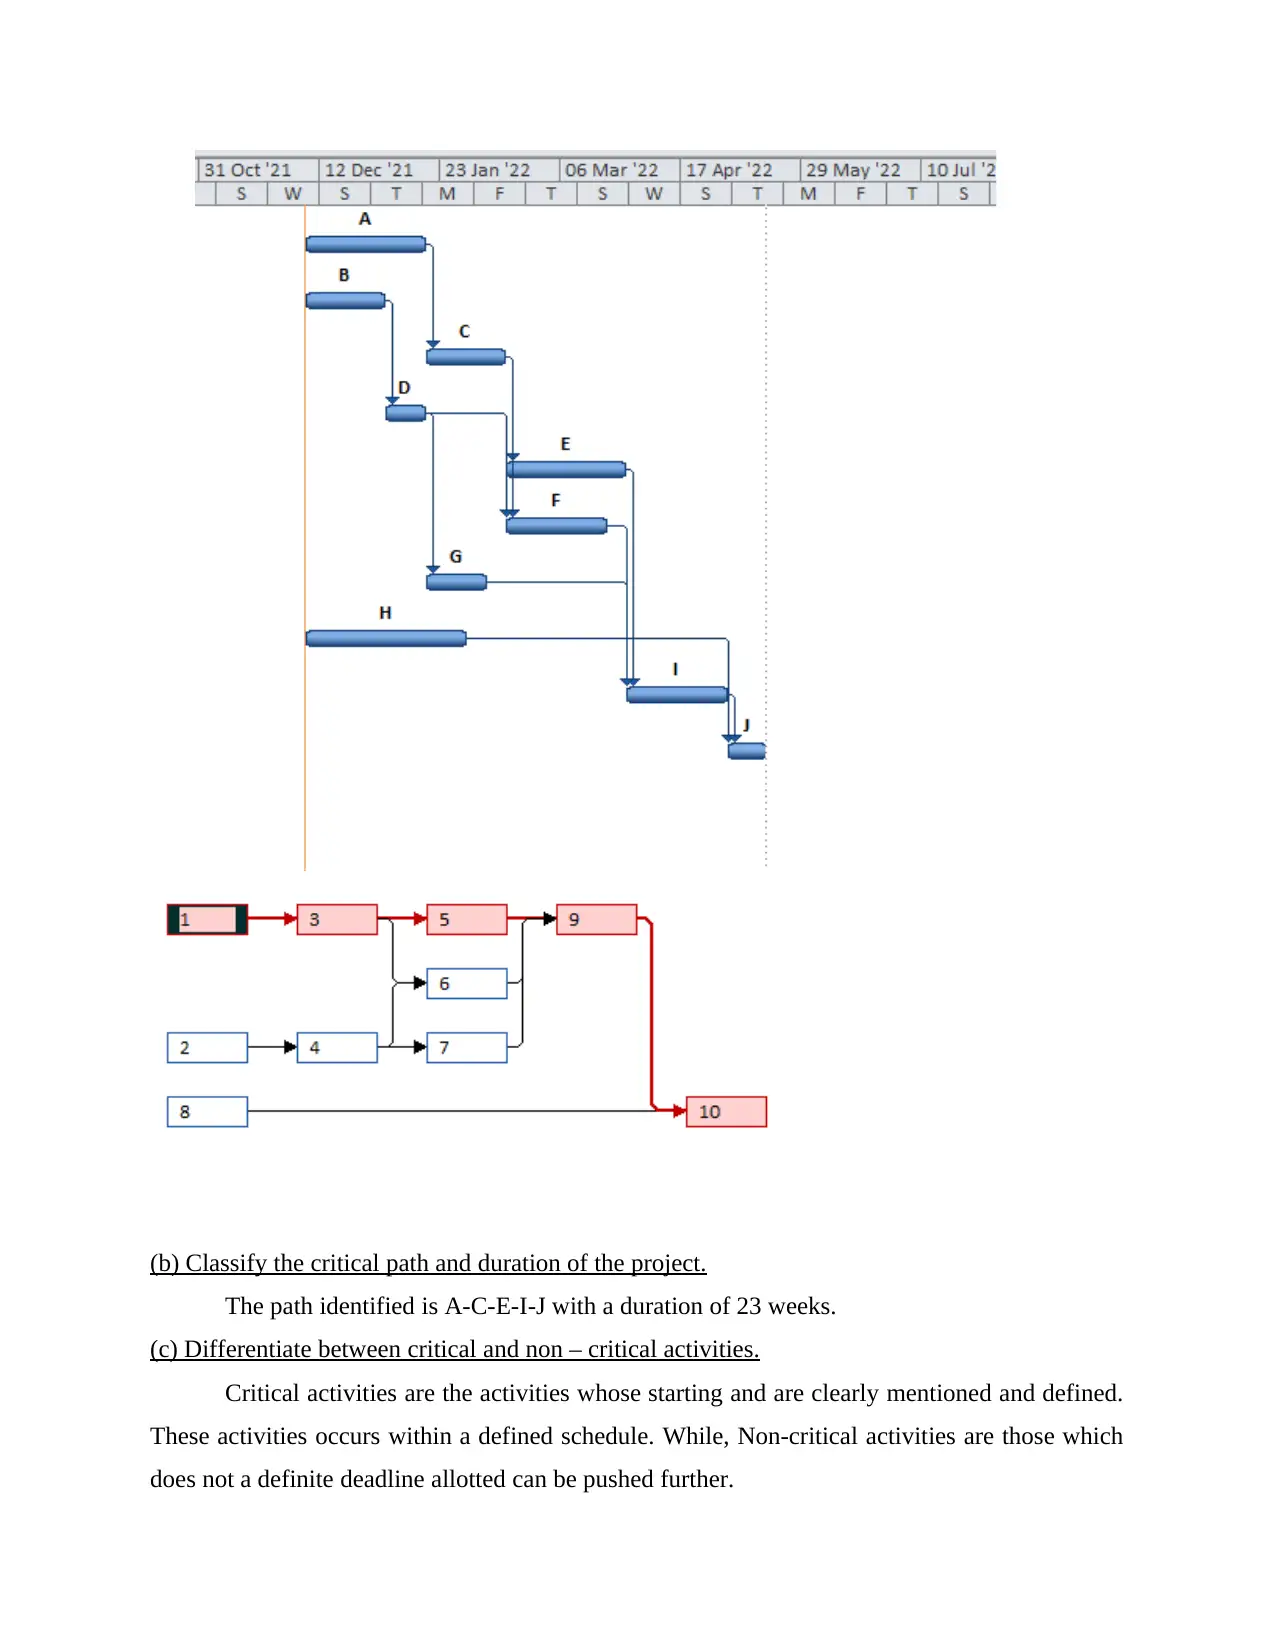
(b) Classify the critical path and duration of the project.
The path identified is A-C-E-I-J with a duration of 23 weeks.
(c) Differentiate between critical and non – critical activities.
Critical activities are the activities whose starting and are clearly mentioned and defined.
These activities occurs within a defined schedule. While, Non-critical activities are those which
does not a definite deadline allotted can be pushed further.
⊘ This is a preview!⊘
Do you want full access?
Subscribe today to unlock all pages.
Trusted by 1+ million students worldwide
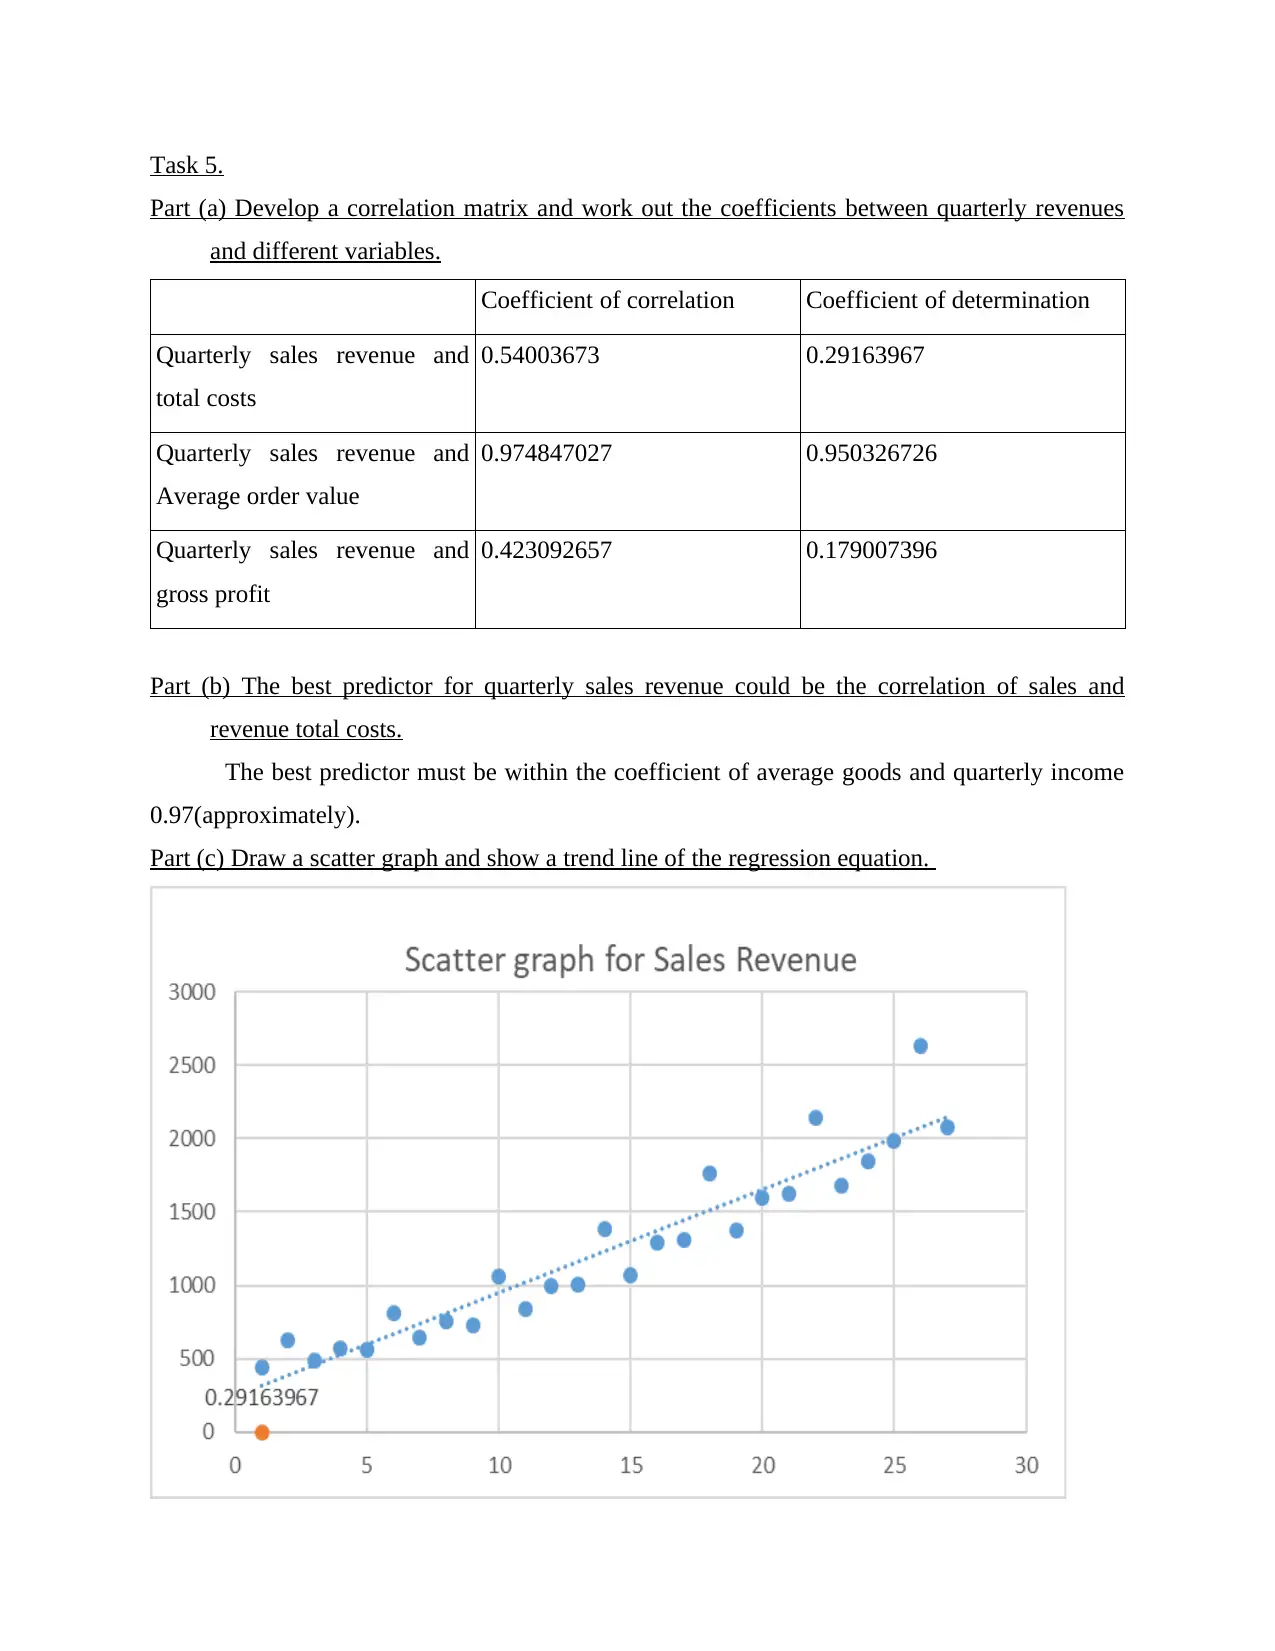
Task 5.
Part (a) Develop a correlation matrix and work out the coefficients between quarterly revenues
and different variables.
Coefficient of correlation Coefficient of determination
Quarterly sales revenue and
total costs
0.54003673 0.29163967
Quarterly sales revenue and
Average order value
0.974847027 0.950326726
Quarterly sales revenue and
gross profit
0.423092657 0.179007396
Part (b) The best predictor for quarterly sales revenue could be the correlation of sales and
revenue total costs.
The best predictor must be within the coefficient of average goods and quarterly income
0.97(approximately).
Part (c) Draw a scatter graph and show a trend line of the regression equation.
Paraphrase This Document
Need a fresh take? Get an instant paraphrase of this document with our AI Paraphraser
(d) Interpret the coefficient of correlation and determination.
Coefficient of correlation shows the connectivity and relationship of two variables with
each other.
(e) State the equation of regression and interpret the value of intercepts.
Regression equation = 0.0312X + 10.267
Coefficients
Standar
d Error t Stat
P-
value Lower 95%
Upper
95%
Lower
95.0%
Intercept
9.82273122
9
2.07508
5
4.73365
1
8.17E
-05
5.53996532
8
14.105
5
5.53996
5
Sales
Revenue 0.03146122
0.00149
7 21.019
5.78E
-17
0.02837197
8
0.0345
5
0.02837
2
Task 6
Part (1)Calculate the coefficients of variation for business A and B.
Venture A:
Coefficient of variation = 64
Coefficient of variation = Standard Deviation / Net EV * 100 % = 30.08 / 47.0 * 100
Venture B:
Coefficient of variation = 32.33
Coefficient of variation = Standard Deviation / Net EV * 100 % = 13.32 / 41.2 * 100
Part (b) By taking an assumption, that the risk of retailer is adverse, choose a project.
The retailer should consider Venture B for his investment as low coefficient of variation denotes
low level of dispersion around the mean.
Task 7
Give a reflective learning through the project.
By participating in above project helps me to develop several skills. It gives me the overall
scenario and gives me the instance of finance that will be beneficial for my professional
career. I was so excited at the time of doing this project because I know it will enhance my
knowledge and productivity. My confidence has increased after the completion of above
presentation. The most challenging aspects that faced during the assignment is due
miscalculations of numbers. Due to such issues I faced issues in matching the numbers. Next
time my focus will be on learning of formulas that will ease the difficult numericals for my
future project.
PART-2
1. Variable Cost = (Highest Activity Cost - Lowest Activity Cost) / (Highest Activity Units -
Lowest Activity Units) = (4,00,000 - 1,83,200) / (36,000 - 13,320) = 9.56
2. Monthly Fixed Costs = Highest Activity Cost - (Variable Cost Per Unit x Highest Activity
Units) = 4,00,000 - (9.55 * 36,000) = 56200
3. No of units to be sold in January to meet break even point = Fixed costs / (Selling price per
unit - Variable cost per unit) = 56200 / (12.45 - 9.55) = 19380
4. No of units to be sold in January to achieve a profit of £2,00,000 = (Estimated Profit + Fixed
Costs) / (Selling price per Unit- Variable cost per unit) = (2,00,000+56200) / (12.45-9.55)
5. Margin of safety for January 2021 = (Current Sales Level - break even point) / Current Sales
level * 100 = 78.06
6. Interpret the above calculations.
(a) High-Low method allows user to calculate the fixed and variable expenses with the figures of
sales and total costs.
(b) Fixed costs is the cost which occurs every time in a company production or manufacturing.
Variable costs changes with the change in quantity of production or sales. Fixed cost in this case
being, 56200 and variable cost being, 9.55 per unit.
(c) 19380 t-shirts are needed to be produced and sold to attain breakeven.
(d) 88345 units are to be produced and sold as to achieve the target profit.
⊘ This is a preview!⊘
Do you want full access?
Subscribe today to unlock all pages.
Trusted by 1+ million students worldwide
1 out of 14
Related Documents


Your All-in-One AI-Powered Toolkit for Academic Success.
+13062052269
info@desklib.com
Available 24*7 on WhatsApp / Email
![[object Object]](/_next/static/media/star-bottom.7253800d.svg)
Unlock your academic potential
Copyright © 2020–2026 A2Z Services. All Rights Reserved. Developed and managed by ZUCOL.