Financial Statistics Report: Earnings Analysis in UK Sectors

Verified

Added on  2021/02/21

|20
|3378
|379
Report
AI Summary
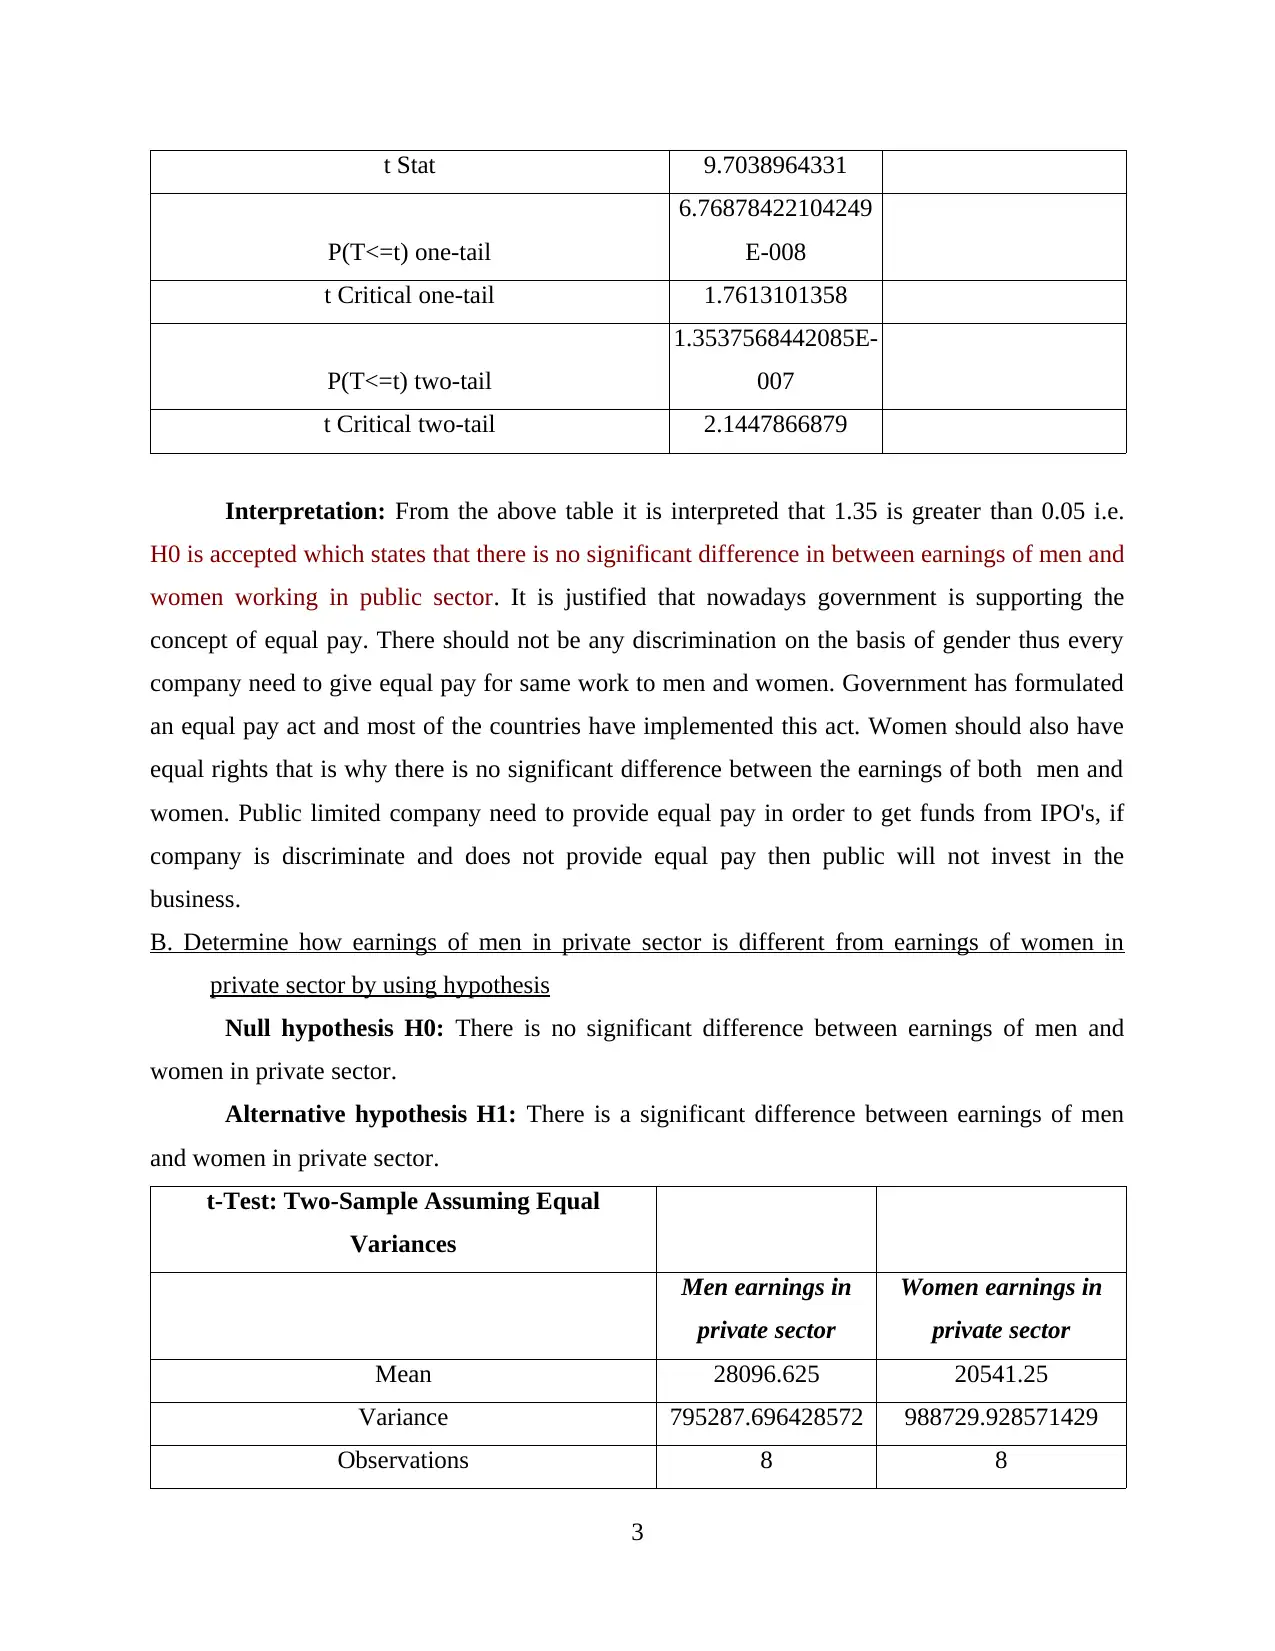
This report presents a comprehensive analysis of financial statistics, focusing on earnings comparisons within the UK. The study investigates the differences in earnings between men and women in both public and private sectors using t-tests and annual growth rate analysis. It evaluates hourly pay rates across different UK regions, employing median, standard deviation, and mean calculations, and compares earnings between London and Manchester. The analysis also includes the examination of annual growth rates and utilizes pie charts to illustrate the relationship between the number of bedrooms and house prices in specific areas. The report provides detailed interpretations of the statistical findings, offering insights into pay equity, economic trends, and financial data analysis, contributing to a deeper understanding of financial landscapes.
tabler-icon-diamond-filled.svg

Contribute Materials

Your contribution can guide someone’s learning journey. Share your documents today.
Document Page
STATISTICS
FINANCIAL
tabler-icon-diamond-filled.svg

Secure Best Marks with AI Grader

Need help grading? Try our AI Grader for instant feedback on your assignments.
Document Page
1
Document Page
INTRODUCTION
Financial statistics refers to collection of stock, flow of data of all economic sectors on
the financial liabilities and assets. It is used in decision making, data's are collected and mean,
median, standard deviation, correlation, quartiles etc. (Zheng and et.al. , 2017). are calculated to
analyse the data and take decisions. It plays a essential role in companies to make effective
policies like monetary and fiscal, formulate pricing models for equities, bonds, derivates and
currencies. Companies use statistics to analyse the data, identify trends and forecast. This is
beneficial for company in making presentations and identifying whether to sell or buy a n
investment. Present study includes the determination of difference between income of men and
women in public and private sector, investigation and assessment of hourly pay rates in different
areas of UK by applying median, standards deviation and mean, a comparison of earnings
between London and Manchester, evaluation of economic data and advice for 2 appropriate
information about the relation between number of bedrooms and house price in three streets with
the help of pie charts.
TASK 1
A. Determine how earnings of men in public sector is different from earnings of women in
public sector by using hypothesis
Null hypothesis H0: There is no significant difference between earnings of men and
women in public sector.
Alternative hypothesis H1: There is a significant difference in between earnings of men
and women working in private sector.
t-Test: Two-Sample Assuming Equal Variances
Earning of men in
public sector
Earning of women in
public sector
Mean 32276.625 26933.25
Variance 1449962.26785714 975692.5
Observations 8 8
Pooled Variance 1212827.38392857
Hypothesized Mean Difference 0
df 14
2
Document Page
t Stat 9.7038964331
P(T<=t) one-tail
6.76878422104249
E-008
t Critical one-tail 1.7613101358
P(T<=t) two-tail
1.3537568442085E-
007
t Critical two-tail 2.1447866879
Interpretation: From the above table it is interpreted that 1.35 is greater than 0.05 i.e.
H0 is accepted which states that there is no significant difference in between earnings of men and
women working in public sector. It is justified that nowadays government is supporting the
concept of equal pay. There should not be any discrimination on the basis of gender thus every
company need to give equal pay for same work to men and women. Government has formulated
an equal pay act and most of the countries have implemented this act. Women should also have
equal rights that is why there is no significant difference between the earnings of both men and
women. Public limited company need to provide equal pay in order to get funds from IPO's, if
company is discriminate and does not provide equal pay then public will not invest in the
business.
B. Determine how earnings of men in private sector is different from earnings of women in
private sector by using hypothesis
Null hypothesis H0: There is no significant difference between earnings of men and
women in private sector.
Alternative hypothesis H1: There is a significant difference between earnings of men
and women in private sector.
t-Test: Two-Sample Assuming Equal
Variances
Men earnings in
private sector
Women earnings in
private sector
Mean 28096.625 20541.25
Variance 795287.696428572 988729.928571429
Observations 8 8
3
tabler-icon-diamond-filled.svg

Secure Best Marks with AI Grader

Need help grading? Try our AI Grader for instant feedback on your assignments.
Document Page
Pooled Variance 892008.8125
Hypothesized Mean Difference 0
df 14
t Stat 15.9993171714
P(T<=t) one-tail
1.08089238375977E
-010
t Critical one-tail 1.7613101358
P(T<=t) two-tail
2.16178476751954E
-010
t Critical two-tail 2.1447866879
Interpretation: From the above calculation it is interpreted that 2.16 is greater than 0.05
i.e. H0 is accepted which means that there is no significant difference between in the earnings of
men and women in private sector. Companies nowadays follows equality act and provide equal
pay and benefits to both men and women. Every sector public or private need to pay equally
otherwise there will be increase in employee turnover and decrease in the profitability.
Government is supporting the rights of women and if company is discriminating on the basis of
pay then women have right to sue them or raise their voice against them.
C. Earning time chart of each group
Public sector
Year Men public sector Women public sector
2009 30638 25224
2010 31264 26113
2011 31380 26470
2012 31816 26663
2013 32541 27338
2014 32878 27705
2015 33685 27900
2016 34011 28053
4
Document Page
Interpretation: From the above table it is interpreted that income of men in public
sector has increased minorly and income of women in public sector is constant in 8 years.
Private sector
Year Men private sector Women private sector
2009 27632 19551
2010 27000 19532
2011 27233 19565
2012 27705 20313
2013 28201 20698
2014 28442 21017
2015 28881 21403
2016 29679 22251
5
1
2
3
4
5
6
7
8
0500010000150002000025000300003500040000
Men and women income in public sector
Document Page
1
2
3
4
5
6
7
8
0
5000
10000
15000
20000
25000
30000
35000
Men and women in private sector
Men private sector Women private sector
Interpretation: It is interpreted that income of men in private sector is almost constant
from 8 years and income of women in private sector is also constant from past 8 years which
means government is supporting for equal pay. Government has also formulated policies against
equal pay which is accepted and implemented by many companies .
D. determine annual growth rate in earning of the four group
ANNUAL GROWTH RATE
6
tabler-icon-diamond-filled.svg

Paraphrase This Document

Need a fresh take? Get an instant paraphrase of this document with our AI Paraphraser
Document Page
Annual growth rate is an increase in the individual investment value , asset, portfolio or
cash (Tang and et.al., 2019). It is determined by taking arithmetic mean of series of growth rate.
It is use to calculate any investment regardless to overall risk of an investment. It is beneficial for
determining long-term trends. It is applicable to find out any kind of financial measure such as
growth rates of cash flows, profits and revenues.
Year Men public sector
YOY Growth
rate
Women public
sector
YOY Growth
rate
2009 30638 25224
2010 31264 2% 26113 4%
2011 31380 0% 26470 1%
2012 31816 1% 26663 1%
2013 32541 2% 27338 3%
2014 32878 1% 27705 1%
2015 33685 2% 27900 1%
2016 34011 1% 28053 1%
Interpretation: According to the preceding calculation it can be said that annual growth
rate of the earnings of men and women in public sector has not increased much. It is constant to
2% or 1% increase. It is due to equal rights of men and women. Companies are trying to balance
the pay and changing their payroll structure. It can be said that there is no trend in the annual
growth of both men and women.
7
Document Page
ANNUAL GROWTH RATE
Year
Men private
sector
YOY Growth
rate Women private sector YOY Growth rate
2009 27632 19551
2010 27000 -2% 19532 0%
2011 27233 1% 19565 0%
2012 27705 2% 20313 4%
2013 28201 2% 20698 2%
2014 28442 1% 21017 2%
2015 28881 2% 21403 2%
2016 29679 3% 22251 4%
Interpretation: According to the above table it can be interpreted that there was
decrease in the annual growth by -2% in 2010 and from 2011 onwards there was an increase of 2
to 1% in the earnings of men and women in private sector. In both public and private sector there
is a minor increase in the earnings but in private sector there was an increase of 3% in the year
2016.
TASK 2
A) Analysis and evaluation of hourly pay rates in different UK regions
1. Estimation of median hourly earnings and quartiles with the help of ogive chart:
Median: It is use to measure central tendency, to determine median, all the observation
are arranged in smallest to largest value (Stroud, 2016). If the number is odd than median in
middle value and if the observations are even then median is calculated as the average of middle
values.
Hourly
earning
No. of leisure
centre staff
Relative
frequency
Cumulative
frequency
Cumulative relative
frequency
0 – 10 4 0.08 4 0.08
10 – 20 23 0.46 27 0.54
20 – 30 13 0.26 40 0.8
30 – 40 7 0.14 47 0.94
40 – 50 3 0.06 50 1
8
Document Page
Total 50
Median can be calculated as follows:
1. Divide last CF by 2.
= N/2
2. Apply the formula
= L / 2 + H / f [N / 2 – C]
Here,
F = corresponding frequency
N = summation of all frequency
L = lower limit of middle class
H = size of class
C = cumulative frequency
According to the given table median is 50/2 = 25.
Quartile: It describes a division of data into four intervals on the basis of values and
identify how they compare sets of observations (Júlíusson and et.al., 2018). It determines a set of
data by breaking them into quarters. Second quartile is median. It divides values into quarters
such as quarter 1, 2, 3. interquartile range measure variability of data that are divided into
quarters.
Calculation of quartile:
1 Quartile 4
3 Quartile 13
Interquartile 9
9
tabler-icon-diamond-filled.svg

Secure Best Marks with AI Grader

Need help grading? Try our AI Grader for instant feedback on your assignments.
Document Page
0 – 10 10 – 20 20 – 30 30 – 40 40 – 50
0
0.2
0.4
0.6
0.8
1
1.2
ogive chart
2. Calculation of mean and standards deviation for hourly earnings:
Mean: It is an average used to determine central tendency of data. In other words it is
calculated by adding all the data and divide them by total number of data. The result is mean. It
is also called arithmetic mean or average mean (Vazac, and et.al., 2016).
Standard deviation: It is used to to measure variation amount and dispersion of a set of
data. Low standard deviation means numbers are closer to average and high standard deviation
determines that numbers are spread out (D’Agostino, 2017).
Arithmetic mean
Hourly
earning
Number of leisure
centre staff (f) mid value (x) Fm
0 – 10 4 5 20
10 – 20 23 15 345
20 – 30 13 25 325
30 – 40 7 35 245
40 – 50 3 45 135
50 1070
10
Document Page
Arithmetic mean = Σfx/fm
= 1070/ 50
= 21.4
Interpretation : From the above table the arithmetic mean is 21.4 which means the
hourly earning of men and women is in between 20-30. It can be interpreted that the hourly
earnings is moderate. Hourly earnings of 4 leisure staff is in between 0-10, 23 leisure staff has
earnings between 10- 20. Arithmetic mean is a mean or a value which is equidistant from the
values of data. It is the average of all the data in the table (Yuan, Wan and Wei, 2016). All the
sum of group of data is added and then divided by the number of series. It is used by many
companies as it is easy to understand and it is also used for further study for statistical analysis. It
is not affected by fluctuations and value of mean is always fixed.
Calculation of standards deviation
Hourly
earning
Number of
leisure
centre staff
(f)
mid value
(x) Fm X- average
(X-
average^2) (X- average)^2*f
0 – 10 4 5 20 -16.4 268.96 1075.84
10 – 20 23 15 345 -6.4 40.96 942.08
20 – 30 13 25 325 3.6 12.96 168.48
30 – 40 7 35 245 13.6 184.96 1294.72
40 – 50 3 45 135 23.6 556.96 1670.88
50 1070 5152
Standard deviation = √( X- x̄)^2*f /n
= √(5152 / 50)
= 10.13
Interpretation : From the above calculation it can be interpreted that standard deviation
is 10.13 which means the earnings of the staff leisure is low deviated from the average earnings
of staff. The purpose of SD is to see how data is spread out. High standard deviation means that
the data is far from the average and low standard deviation means it is close to average. It is
11
Document Page
beneficial to apply SD to measure the variance between the data. It is less affected by the
fluctuation.
B) Earnings comparison
Particular Manchester London
Median 14 14.13
Interquartile 7.5 9
mean 16.5 21.4
Standard deviation 7 10.13
Interpretation: From the above table it can be interpreted that average earning of
London (M = 21.4) is higher than Manchester (M = 16.5). However, income level is more stable
in Manchester (SD = 7) relative to London (SD = 10.13). There is high fluctuation in London and
pay is volatile but in Manchester mostly people are getting same pay.
TASK 3
Section A
Illustration 1: Normal distribution curve
X 500
Mean 202
ST DEV. 2.4
12
tabler-icon-diamond-filled.svg

Paraphrase This Document

Need a fresh take? Get an instant paraphrase of this document with our AI Paraphraser
Document Page
z SCORE 124.1666666667
Interpretation: From the above graph it can be interpreted that Z score is 124.166 which
means in Z table it represents 0.1075 i.e. there is 10% probability.
Section B
Particulars Figures
Demand for year 450000
Cost of delivery 20
Value 9000000
Ordering cost per order 2
Total ordering cost 900000
Inventory holding cost 112500
Economic order quantity 2683.28
Economic order quantity: EOQ is a company need to ass a number of units into
inventory in order to minimize inventory total cost such as storage, holding and order costs.
Economic order quantity is a inventory system management tool which monitors and controls the
fixed quantity and time. It measures the time in which inventory level reaches a particular limit
or specific order. It is used to calculate reorder point in order to replenish the inventory so there
will be no shortage (Bonnet, Morrissey and Kruuk, 2019). It is a valuable tool for firm in order to
make decisions and keep inventory up-to-date. It helps company in determining whether
inventory is timely reordered, how many times order is repeated and how inventory need to be
reordered so that it incurs low cost. In the above table economic order quantity is 2683.28 which
means if inventory level comes to this point then company need to reorder.
TASK 4
4.1 Pie chart
Green street
Number of bedrooms Green street
1 8
2 28
3 37
13
Document Page
4 17
5 10
Total 100
8
28
37
17
10
1
2
3
4
5
Church lane
Number of bedrooms Church lane
1 6
2 18
3 24
4 9
5 3
Total 60
14
Document Page
6
18
24
9
3
1
2
3
4
5
Eton avenue
Number of bedrooms Eton avenue
1 4
2 20
3 32
4 12
5 12
Total 80
15
tabler-icon-diamond-filled.svg

Secure Best Marks with AI Grader

Need help grading? Try our AI Grader for instant feedback on your assignments.
Document Page
4
20
32
12
12
1
2
3
4
5
4.2 Two appropriate ways to effectively communicate the relationship between the numbers of
bedrooms and house price in the three streets
The first way of presenting the relation between the no. of bedrooms and house price is
determining the percentage change from 2 bedroom house to 3 bedroom house.
Number of bedrooms
Green street (in
lakhs)
Church lane (in
lakhs)
Eton avenue (in
lakhs)
2 6 7 7.5
3 7 8.5 10
Percentage change from 2
room to 3 room house 16.67% 21.43% 33.33%
Interpretation: If rosaline wants to purchase 2 bedroom house then the cost is 600000 in
green street and if she want to purchase 3 bedroom house in same street then she need to pay
16.67% more. If she want to purchase 2 bedroom house in church lane, it will cost 700000 and if
she want 3 bedroom house then it will cost 21.43% more. Same in the case of Eton avenues she
need to incur 33.33% more cost to purchase 3 bedroom house. The percentage of price is varies
16
Document Page
according to the street. Rosaline can purchase 3 bedroom house in green street as the price there
is less among all the streets.
The second way to communicate the relation between number of bedrooms and house
price is by making graph.
1.8 2 2.2 2.4 2.6 2.8 3 3.2
0
200000
400000
600000
800000
1000000
1200000
Green street
Church lane
Eton avenue
Interpretation: From the above graph it is said that if rosaline want to purchase 2 or 3
bedroom house in green street then it will be in the range of 600000 to 700000, in church lane it
will be in the range of 700000 to 850000 and in Eton avenue it will range from 700000 to
1000000.
CONCLUSION
It is concluded that statistics in finance is really beneficial for companies in order to make
strategic decisions and formulate policies and procedures. Companies use statistics to analyse the
data, identify trends and forecast. It is beneficial for company in identifying whether to sell or
buy an investment. It is been concluded that the variation between the earnings of men and
women in private and public sector does not vary much because companies are trying to balance
the pay of men and women in order to provide equal rights to them. Hence, null hypothesis is
accepted which means that there is no significant deviation between earning of men and women.
Government is also supporting the equal pay act and making strict policies against it which need
to be followed by every organisations. Thus, yearly growth rate of both personnel in public and
private sector is constant. There is a minor increase and decrease in their growth rate. Further in
17
Document Page
the report it is also concluded that there is a high deviation in the earnings of leisure staff from
the average earnings. Standard deviation is highly deviated from average. There is a comparison
between the earnings of London and Manchester, it is concluded that average earning of London
is higher than Manchester but it is also highlighted that London has high fluctuation rate. Report
also highlights the concept of economic order quantity which states that at what point company
need to reorder the inventory so that there is no shortage of goods and services. It is used in
decision making and managing the inventory level.
18
tabler-icon-diamond-filled.svg

Paraphrase This Document

Need a fresh take? Get an instant paraphrase of this document with our AI Paraphraser
Document Page
19
chevron_up_icon
1 out of 20
circle_padding
hide_on_mobile
zoom_out_icon
logo.png

Your All-in-One AI-Powered Toolkit for Academic Success.

Available 24*7 on WhatsApp / Email

[object Object]