Semester 2, 2018: Financial Statistics Report (FIN10002)
VerifiedAdded on 2023/06/04
|15
|3265
|244
Report
AI Summary
This report presents a statistical analysis of consumer movie download data, aiming to provide insights for financial decision-making. The analysis, conducted using a quantitative approach, examines a random sample of consumers across various states and cities within the United States. Key findings include significant differences in consumer behavior across different locations, with Phoenix showing the highest average movie purchases and spending. The report also explores gender-based differences in purchasing habits, finding a slight difference in favor of males. Furthermore, it identifies the number of purchases as the most significant variable for predicting movie-related spending. The analysis covers descriptive statistics, confidence intervals, hypothesis testing, correlation, and regression analysis to determine relationships between variables such as age, purchases, and dollar amounts spent. The report concludes with a summary of the findings, limitations, and references used in the analysis.
Course: Financial Statistics
Unit code: FIN10002
Semester: 2, 2018
Assessment: 2 Report
Student Name
Student ID
Institution Name
Date of submission
Unit code: FIN10002
Semester: 2, 2018
Assessment: 2 Report
Student Name
Student ID
Institution Name
Date of submission
Paraphrase This Document
Need a fresh take? Get an instant paraphrase of this document with our AI Paraphraser
Executive Summary
Upon carrying out an intensive statistical analysis of the consumer data downloaded from the
canvas, a number of observations were made which may assist the management carry out
appropriate financial decisions.
To begin there is a significance difference in consumer behaviour from each of the states and
cities within the united states. From the average purchases’ perspectives, clients from
Phoenix do purchase more movies on average, this has also seen them allocating more cash to
the purchase of movies.
Even though men do purchase more movies the difference is slight and the two of gender
show insignificance difference.
The analysis goes ahead to provide information to indicate the variables that can be used to
predict the money spent on the movies with the number of purchases being the greatest
explanatory variable.
Introduction
The aim of this report if to provide the results of the analysis of the data on the consumption
of movies across various States in the United States.
In the report will provide mathematical as well as visual analyses of the random sample
obtained from a population of consumers from several states.
The methodology of the study is based on quantitative analysis which majors on the statistical
interpretations to obtain insights which can be used to make generalisations about the
population data.
The data used for the analysis was downloaded from the Canvas and is presented in the
Appendix section of the report.
Analysis
Selection of a random sample
Simple random sampling is a technique in which all the population data have an equal chance
of being selected into the sample.
One of the ways of selecting the sample is to randomly choose 50 numbers between 1 and
4815 and use them to represent the customer number, afterwards the numbers can be used to
extract the details of the customers from the population.
Also, we can use excel to generate 50 random numbers between 1 and 4815 and thereafter
use the numbers as customer number. The number can afterwards be used to extract
consumer details from the population data.
Descriptive Statistics
City
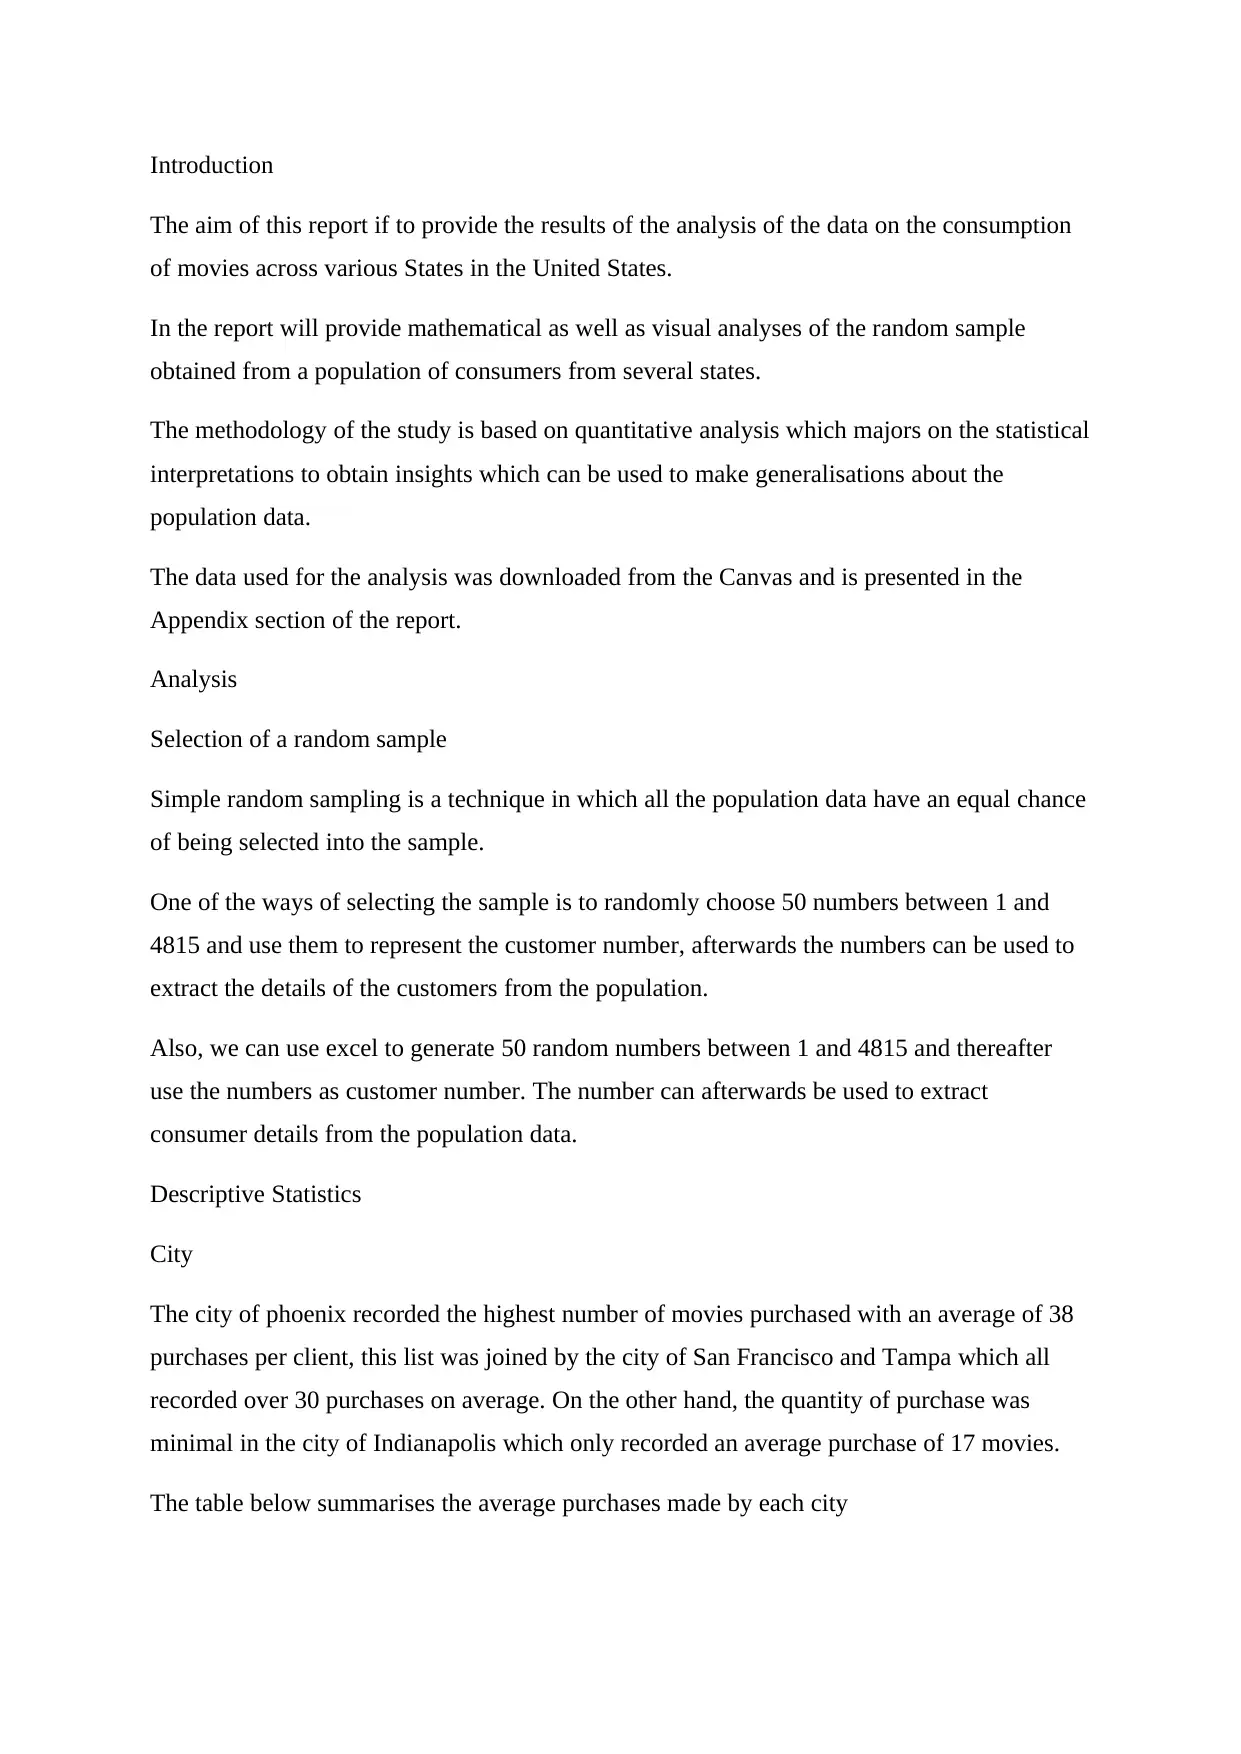
The city of phoenix recorded the highest number of movies purchased with an average of 38
purchases per client, this list was joined by the city of San Francisco and Tampa which all
recorded over 30 purchases on average. On the other hand, the quantity of purchase was
minimal in the city of Indianapolis which only recorded an average purchase of 17 movies.
The table below summarises the average purchases made by each city
The aim of this report if to provide the results of the analysis of the data on the consumption
of movies across various States in the United States.
In the report will provide mathematical as well as visual analyses of the random sample
obtained from a population of consumers from several states.
The methodology of the study is based on quantitative analysis which majors on the statistical
interpretations to obtain insights which can be used to make generalisations about the
population data.
The data used for the analysis was downloaded from the Canvas and is presented in the
Appendix section of the report.
Analysis
Selection of a random sample
Simple random sampling is a technique in which all the population data have an equal chance
of being selected into the sample.
One of the ways of selecting the sample is to randomly choose 50 numbers between 1 and
4815 and use them to represent the customer number, afterwards the numbers can be used to
extract the details of the customers from the population.
Also, we can use excel to generate 50 random numbers between 1 and 4815 and thereafter
use the numbers as customer number. The number can afterwards be used to extract
consumer details from the population data.
Descriptive Statistics
City
The city of phoenix recorded the highest number of movies purchased with an average of 38
purchases per client, this list was joined by the city of San Francisco and Tampa which all
recorded over 30 purchases on average. On the other hand, the quantity of purchase was
minimal in the city of Indianapolis which only recorded an average purchase of 17 movies.
The table below summarises the average purchases made by each city
⊘ This is a preview!⊘
Do you want full access?
Subscribe today to unlock all pages.
Trusted by 1+ million students worldwide
Chicago
Denver
Indianapolis
Los Angeles
Miami
New Orleans
Orlando
Phoenix
San Diego
San Francisco
Tampa
Tucson
0.00
5.00
10.00
15.00
20.00
25.00
30.00
35.00
40.00
25.33 25.00
17.00
28.50 25.40
20.50 21.29
38.00
20.80
32.20 30.67
21.71
Average purchases per City
City
Purchases
State
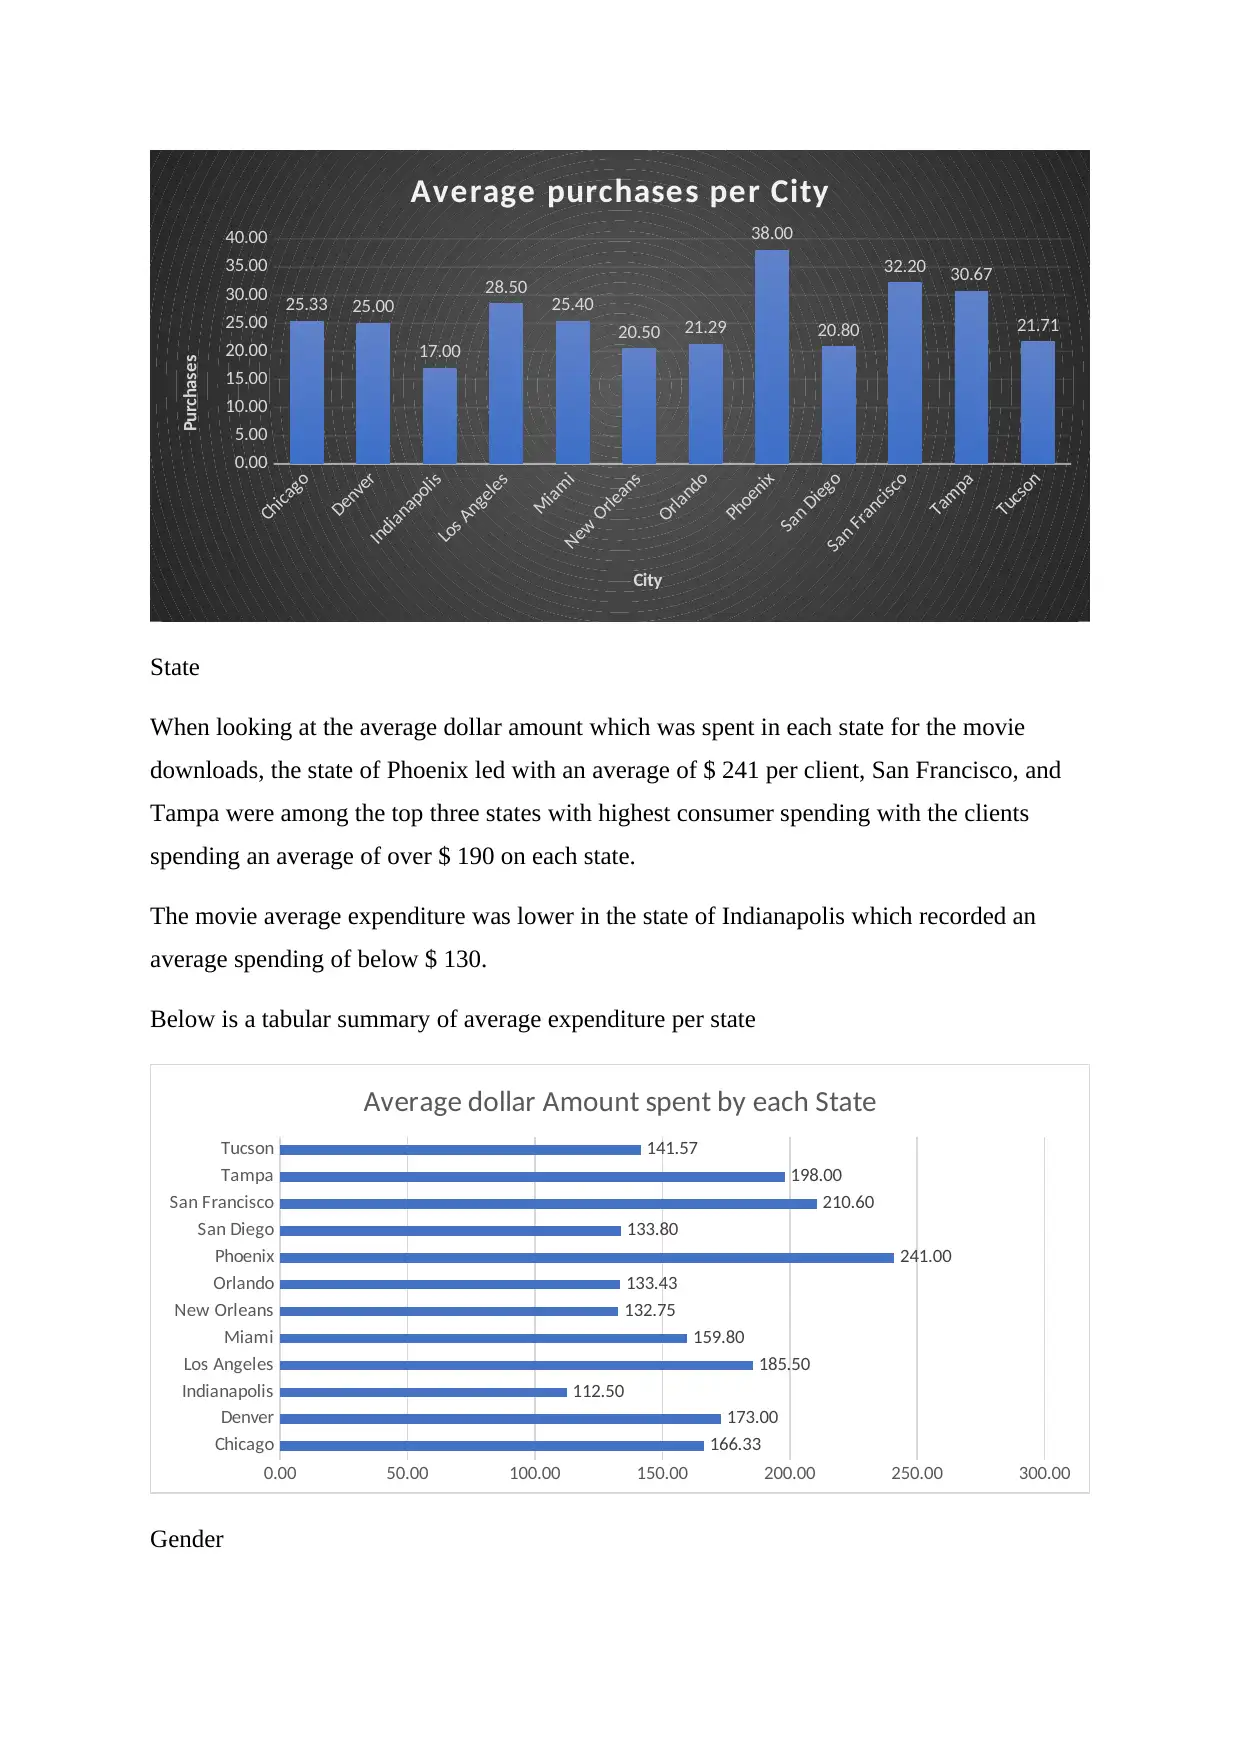
When looking at the average dollar amount which was spent in each state for the movie
downloads, the state of Phoenix led with an average of $ 241 per client, San Francisco, and
Tampa were among the top three states with highest consumer spending with the clients
spending an average of over $ 190 on each state.
The movie average expenditure was lower in the state of Indianapolis which recorded an
average spending of below $ 130.
Below is a tabular summary of average expenditure per state
Chicago
Denver
Indianapolis
Los Angeles
Miami
New Orleans
Orlando
Phoenix
San Diego
San Francisco
Tampa
Tucson
0.00 50.00 100.00 150.00 200.00 250.00 300.00
166.33
173.00
112.50
185.50
159.80
132.75
133.43
241.00
133.80
210.60
198.00
141.57
Average dollar Amount spent by each State
Gender
Denver
Indianapolis
Los Angeles
Miami
New Orleans
Orlando
Phoenix
San Diego
San Francisco
Tampa
Tucson
0.00
5.00
10.00
15.00
20.00
25.00
30.00
35.00
40.00
25.33 25.00
17.00
28.50 25.40
20.50 21.29
38.00
20.80
32.20 30.67
21.71
Average purchases per City
City
Purchases
State
When looking at the average dollar amount which was spent in each state for the movie
downloads, the state of Phoenix led with an average of $ 241 per client, San Francisco, and
Tampa were among the top three states with highest consumer spending with the clients
spending an average of over $ 190 on each state.
The movie average expenditure was lower in the state of Indianapolis which recorded an
average spending of below $ 130.
Below is a tabular summary of average expenditure per state
Chicago
Denver
Indianapolis
Los Angeles
Miami
New Orleans
Orlando
Phoenix
San Diego
San Francisco
Tampa
Tucson
0.00 50.00 100.00 150.00 200.00 250.00 300.00
166.33
173.00
112.50
185.50
159.80
132.75
133.43
241.00
133.80
210.60
198.00
141.57
Average dollar Amount spent by each State
Gender
Paraphrase This Document
Need a fresh take? Get an instant paraphrase of this document with our AI Paraphraser
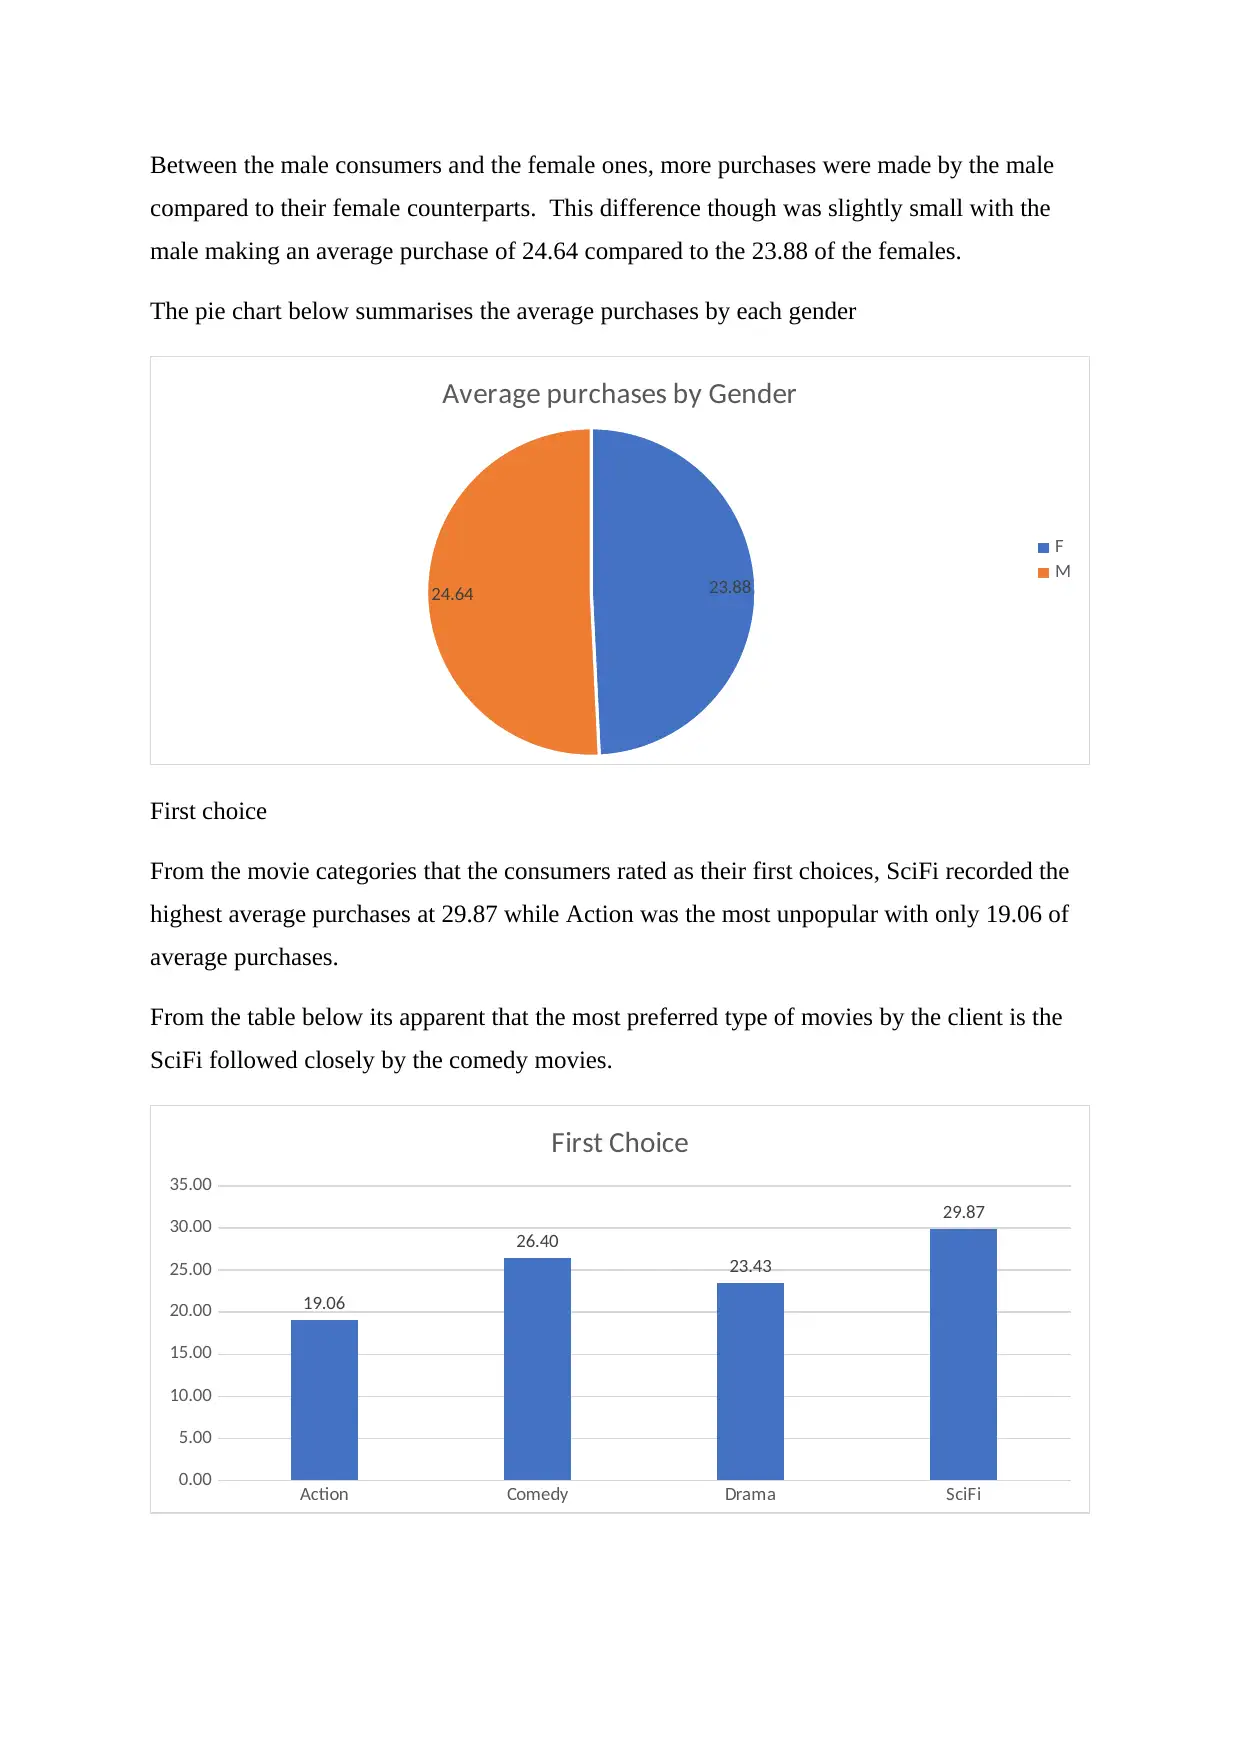
Between the male consumers and the female ones, more purchases were made by the male
compared to their female counterparts. This difference though was slightly small with the
male making an average purchase of 24.64 compared to the 23.88 of the females.
The pie chart below summarises the average purchases by each gender
23.8824.64
Average purchases by Gender
F
M
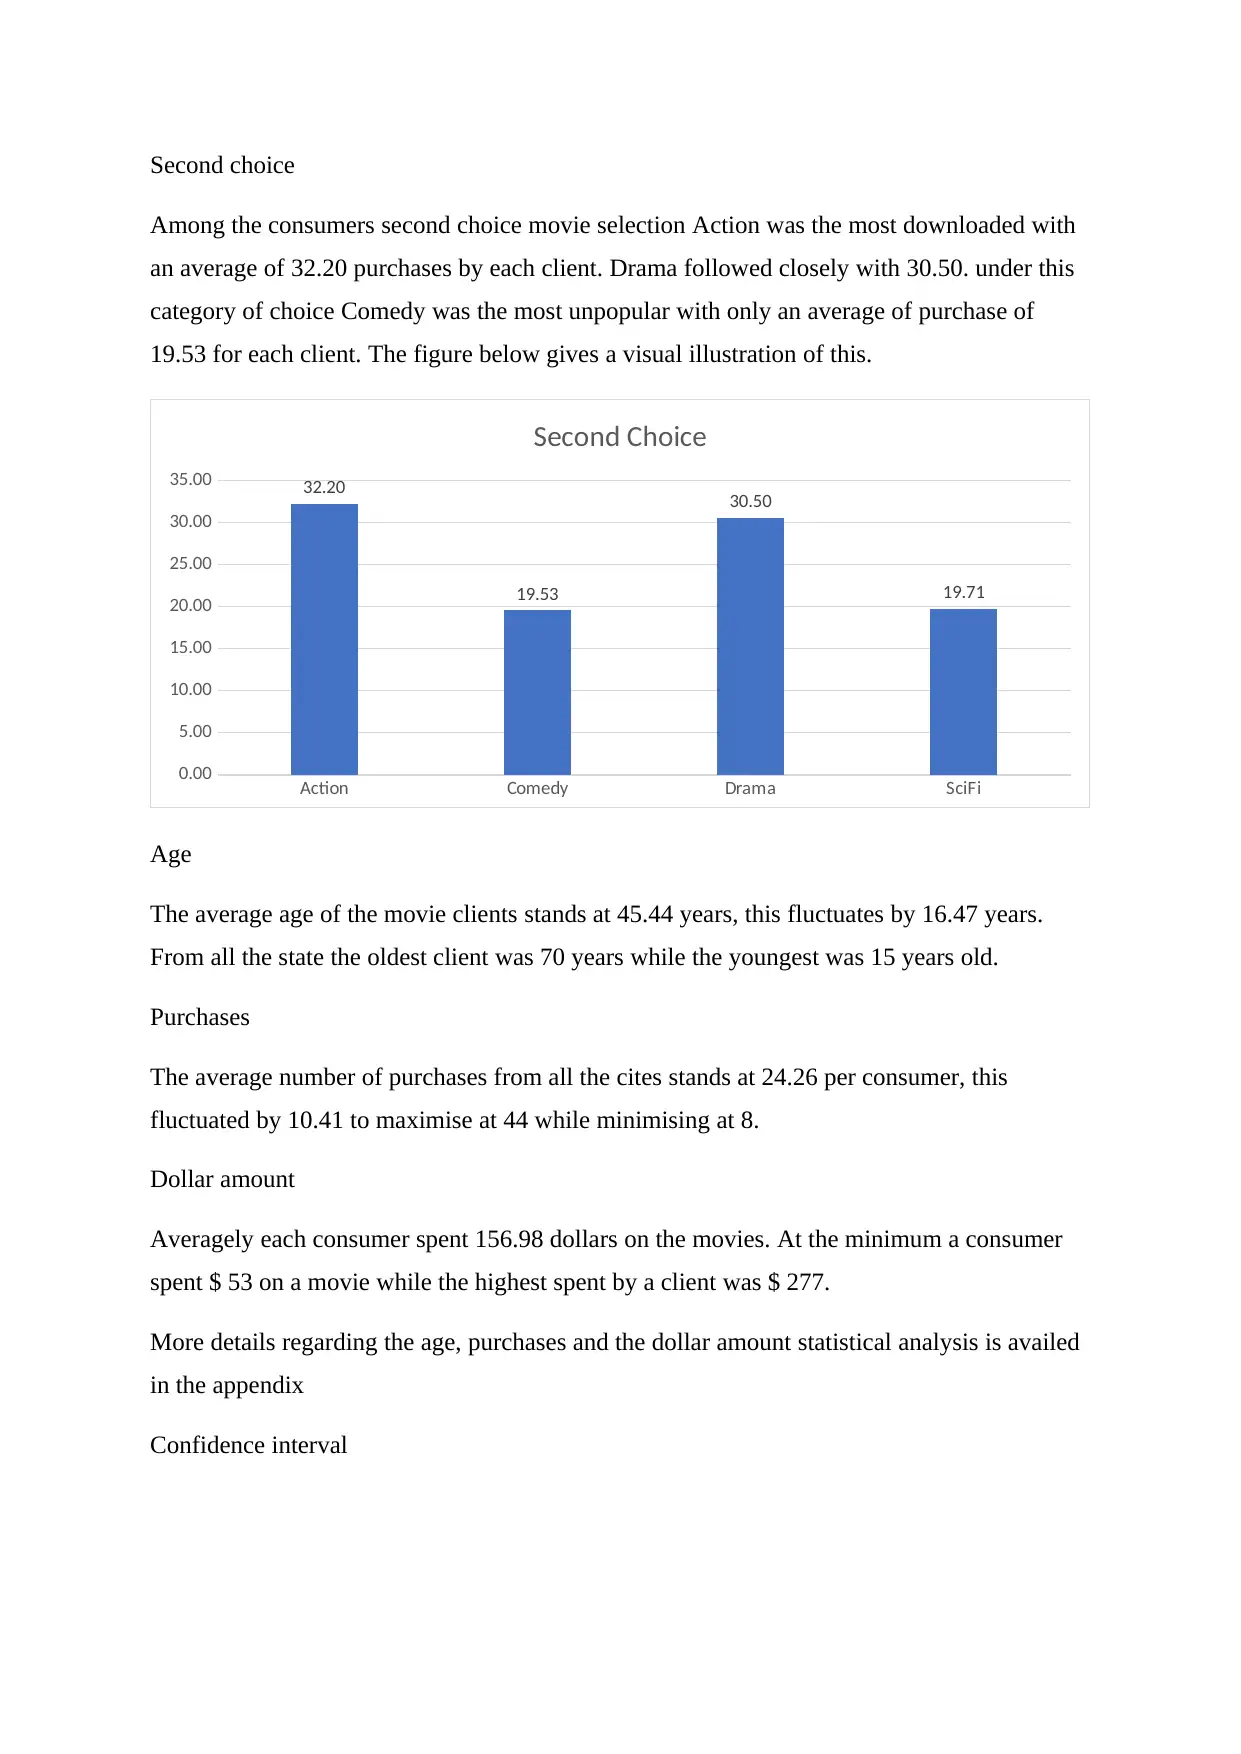
First choice
From the movie categories that the consumers rated as their first choices, SciFi recorded the
highest average purchases at 29.87 while Action was the most unpopular with only 19.06 of
average purchases.
From the table below its apparent that the most preferred type of movies by the client is the
SciFi followed closely by the comedy movies.
Action Comedy Drama SciFi
0.00
5.00
10.00
15.00
20.00
25.00
30.00
35.00
19.06
26.40
23.43
29.87
First Choice
compared to their female counterparts. This difference though was slightly small with the
male making an average purchase of 24.64 compared to the 23.88 of the females.
The pie chart below summarises the average purchases by each gender
23.8824.64
Average purchases by Gender
F
M
First choice
From the movie categories that the consumers rated as their first choices, SciFi recorded the
highest average purchases at 29.87 while Action was the most unpopular with only 19.06 of
average purchases.
From the table below its apparent that the most preferred type of movies by the client is the
SciFi followed closely by the comedy movies.
Action Comedy Drama SciFi
0.00
5.00
10.00
15.00
20.00
25.00
30.00
35.00
19.06
26.40
23.43
29.87
First Choice
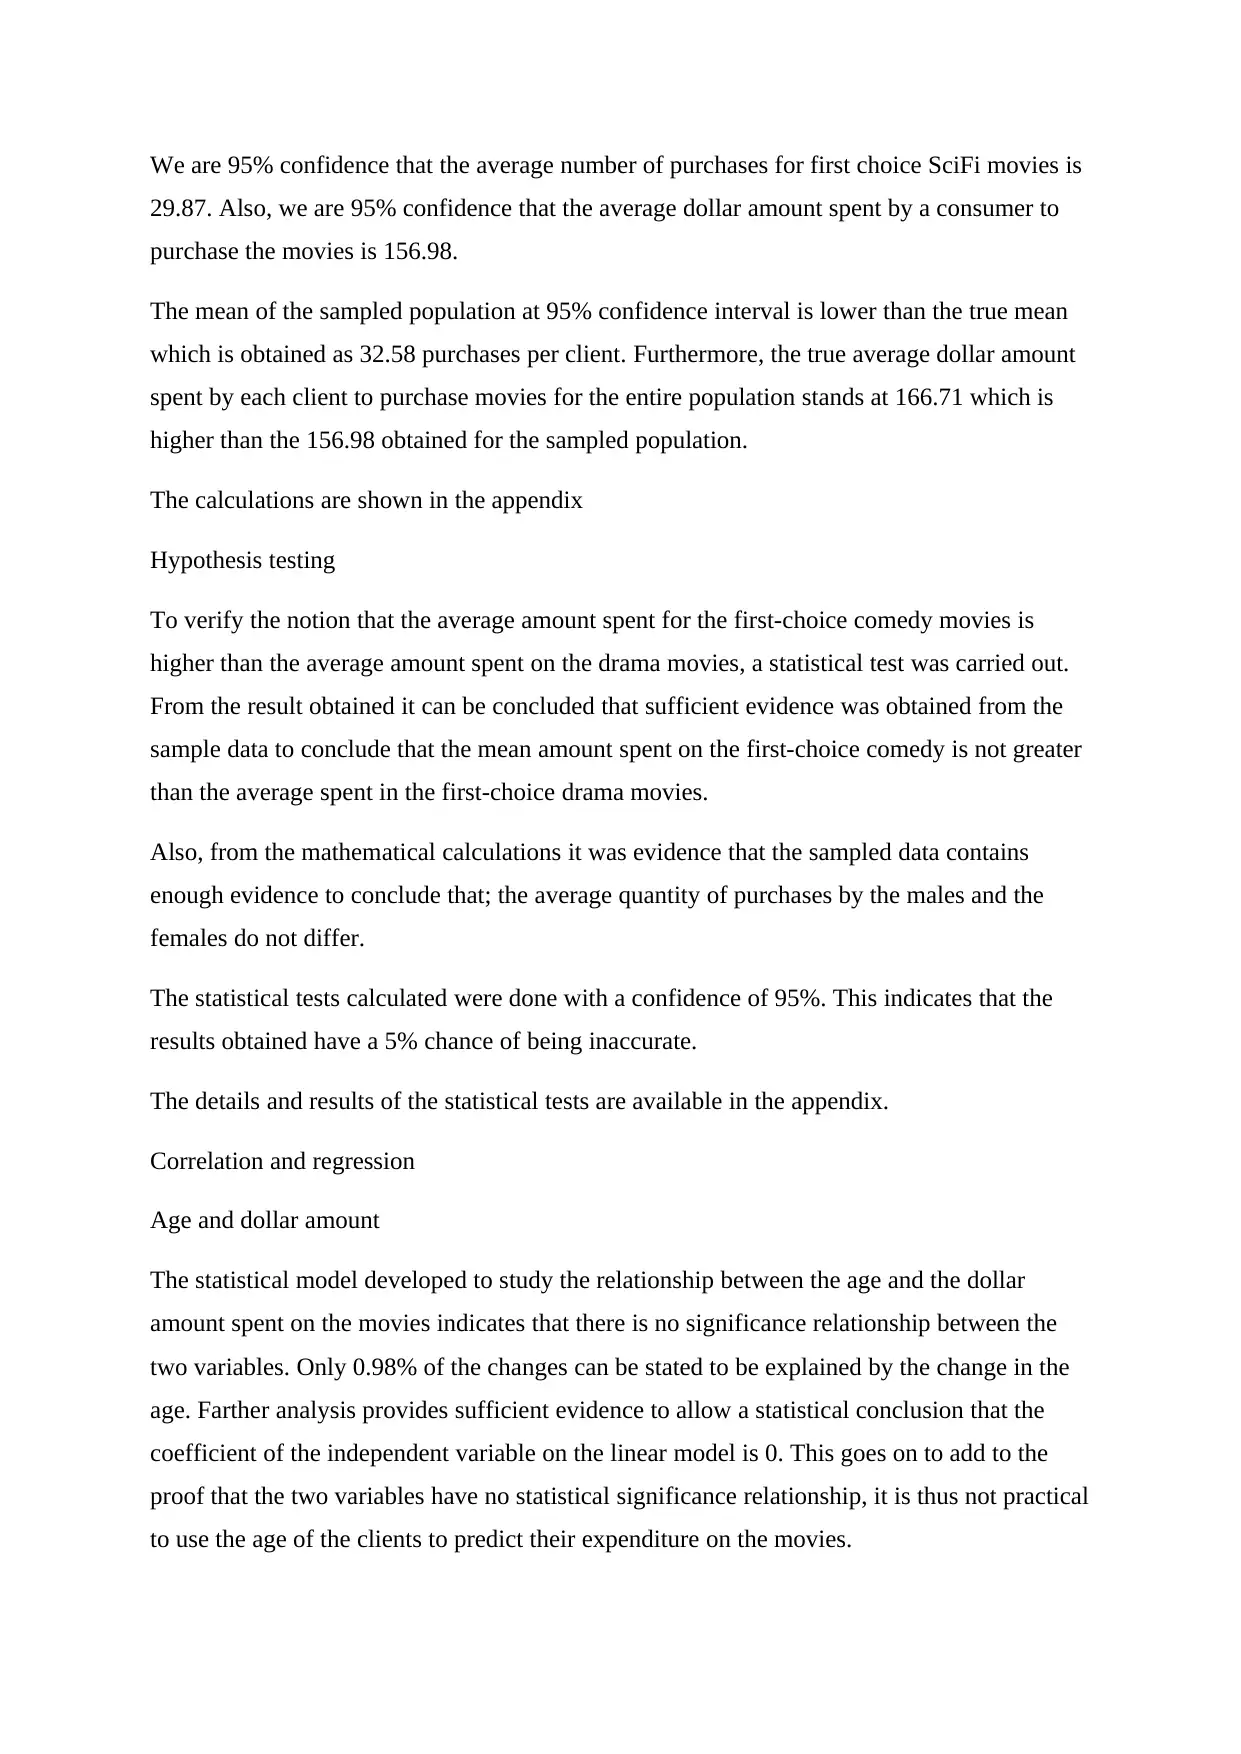
Second choice
Among the consumers second choice movie selection Action was the most downloaded with
an average of 32.20 purchases by each client. Drama followed closely with 30.50. under this
category of choice Comedy was the most unpopular with only an average of purchase of
19.53 for each client. The figure below gives a visual illustration of this.
Action Comedy Drama SciFi
0.00
5.00
10.00
15.00
20.00
25.00
30.00
35.00 32.20
19.53
30.50
19.71
Second Choice
Age
The average age of the movie clients stands at 45.44 years, this fluctuates by 16.47 years.
From all the state the oldest client was 70 years while the youngest was 15 years old.
Purchases
The average number of purchases from all the cites stands at 24.26 per consumer, this
fluctuated by 10.41 to maximise at 44 while minimising at 8.
Dollar amount
Averagely each consumer spent 156.98 dollars on the movies. At the minimum a consumer
spent $ 53 on a movie while the highest spent by a client was $ 277.
More details regarding the age, purchases and the dollar amount statistical analysis is availed
in the appendix
Confidence interval
⊘ This is a preview!⊘
Do you want full access?
Subscribe today to unlock all pages.
Trusted by 1+ million students worldwide
We are 95% confidence that the average number of purchases for first choice SciFi movies is
29.87. Also, we are 95% confidence that the average dollar amount spent by a consumer to
purchase the movies is 156.98.
The mean of the sampled population at 95% confidence interval is lower than the true mean
which is obtained as 32.58 purchases per client. Furthermore, the true average dollar amount
spent by each client to purchase movies for the entire population stands at 166.71 which is
higher than the 156.98 obtained for the sampled population.
The calculations are shown in the appendix
Hypothesis testing
To verify the notion that the average amount spent for the first-choice comedy movies is
higher than the average amount spent on the drama movies, a statistical test was carried out.
From the result obtained it can be concluded that sufficient evidence was obtained from the
sample data to conclude that the mean amount spent on the first-choice comedy is not greater
than the average spent in the first-choice drama movies.
Also, from the mathematical calculations it was evidence that the sampled data contains
enough evidence to conclude that; the average quantity of purchases by the males and the
females do not differ.
The statistical tests calculated were done with a confidence of 95%. This indicates that the
results obtained have a 5% chance of being inaccurate.
The details and results of the statistical tests are available in the appendix.
Correlation and regression
Age and dollar amount
The statistical model developed to study the relationship between the age and the dollar
amount spent on the movies indicates that there is no significance relationship between the
two variables. Only 0.98% of the changes can be stated to be explained by the change in the
age. Farther analysis provides sufficient evidence to allow a statistical conclusion that the
coefficient of the independent variable on the linear model is 0. This goes on to add to the
proof that the two variables have no statistical significance relationship, it is thus not practical
to use the age of the clients to predict their expenditure on the movies.
Paraphrase This Document
Need a fresh take? Get an instant paraphrase of this document with our AI Paraphraser
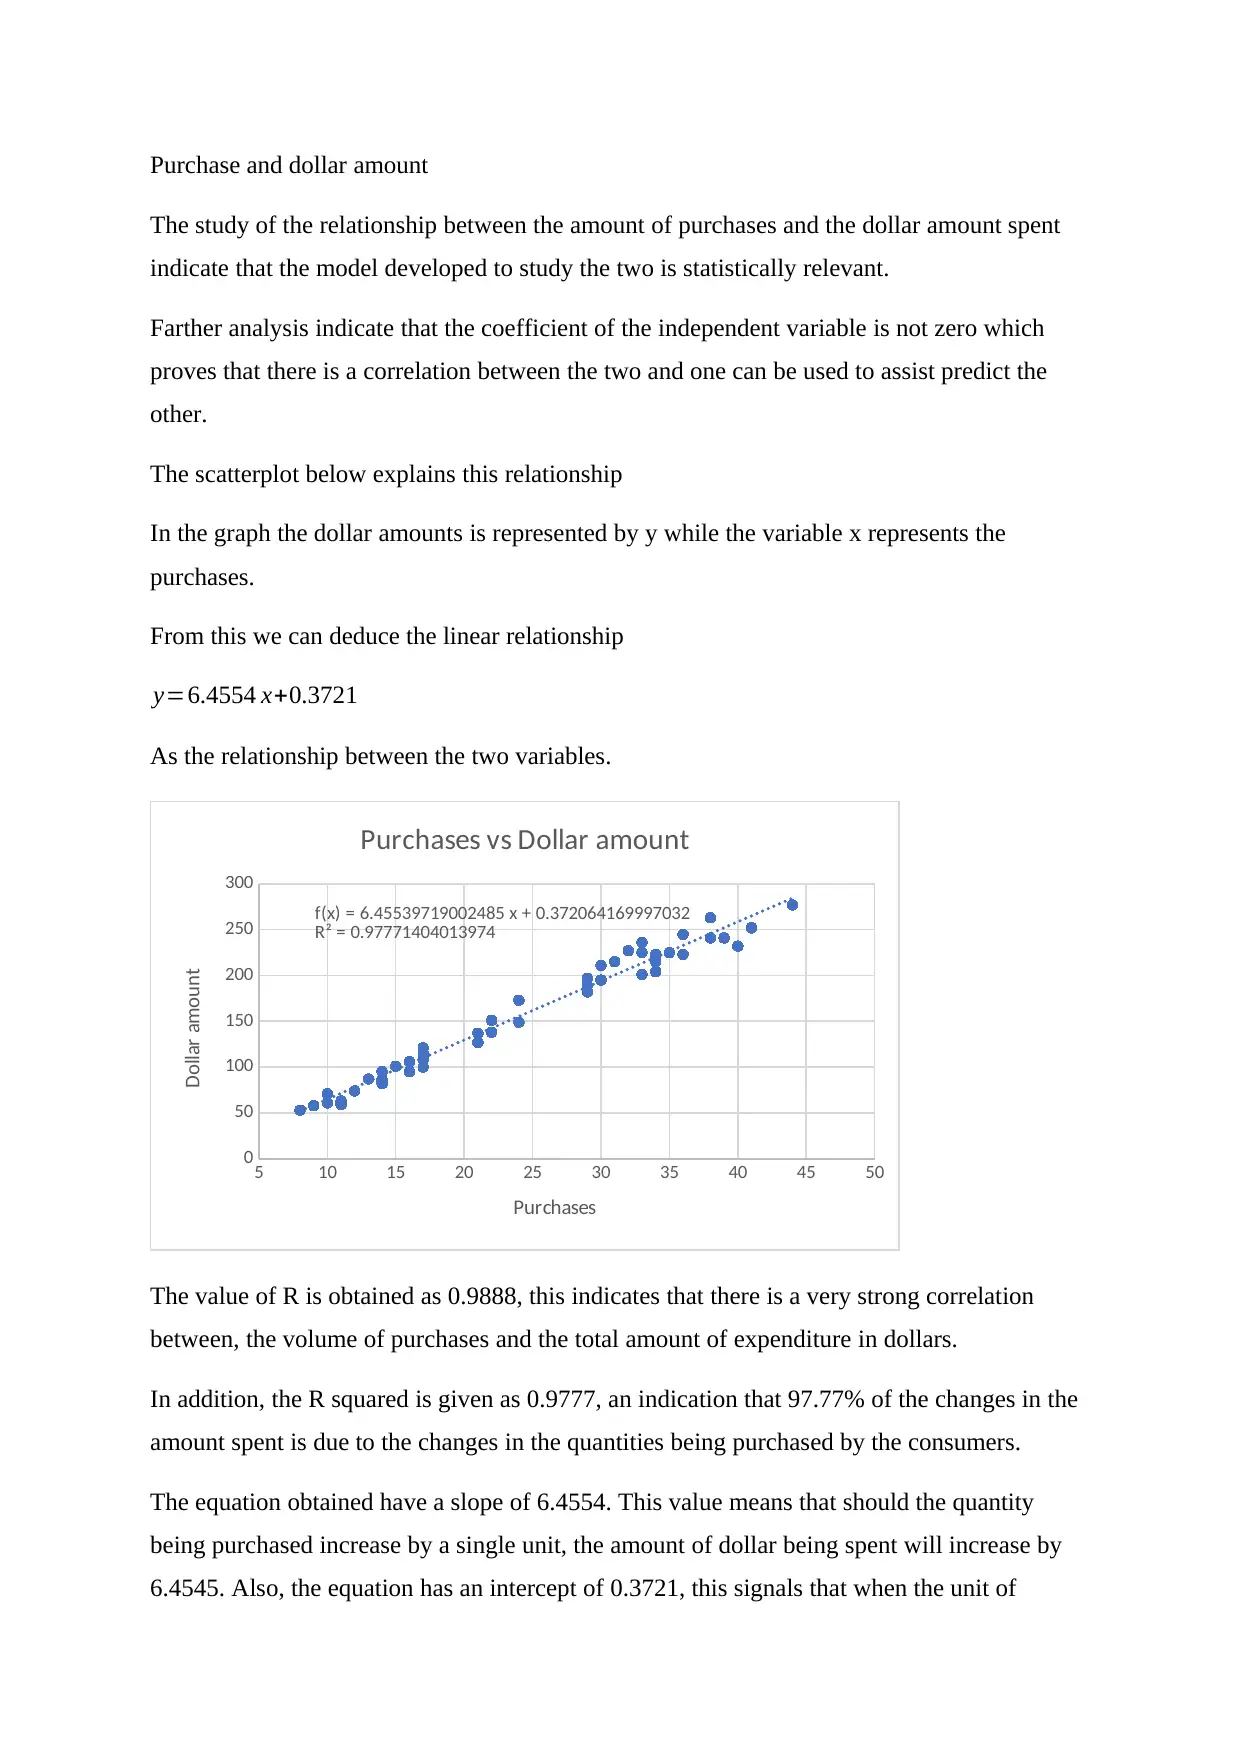
Purchase and dollar amount
The study of the relationship between the amount of purchases and the dollar amount spent
indicate that the model developed to study the two is statistically relevant.
Farther analysis indicate that the coefficient of the independent variable is not zero which
proves that there is a correlation between the two and one can be used to assist predict the
other.
The scatterplot below explains this relationship
In the graph the dollar amounts is represented by y while the variable x represents the
purchases.
From this we can deduce the linear relationship
y=6.4554 x+0.3721
As the relationship between the two variables.
5 10 15 20 25 30 35 40 45 50
0
50
100
150
200
250
300
f(x) = 6.45539719002485 x + 0.372064169997032
R² = 0.97771404013974
Purchases vs Dollar amount
Purchases
Dollar amount
The value of R is obtained as 0.9888, this indicates that there is a very strong correlation
between, the volume of purchases and the total amount of expenditure in dollars.
In addition, the R squared is given as 0.9777, an indication that 97.77% of the changes in the
amount spent is due to the changes in the quantities being purchased by the consumers.
The equation obtained have a slope of 6.4554. This value means that should the quantity
being purchased increase by a single unit, the amount of dollar being spent will increase by
6.4545. Also, the equation has an intercept of 0.3721, this signals that when the unit of
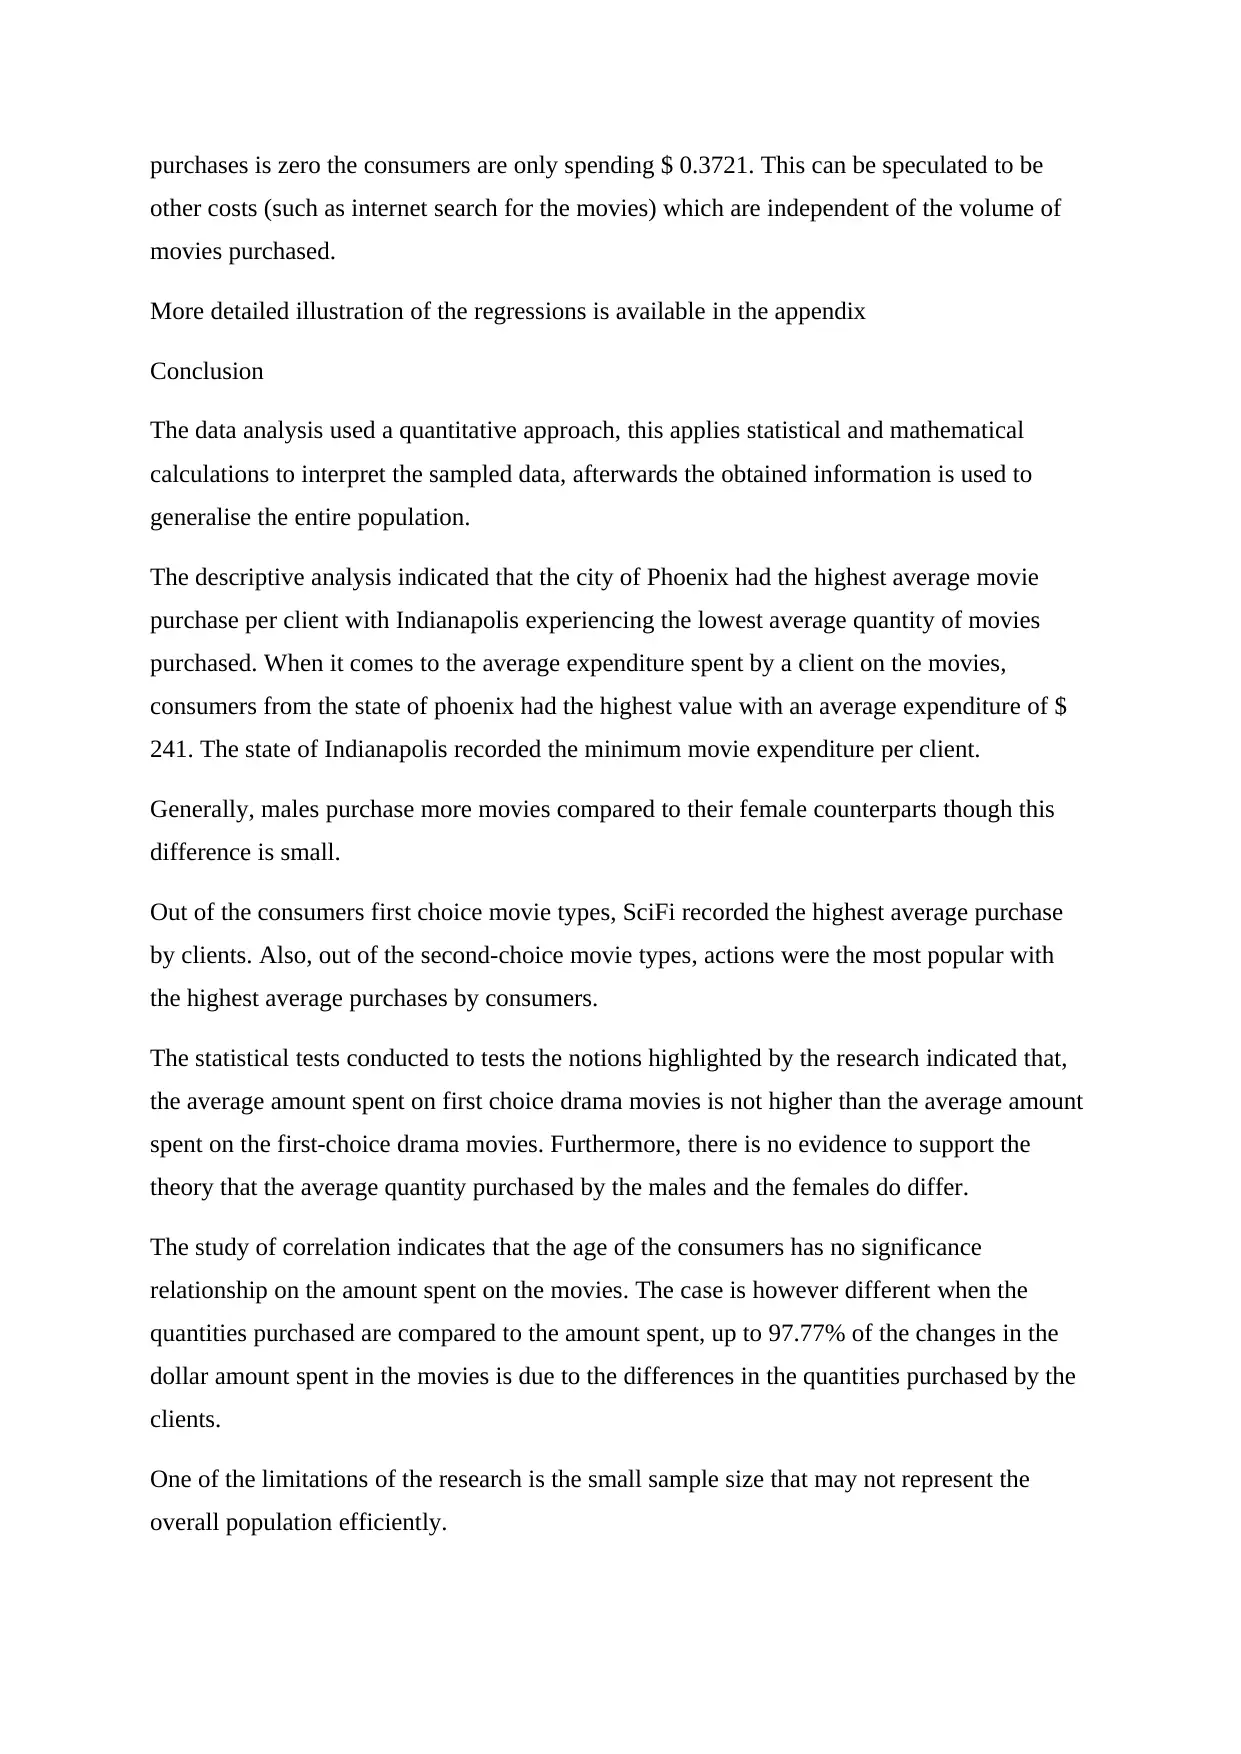
purchases is zero the consumers are only spending $ 0.3721. This can be speculated to be
other costs (such as internet search for the movies) which are independent of the volume of
movies purchased.
More detailed illustration of the regressions is available in the appendix
Conclusion
The data analysis used a quantitative approach, this applies statistical and mathematical
calculations to interpret the sampled data, afterwards the obtained information is used to
generalise the entire population.
The descriptive analysis indicated that the city of Phoenix had the highest average movie
purchase per client with Indianapolis experiencing the lowest average quantity of movies
purchased. When it comes to the average expenditure spent by a client on the movies,
consumers from the state of phoenix had the highest value with an average expenditure of $
241. The state of Indianapolis recorded the minimum movie expenditure per client.
Generally, males purchase more movies compared to their female counterparts though this
difference is small.
Out of the consumers first choice movie types, SciFi recorded the highest average purchase
by clients. Also, out of the second-choice movie types, actions were the most popular with
the highest average purchases by consumers.
The statistical tests conducted to tests the notions highlighted by the research indicated that,
the average amount spent on first choice drama movies is not higher than the average amount
spent on the first-choice drama movies. Furthermore, there is no evidence to support the
theory that the average quantity purchased by the males and the females do differ.
The study of correlation indicates that the age of the consumers has no significance
relationship on the amount spent on the movies. The case is however different when the
quantities purchased are compared to the amount spent, up to 97.77% of the changes in the
dollar amount spent in the movies is due to the differences in the quantities purchased by the
clients.
One of the limitations of the research is the small sample size that may not represent the
overall population efficiently.
⊘ This is a preview!⊘
Do you want full access?
Subscribe today to unlock all pages.
Trusted by 1+ million students worldwide
References
Andrew, G., 2008. Variance, analysis of. The new Palgrave dictionary of economics. 2nd ed.
Basingstoke, Hampshire New York: Palgrave Macmillan.
Bailey, R. A., 2008. Design of Comparative Experiments, s.l.: Cambridge University Press.
Klaus, H. & & Oscar, K., 2008). . Design and Analysis of Experiments. I and II ed. s.l.:Wiley.
Scott, J. A., 2012. Illusions in Regression Analysis. International Journal of Forecasting,
28(3), p. 689.
Willem, W., Baets, D. & Luc, B., 2008. ROC analysis in ordinal regression learning. Pattern
Recognition Letters, Volume 29, p. 1–9.
Paraphrase This Document
Need a fresh take? Get an instant paraphrase of this document with our AI Paraphraser
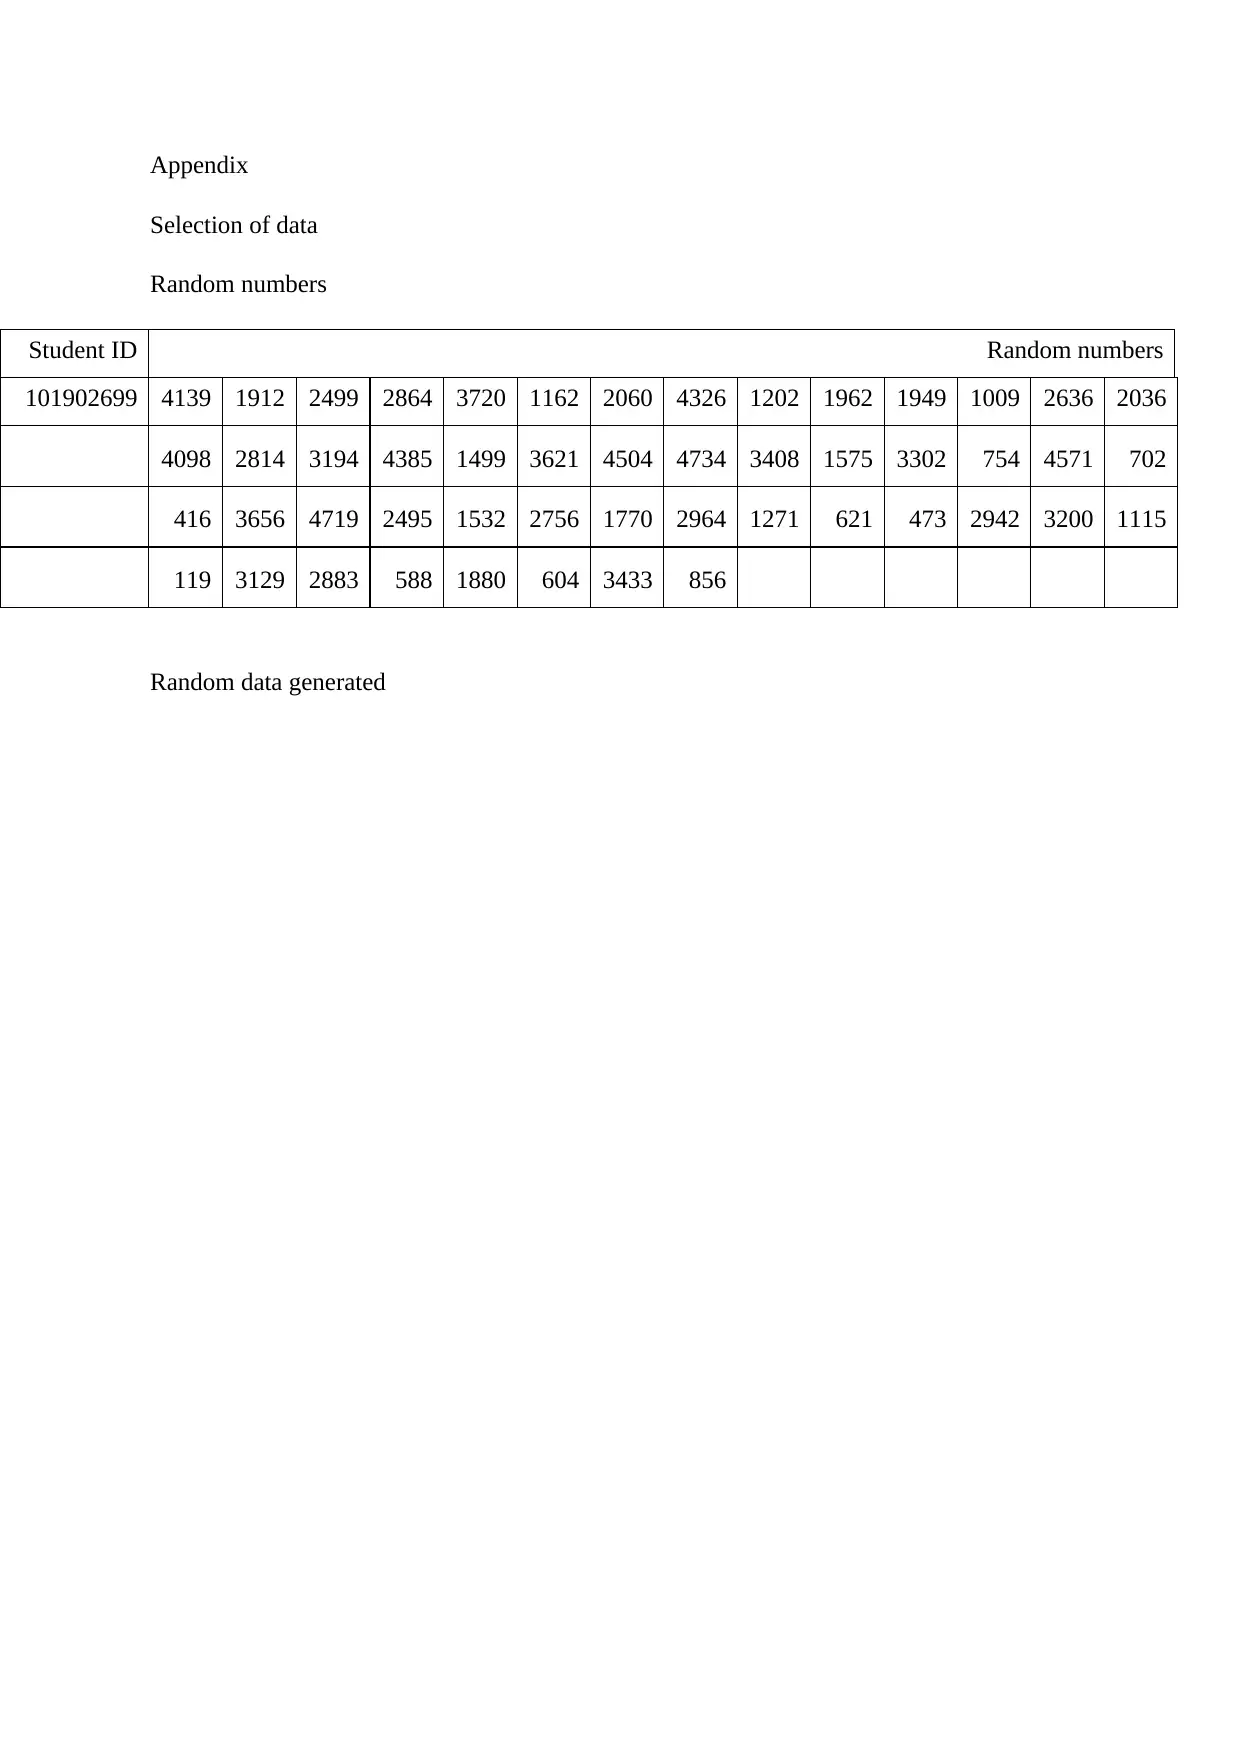
Appendix
Selection of data
Random numbers
Student ID Random numbers
101902699 4139 1912 2499 2864 3720 1162 2060 4326 1202 1962 1949 1009 2636 2036
4098 2814 3194 4385 1499 3621 4504 4734 3408 1575 3302 754 4571 702
416 3656 4719 2495 1532 2756 1770 2964 1271 621 473 2942 3200 1115
119 3129 2883 588 1880 604 3433 856
Random data generated
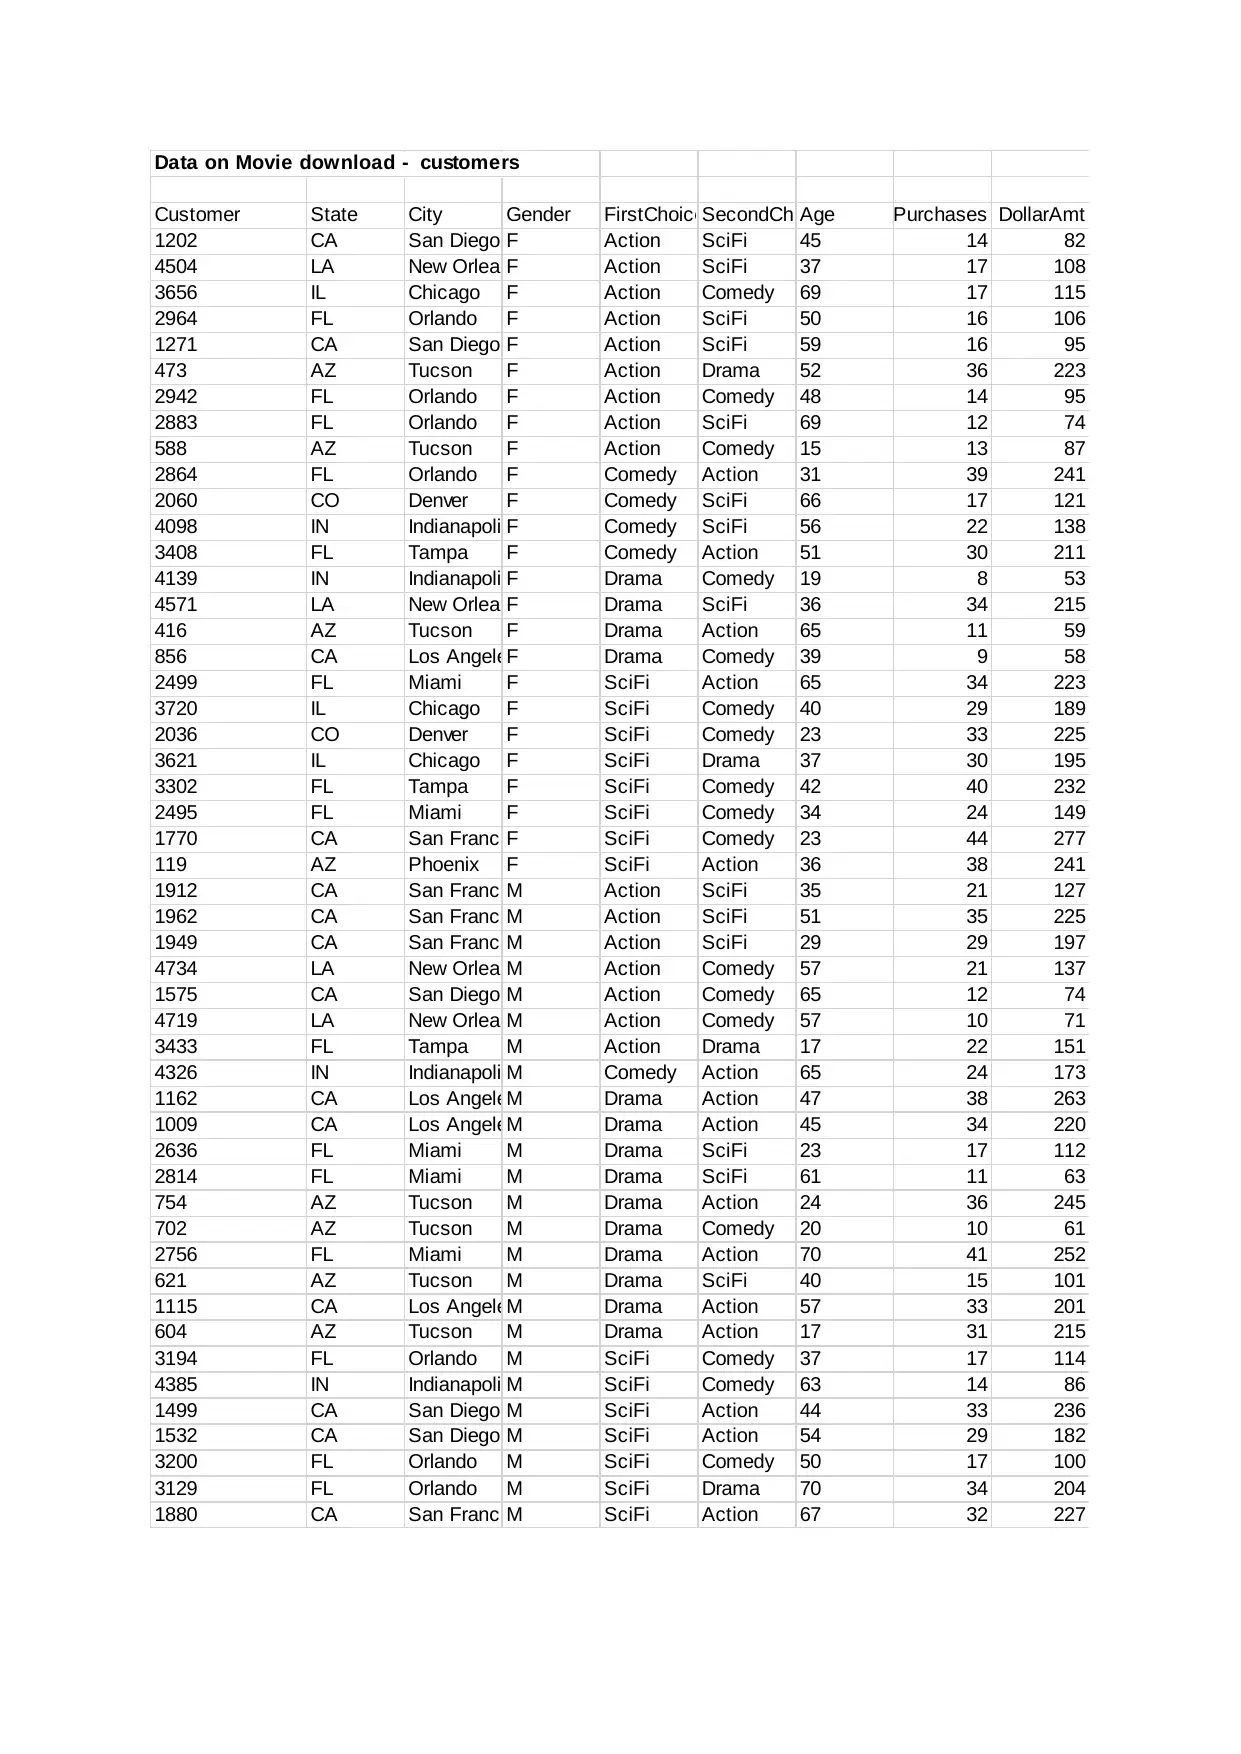
Data on Movie download - customers
Customer State City Gender FirstChoiceSecondChoiceAge Purchases DollarAmt
1202 CA San Diego F Action SciFi 45 14 82
4504 LA New OrleansF Action SciFi 37 17 108
3656 IL Chicago F Action Comedy 69 17 115
2964 FL Orlando F Action SciFi 50 16 106
1271 CA San Diego F Action SciFi 59 16 95
473 AZ Tucson F Action Drama 52 36 223
2942 FL Orlando F Action Comedy 48 14 95
2883 FL Orlando F Action SciFi 69 12 74
588 AZ Tucson F Action Comedy 15 13 87
2864 FL Orlando F Comedy Action 31 39 241
2060 CO Denver F Comedy SciFi 66 17 121
4098 IN IndianapolisF Comedy SciFi 56 22 138
3408 FL Tampa F Comedy Action 51 30 211
4139 IN IndianapolisF Drama Comedy 19 8 53
4571 LA New OrleansF Drama SciFi 36 34 215
416 AZ Tucson F Drama Action 65 11 59
856 CA Los AngelesF Drama Comedy 39 9 58
2499 FL Miami F SciFi Action 65 34 223
3720 IL Chicago F SciFi Comedy 40 29 189
2036 CO Denver F SciFi Comedy 23 33 225
3621 IL Chicago F SciFi Drama 37 30 195
3302 FL Tampa F SciFi Comedy 42 40 232
2495 FL Miami F SciFi Comedy 34 24 149
1770 CA San FranciscoF SciFi Comedy 23 44 277
119 AZ Phoenix F SciFi Action 36 38 241
1912 CA San FranciscoM Action SciFi 35 21 127
1962 CA San FranciscoM Action SciFi 51 35 225
1949 CA San FranciscoM Action SciFi 29 29 197
4734 LA New OrleansM Action Comedy 57 21 137
1575 CA San Diego M Action Comedy 65 12 74
4719 LA New OrleansM Action Comedy 57 10 71
3433 FL Tampa M Action Drama 17 22 151
4326 IN IndianapolisM Comedy Action 65 24 173
1162 CA Los AngelesM Drama Action 47 38 263
1009 CA Los AngelesM Drama Action 45 34 220
2636 FL Miami M Drama SciFi 23 17 112
2814 FL Miami M Drama SciFi 61 11 63
754 AZ Tucson M Drama Action 24 36 245
702 AZ Tucson M Drama Comedy 20 10 61
2756 FL Miami M Drama Action 70 41 252
621 AZ Tucson M Drama SciFi 40 15 101
1115 CA Los AngelesM Drama Action 57 33 201
604 AZ Tucson M Drama Action 17 31 215
3194 FL Orlando M SciFi Comedy 37 17 114
4385 IN IndianapolisM SciFi Comedy 63 14 86
1499 CA San Diego M SciFi Action 44 33 236
1532 CA San Diego M SciFi Action 54 29 182
3200 FL Orlando M SciFi Comedy 50 17 100
3129 FL Orlando M SciFi Drama 70 34 204
1880 CA San FranciscoM SciFi Action 67 32 227
⊘ This is a preview!⊘
Do you want full access?
Subscribe today to unlock all pages.
Trusted by 1+ million students worldwide
1 out of 15
Related Documents


Your All-in-One AI-Powered Toolkit for Academic Success.
+13062052269
info@desklib.com
Available 24*7 on WhatsApp / Email
![[object Object]](/_next/static/media/star-bottom.7253800d.svg)
Unlock your academic potential
Copyright © 2020–2026 A2Z Services. All Rights Reserved. Developed and managed by ZUCOL.