Financial Statistics Homework: Ratio Analysis and Statistics

Verified

Added on  2020/04/15

|6
|854
|250
Homework Assignment
AI Summary
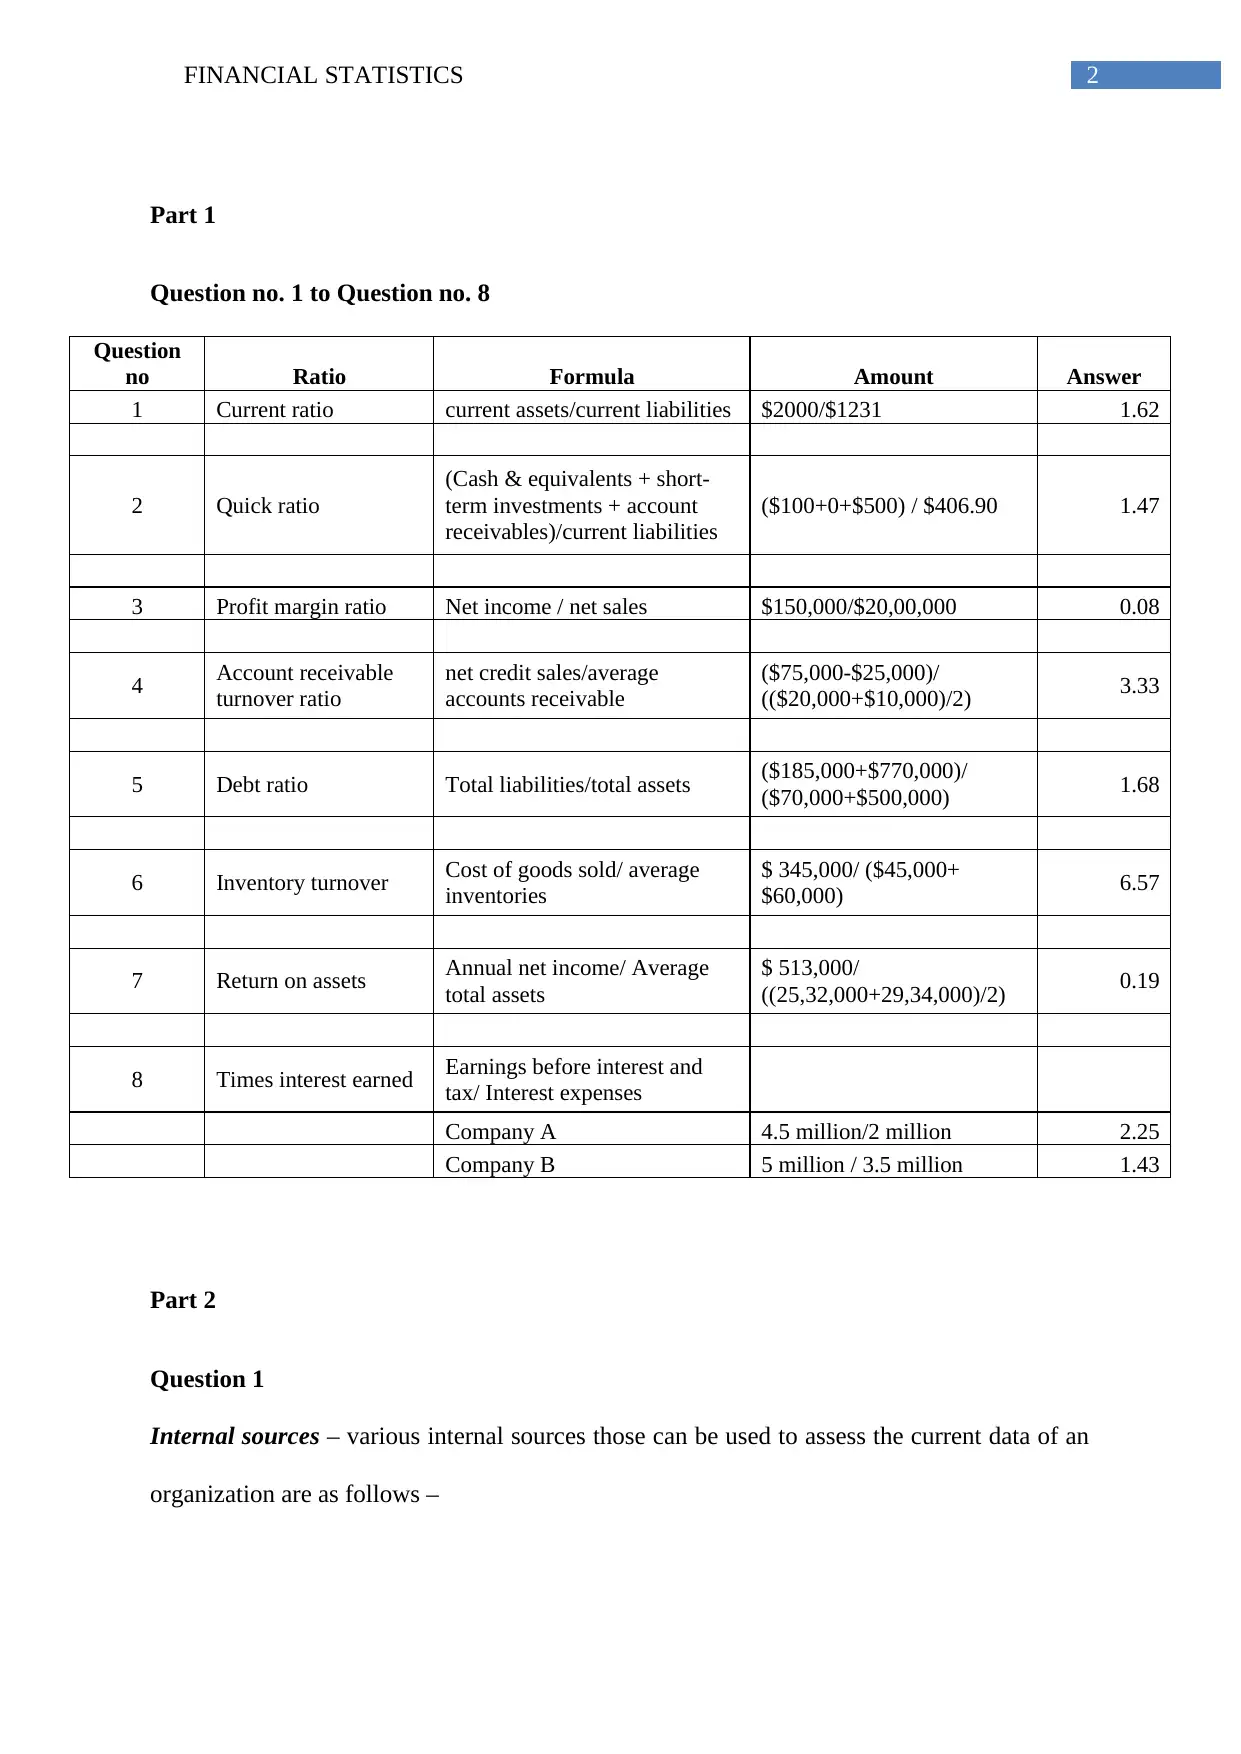
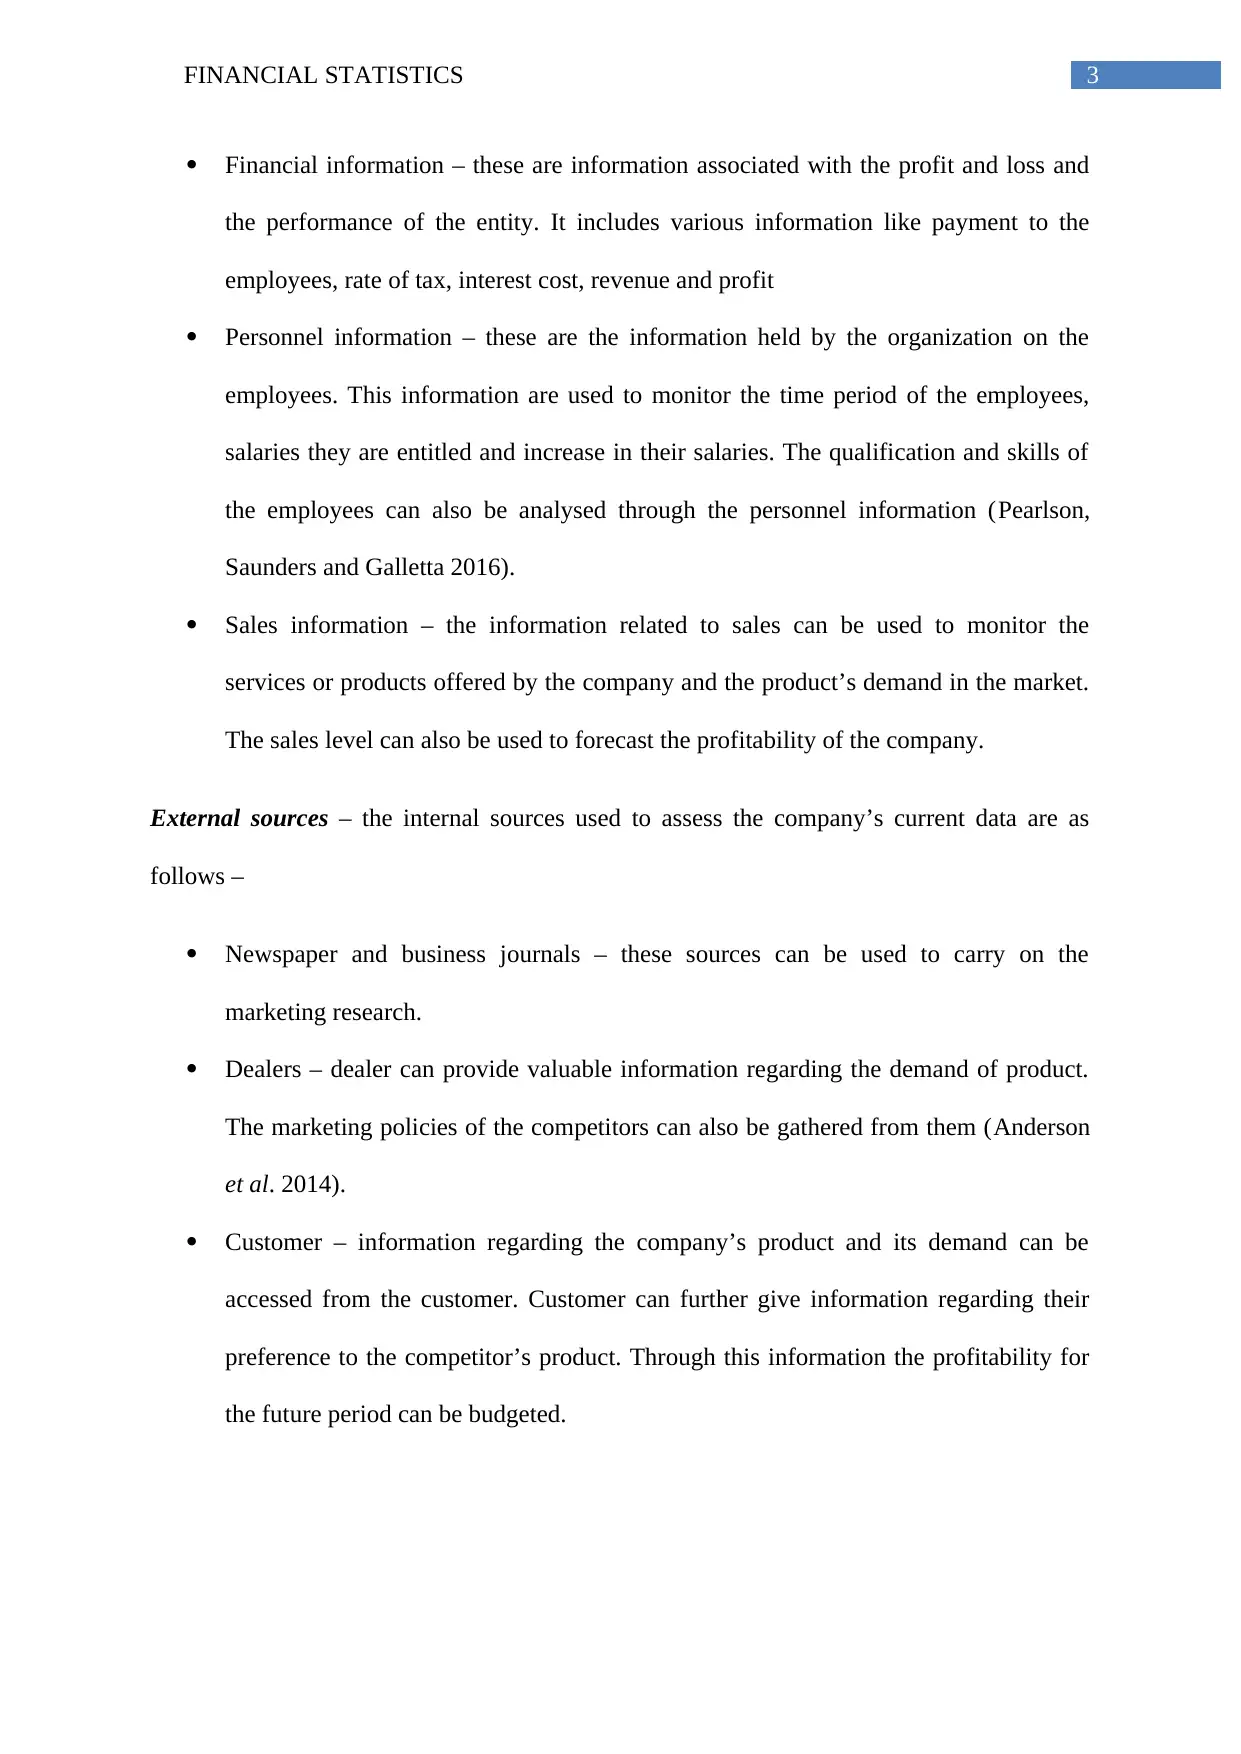
This document presents a comprehensive solution to a financial statistics homework assignment. The solution is divided into two parts. Part 1 focuses on ratio analysis, calculating and interpreting various financial ratios like current ratio, quick ratio, profit margin, accounts receivable turnover, debt ratio, inventory turnover, return on assets, and times interest earned. Part 2 delves into the examination of internal and external sources of financial data, including financial information, personnel information, sales data, newspapers, business journals, dealers, and customers. The assignment also explains the difference between descriptive and inferential statistics, providing practical examples to illustrate their applications. References to relevant academic literature are also included.
tabler-icon-diamond-filled.svg

Contribute Materials

Your contribution can guide someone’s learning journey. Share your documents today.
Document Page
Running head: FINANCIAL STATISTICS
Financial statistics
Name of the student
Name of the university
Author note
tabler-icon-diamond-filled.svg

Secure Best Marks with AI Grader

Need help grading? Try our AI Grader for instant feedback on your assignments.
Document Page
1FINANCIAL STATISTICS
Table of Contents
Part 1..........................................................................................................................................2
Question no. 1 to Question no. 8............................................................................................2
Part 2..........................................................................................................................................2
Question 1..............................................................................................................................2
Question 2..............................................................................................................................4
Reference....................................................................................................................................5
Document Page
2FINANCIAL STATISTICS
Part 1
Question no. 1 to Question no. 8
Question
no Ratio Formula Amount Answer
1 Current ratio current assets/current liabilities $2000/$1231 1.62
2 Quick ratio
(Cash & equivalents + short-
term investments + account
receivables)/current liabilities
($100+0+$500) / $406.90 1.47
3 Profit margin ratio Net income / net sales $150,000/$20,00,000 0.08
4 Account receivable
turnover ratio
net credit sales/average
accounts receivable
($75,000-$25,000)/
(($20,000+$10,000)/2) 3.33
5 Debt ratio Total liabilities/total assets ($185,000+$770,000)/
($70,000+$500,000) 1.68
6 Inventory turnover Cost of goods sold/ average
inventories
$ 345,000/ ($45,000+
$60,000) 6.57
7 Return on assets Annual net income/ Average
total assets
$ 513,000/
((25,32,000+29,34,000)/2) 0.19
8 Times interest earned Earnings before interest and
tax/ Interest expenses
Company A 4.5 million/2 million 2.25
Company B 5 million / 3.5 million 1.43
Part 2
Question 1
Internal sources – various internal sources those can be used to assess the current data of an
organization are as follows –
Document Page
3FINANCIAL STATISTICS
Financial information – these are information associated with the profit and loss and
the performance of the entity. It includes various information like payment to the
employees, rate of tax, interest cost, revenue and profit
Personnel information – these are the information held by the organization on the
employees. This information are used to monitor the time period of the employees,
salaries they are entitled and increase in their salaries. The qualification and skills of
the employees can also be analysed through the personnel information (Pearlson,
Saunders and Galletta 2016).
Sales information – the information related to sales can be used to monitor the
services or products offered by the company and the product’s demand in the market.
The sales level can also be used to forecast the profitability of the company.
External sources – the internal sources used to assess the company’s current data are as
follows –
Newspaper and business journals – these sources can be used to carry on the
marketing research.
Dealers – dealer can provide valuable information regarding the demand of product.
The marketing policies of the competitors can also be gathered from them (Anderson
et al. 2014).
Customer – information regarding the company’s product and its demand can be
accessed from the customer. Customer can further give information regarding their
preference to the competitor’s product. Through this information the profitability for
the future period can be budgeted.
tabler-icon-diamond-filled.svg

Secure Best Marks with AI Grader

Need help grading? Try our AI Grader for instant feedback on your assignments.
Document Page
4FINANCIAL STATISTICS
Question 2
Descriptive statistics – this is used for describing basic features of data under any study. It
provides easy and simple summaries regarding measures and sample. Along with the simple
analysis of graphics, it forms basis for almost all the quantitative analysis of the data. It
provides the quick method for making the comparison among various data sets and identifies
the largest and smallest trends, value or changes for the time period. For example, if a pet
shop deals in cats, fish, birds and dogs and the shop sells 100 pets and out of 100, 40 were
dogs, then one of the description for the data regarding selling of the pets will be 40% of the
sales were dogs (Holcomb 2016).
Inferential statistics – this statistics is used to infer the sample from the possible thinking of
the population. In other words, inferential statistics are used for making the judgements
regarding the probability that the observed differences among the groups are the dependable
one or it may happen by the chance of the study. For example, if out of 500 randomly
selected people in Sydney, Australia, 350 people had their last name as Gilchrist, as per the
inferential statistics, the statement will be – 70% of people living in Sydney have their last
name as Gilchrist (Lowry 2014).
Document Page
5FINANCIAL STATISTICS
Reference
Anderson, D.R., Sweeney, D.J., Williams, T.A., Camm, J.D. and Cochran, J.J.,
2014. Statistics for business & economics, revised. Cengage Learning.
Holcomb, Z.C., 2016. Fundamentals of descriptive statistics. Routledge.
Lowry, R., 2014. Concepts and applications of inferential statistics.
Pearlson, K.E., Saunders, C.S. and Galletta, D.F., 2016. Managing and Using Information
Systems, Binder Ready Version: A Strategic Approach. John Wiley & Sons.
chevron_up_icon
1 out of 6
circle_padding
hide_on_mobile
zoom_out_icon
logo.png

Your All-in-One AI-Powered Toolkit for Academic Success.

Available 24*7 on WhatsApp / Email

[object Object]