Report: Financial and Strategic Analysis of the Unilever Company
VerifiedAdded on 2022/12/30
|24
|5258
|54
Report
AI Summary
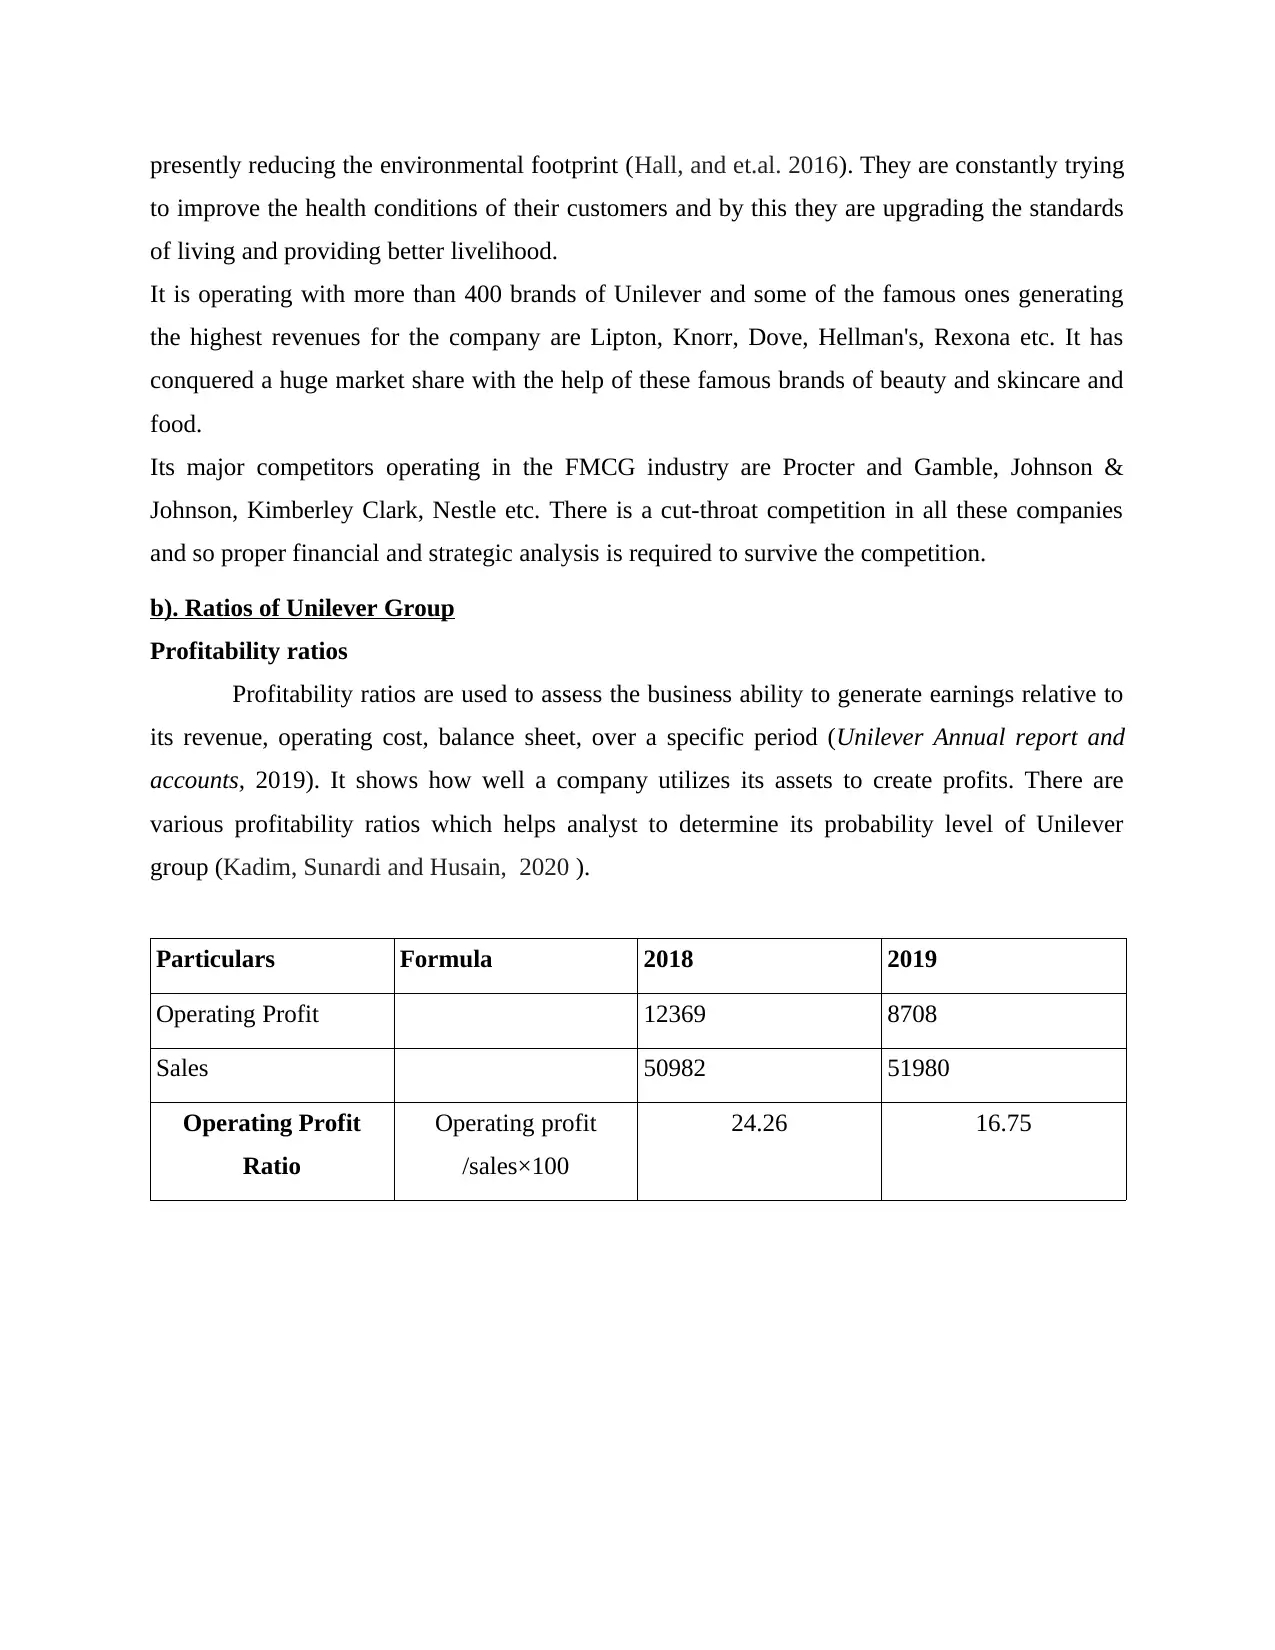
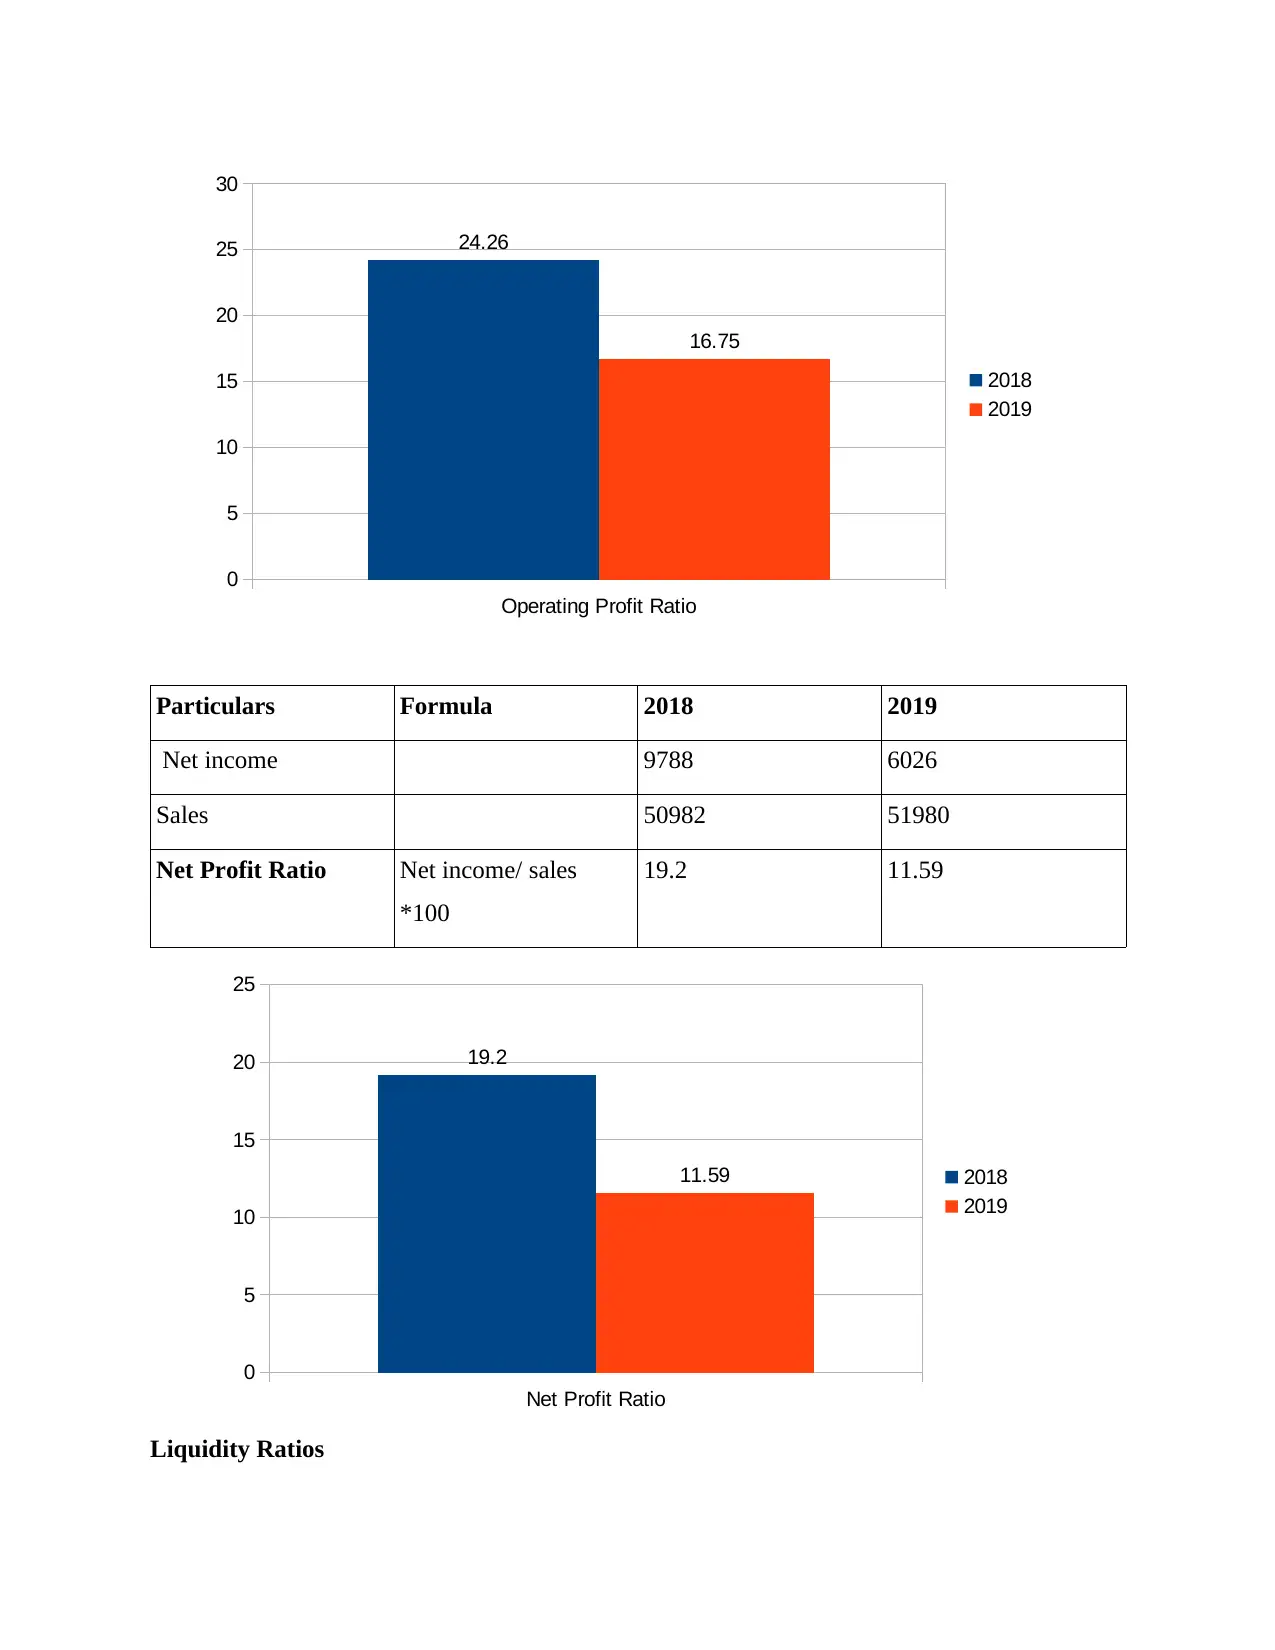
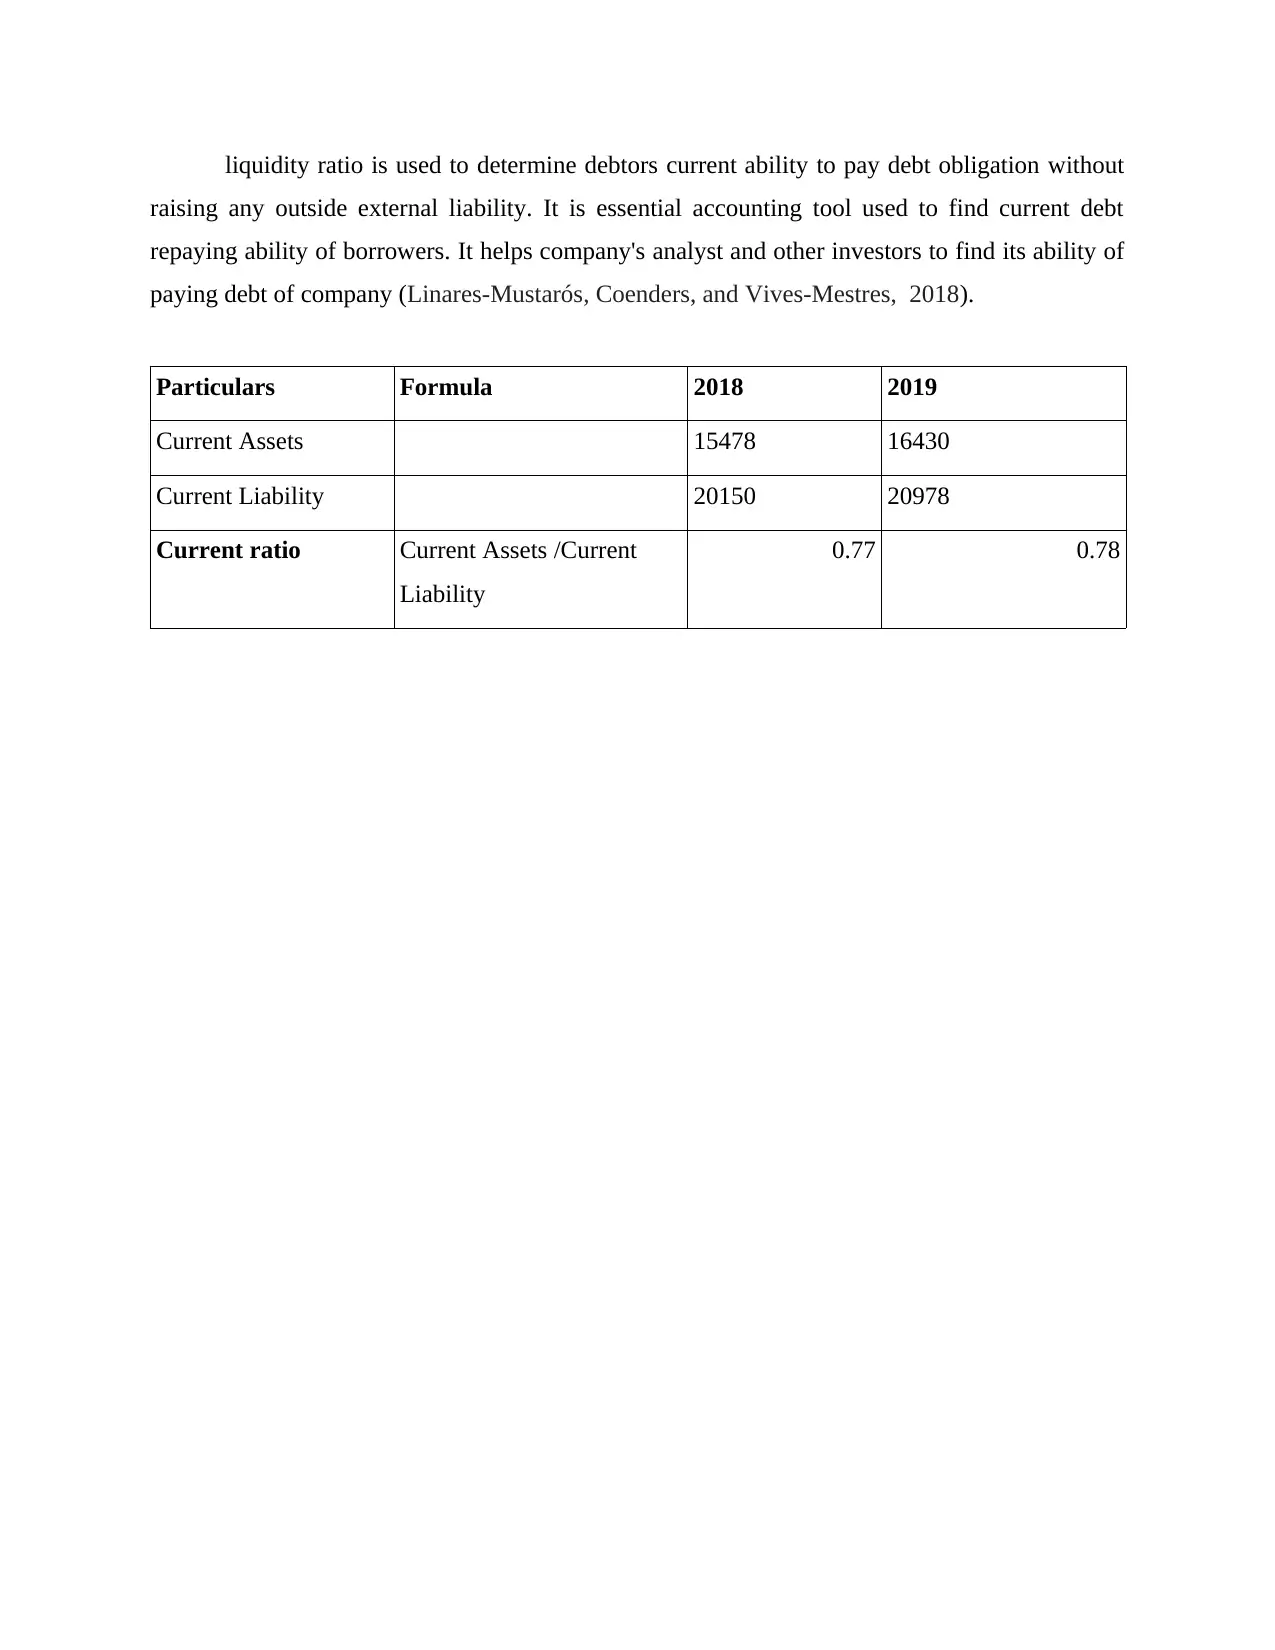
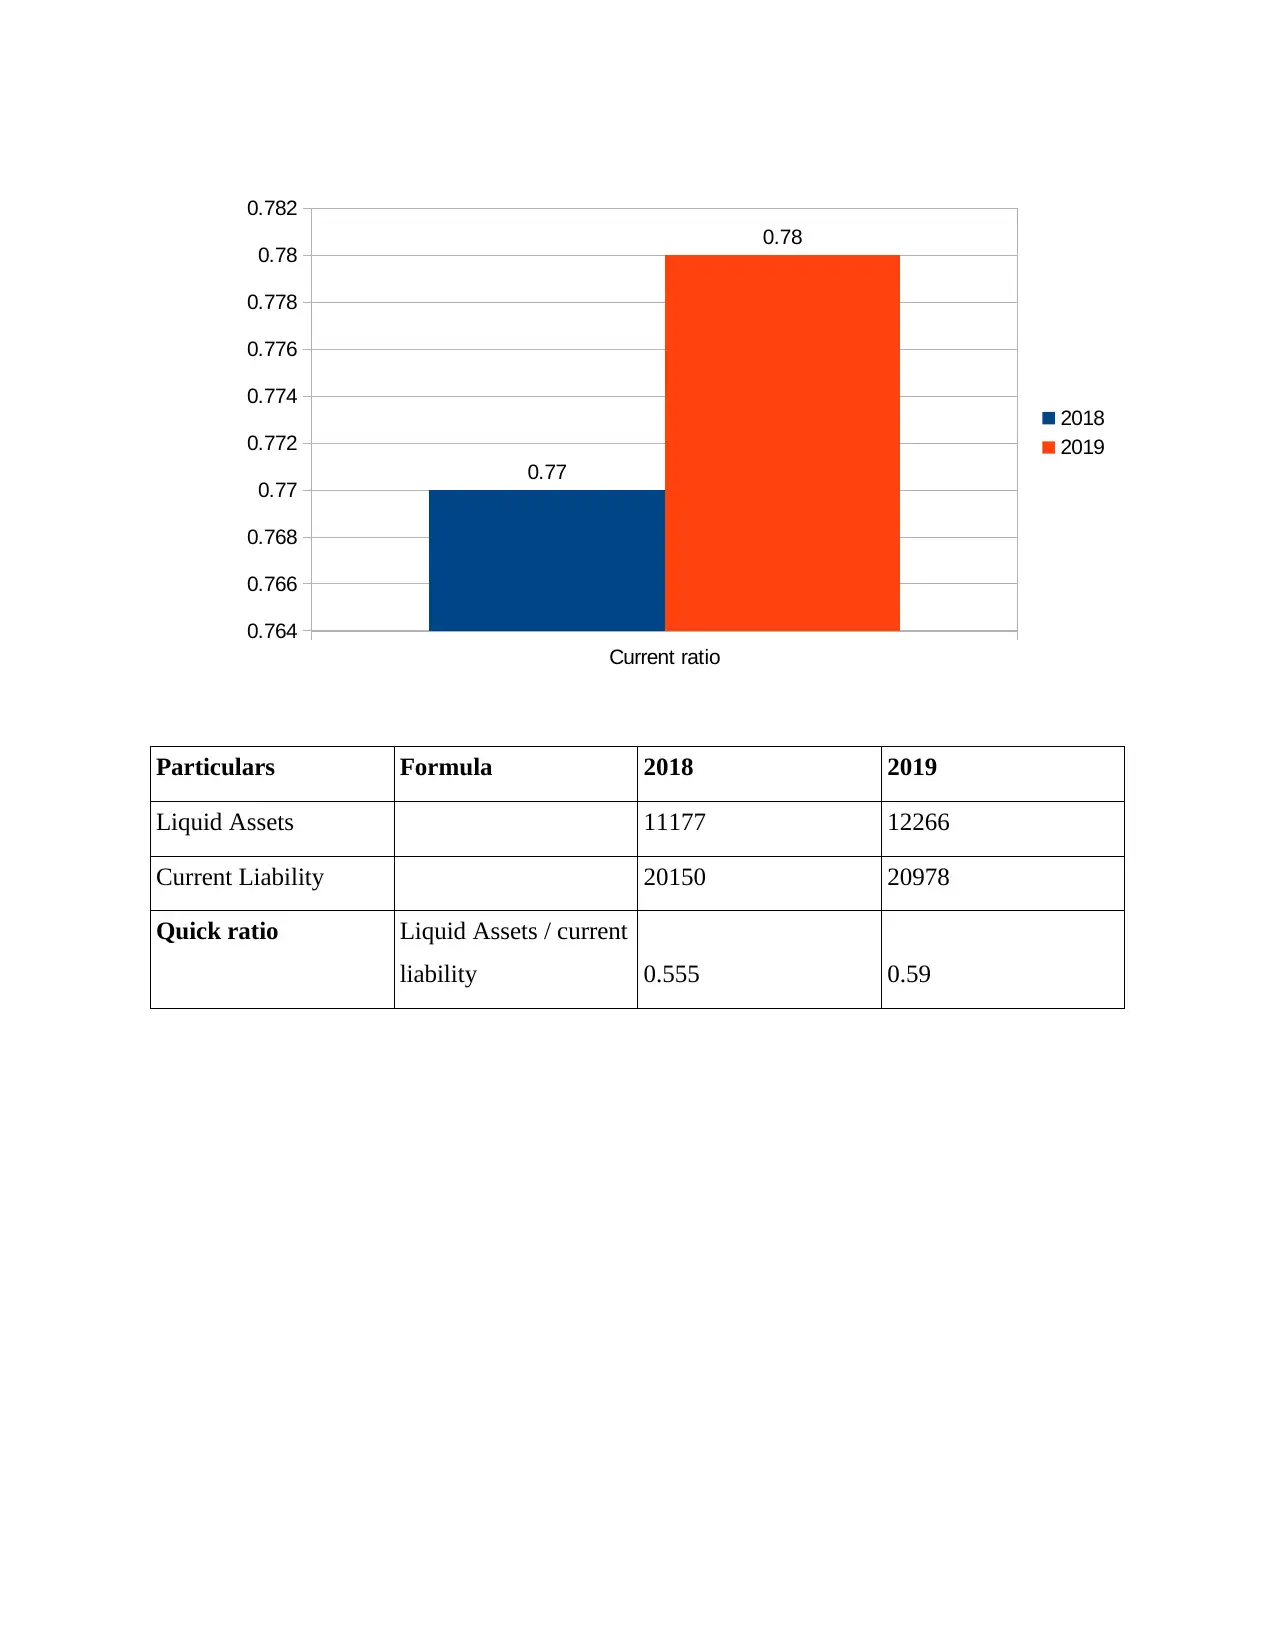
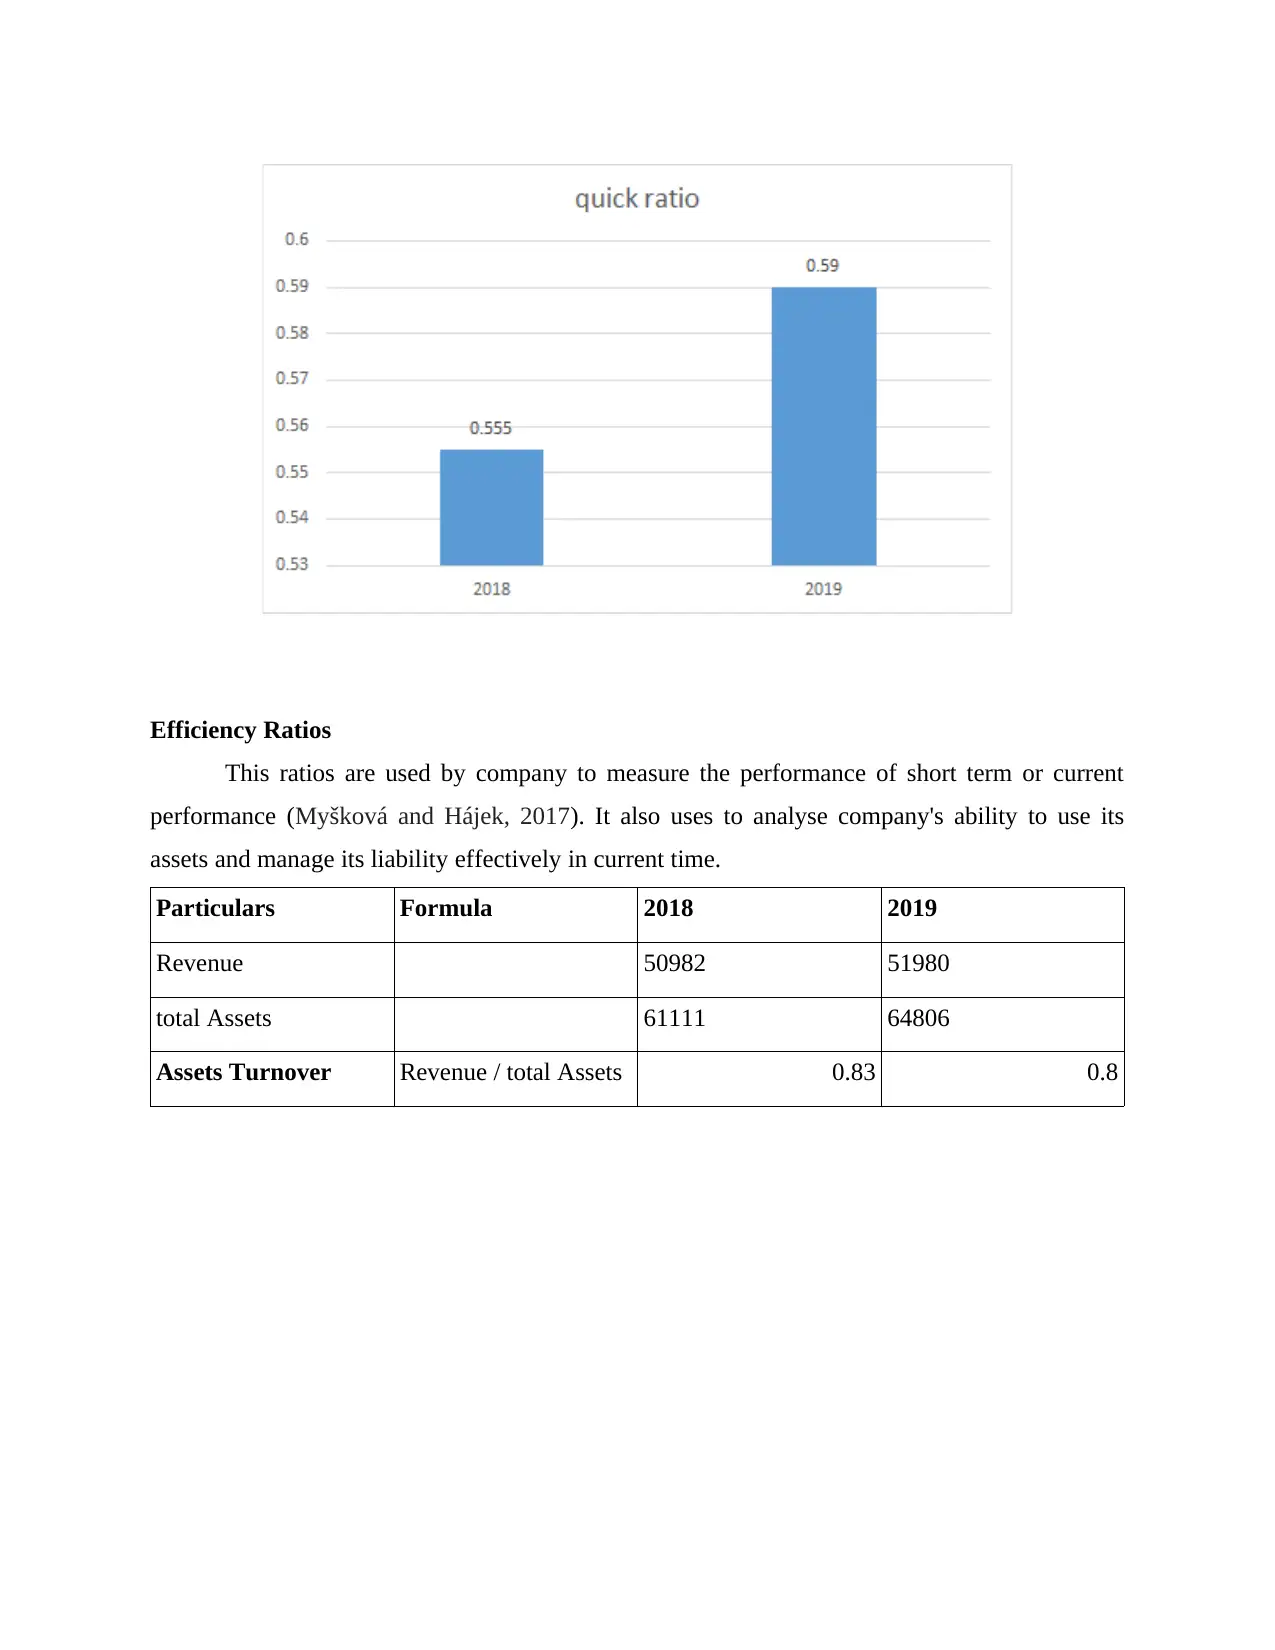
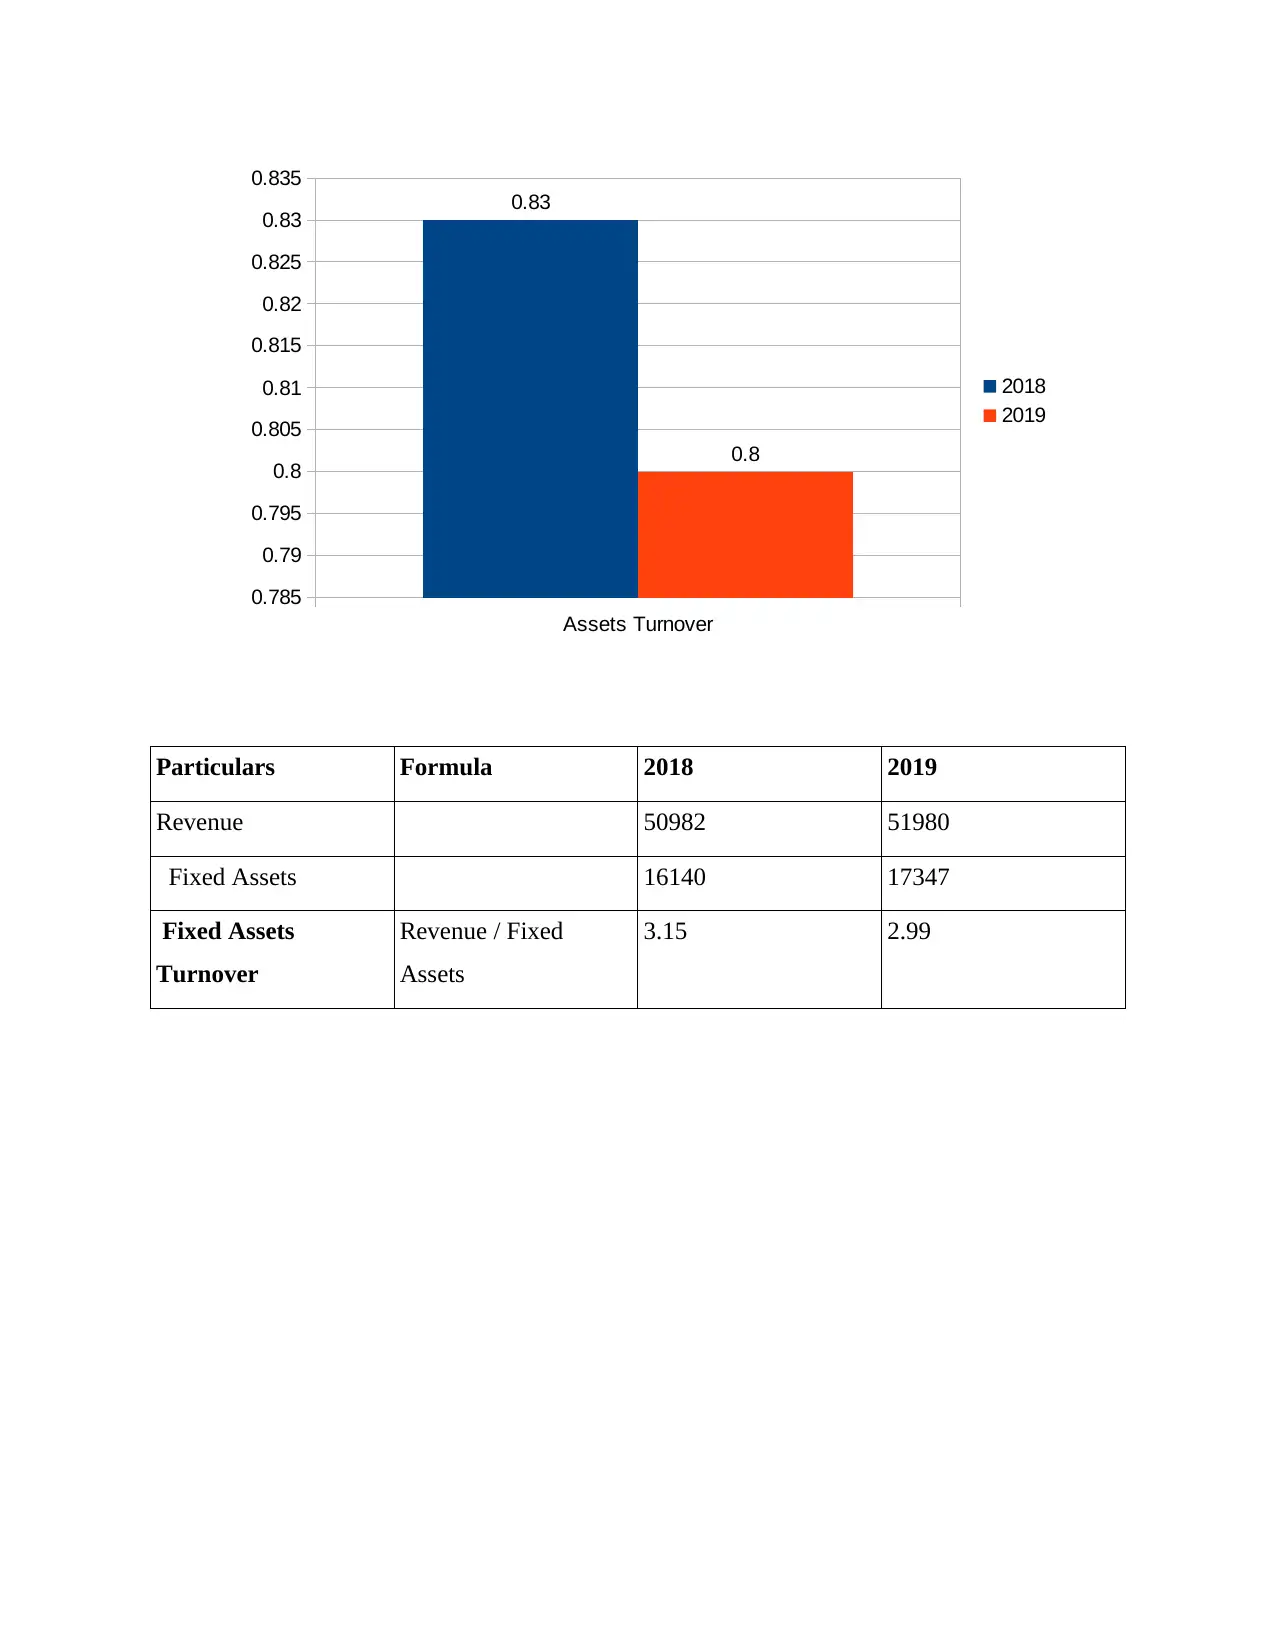
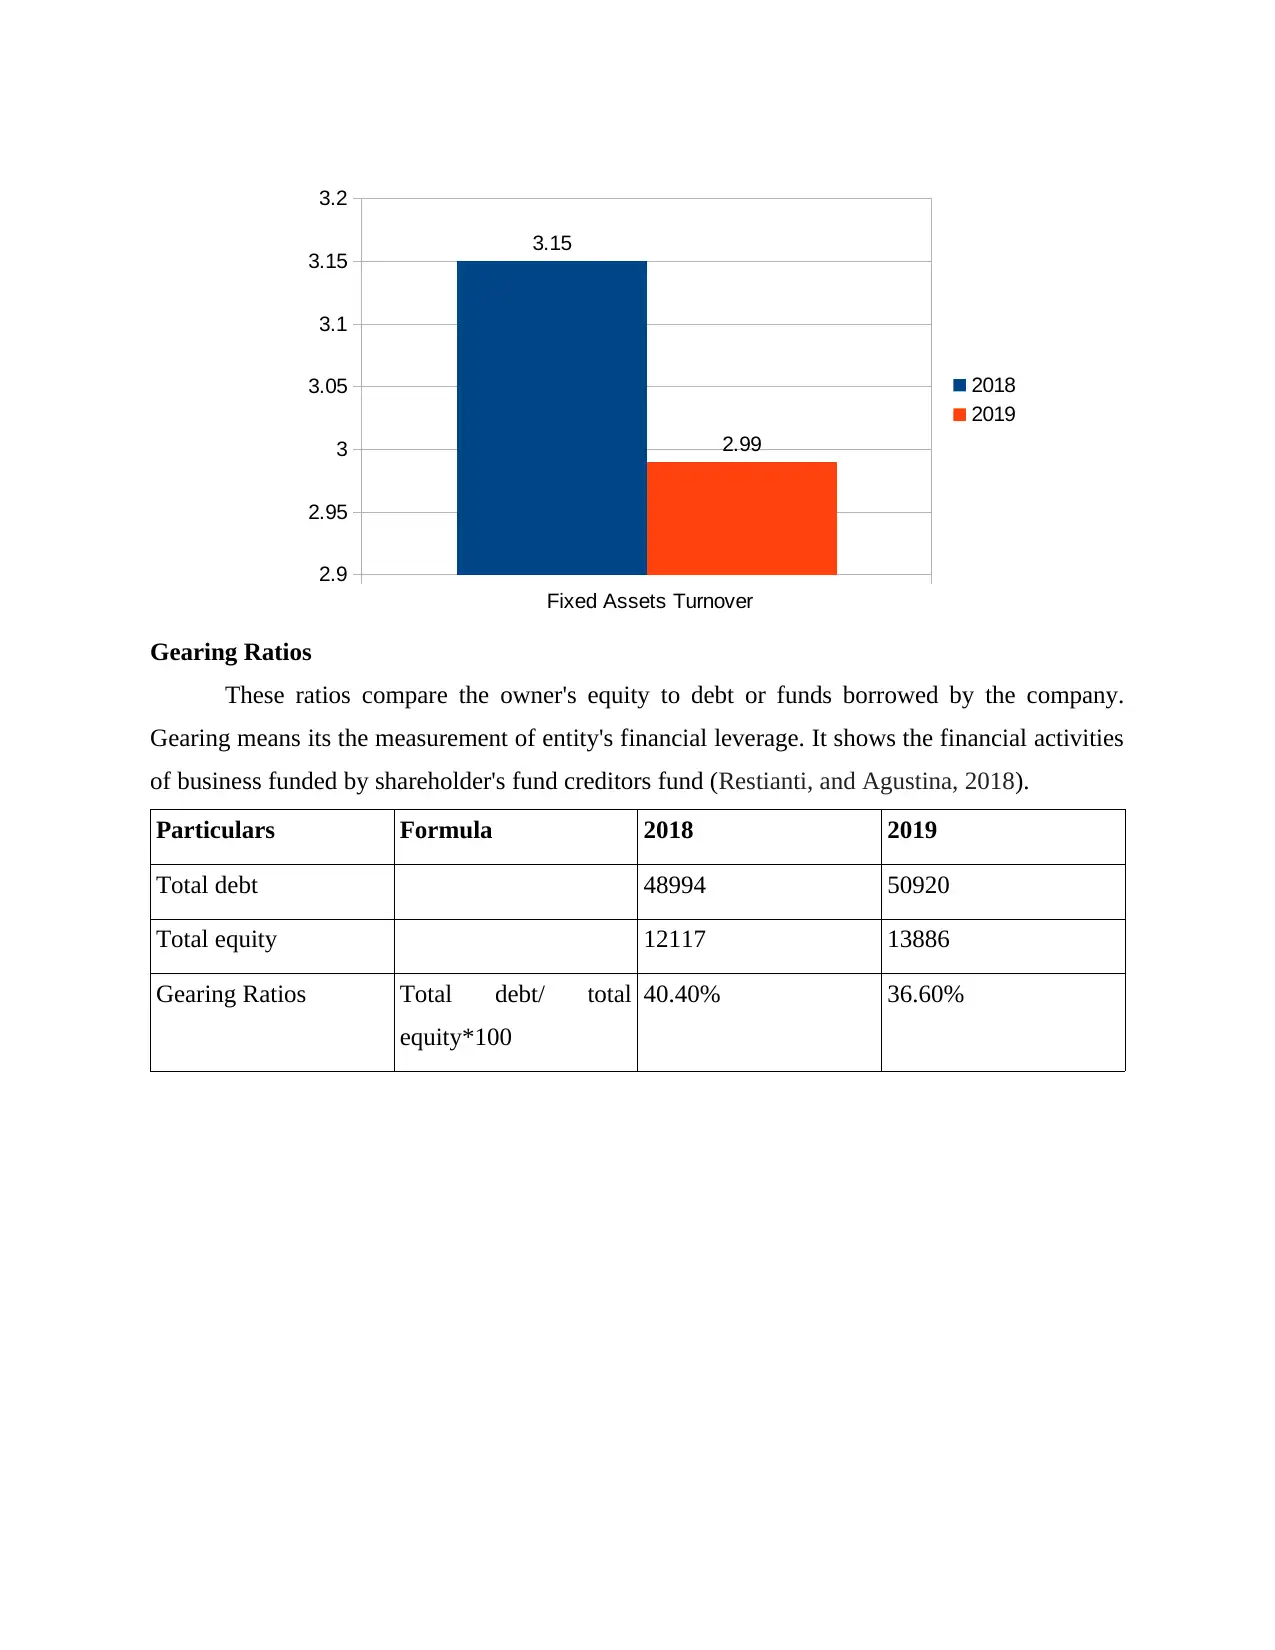
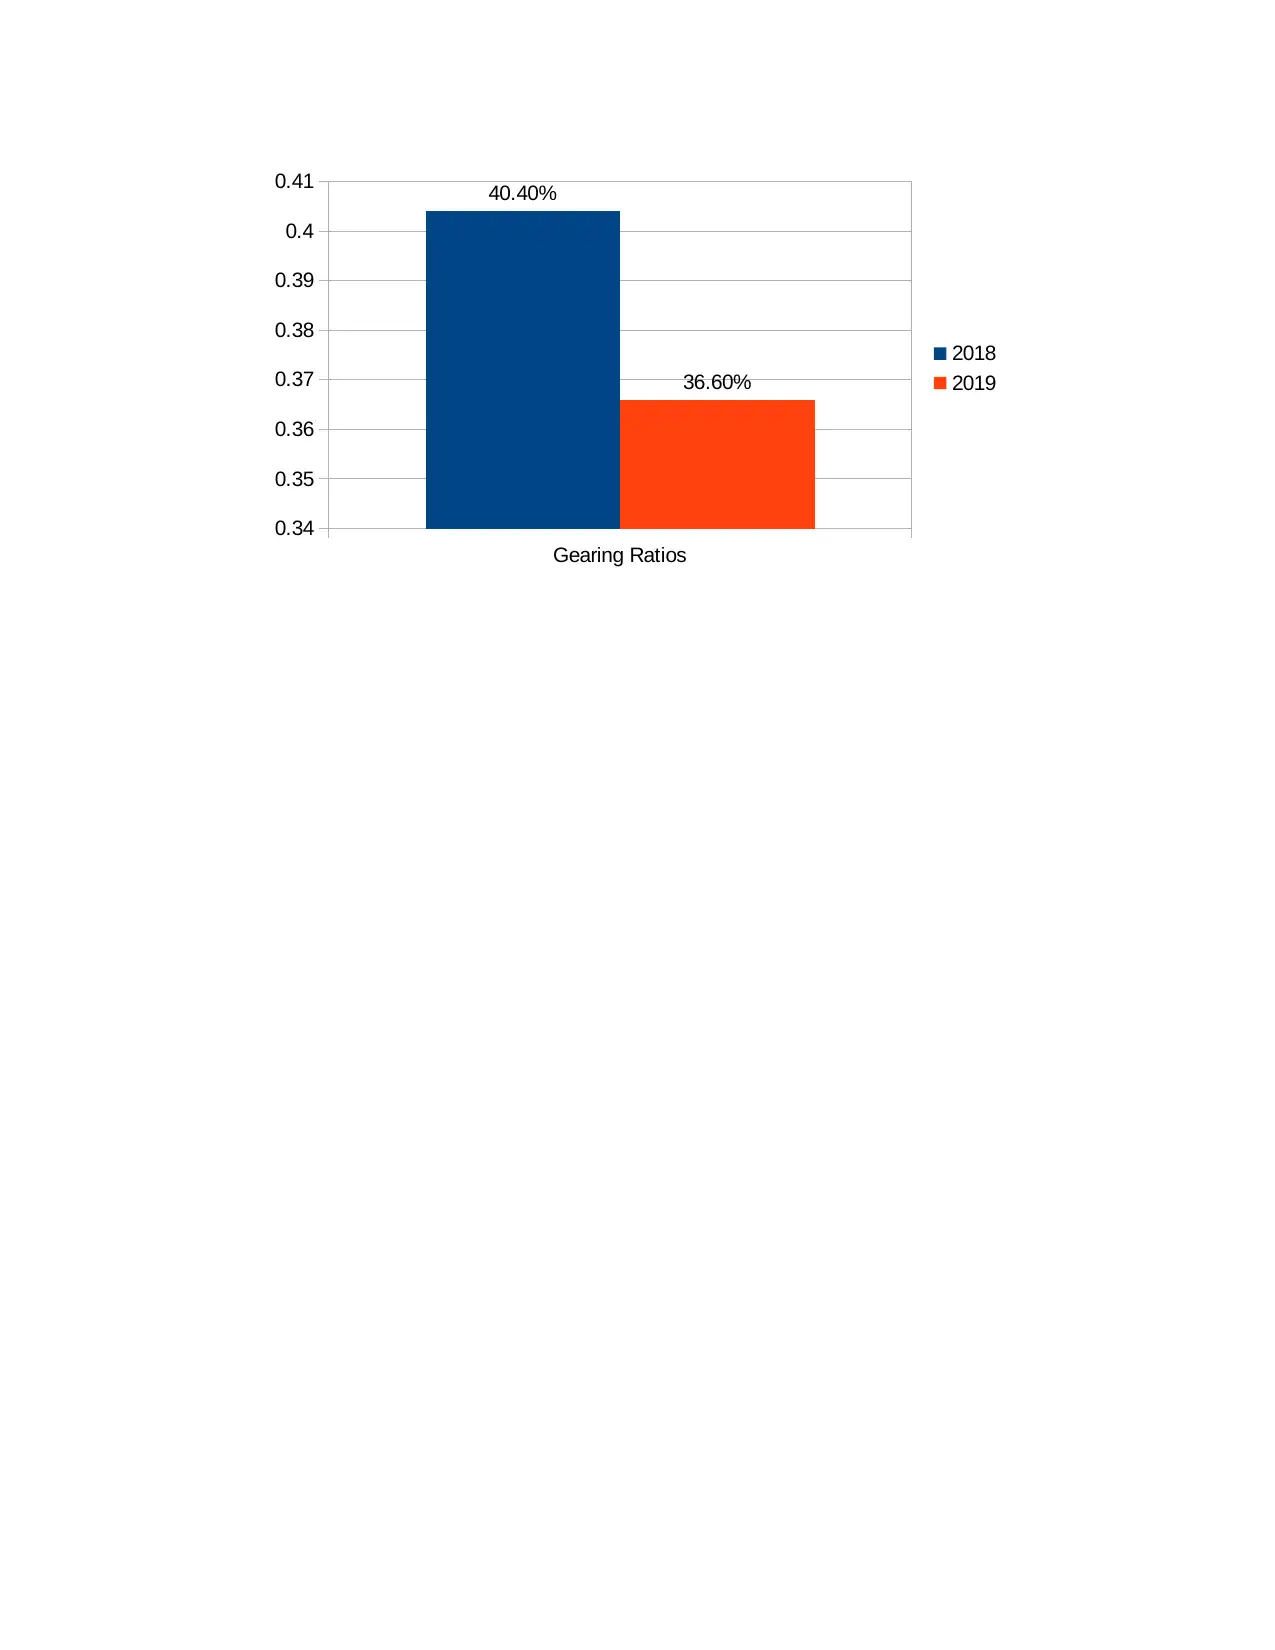
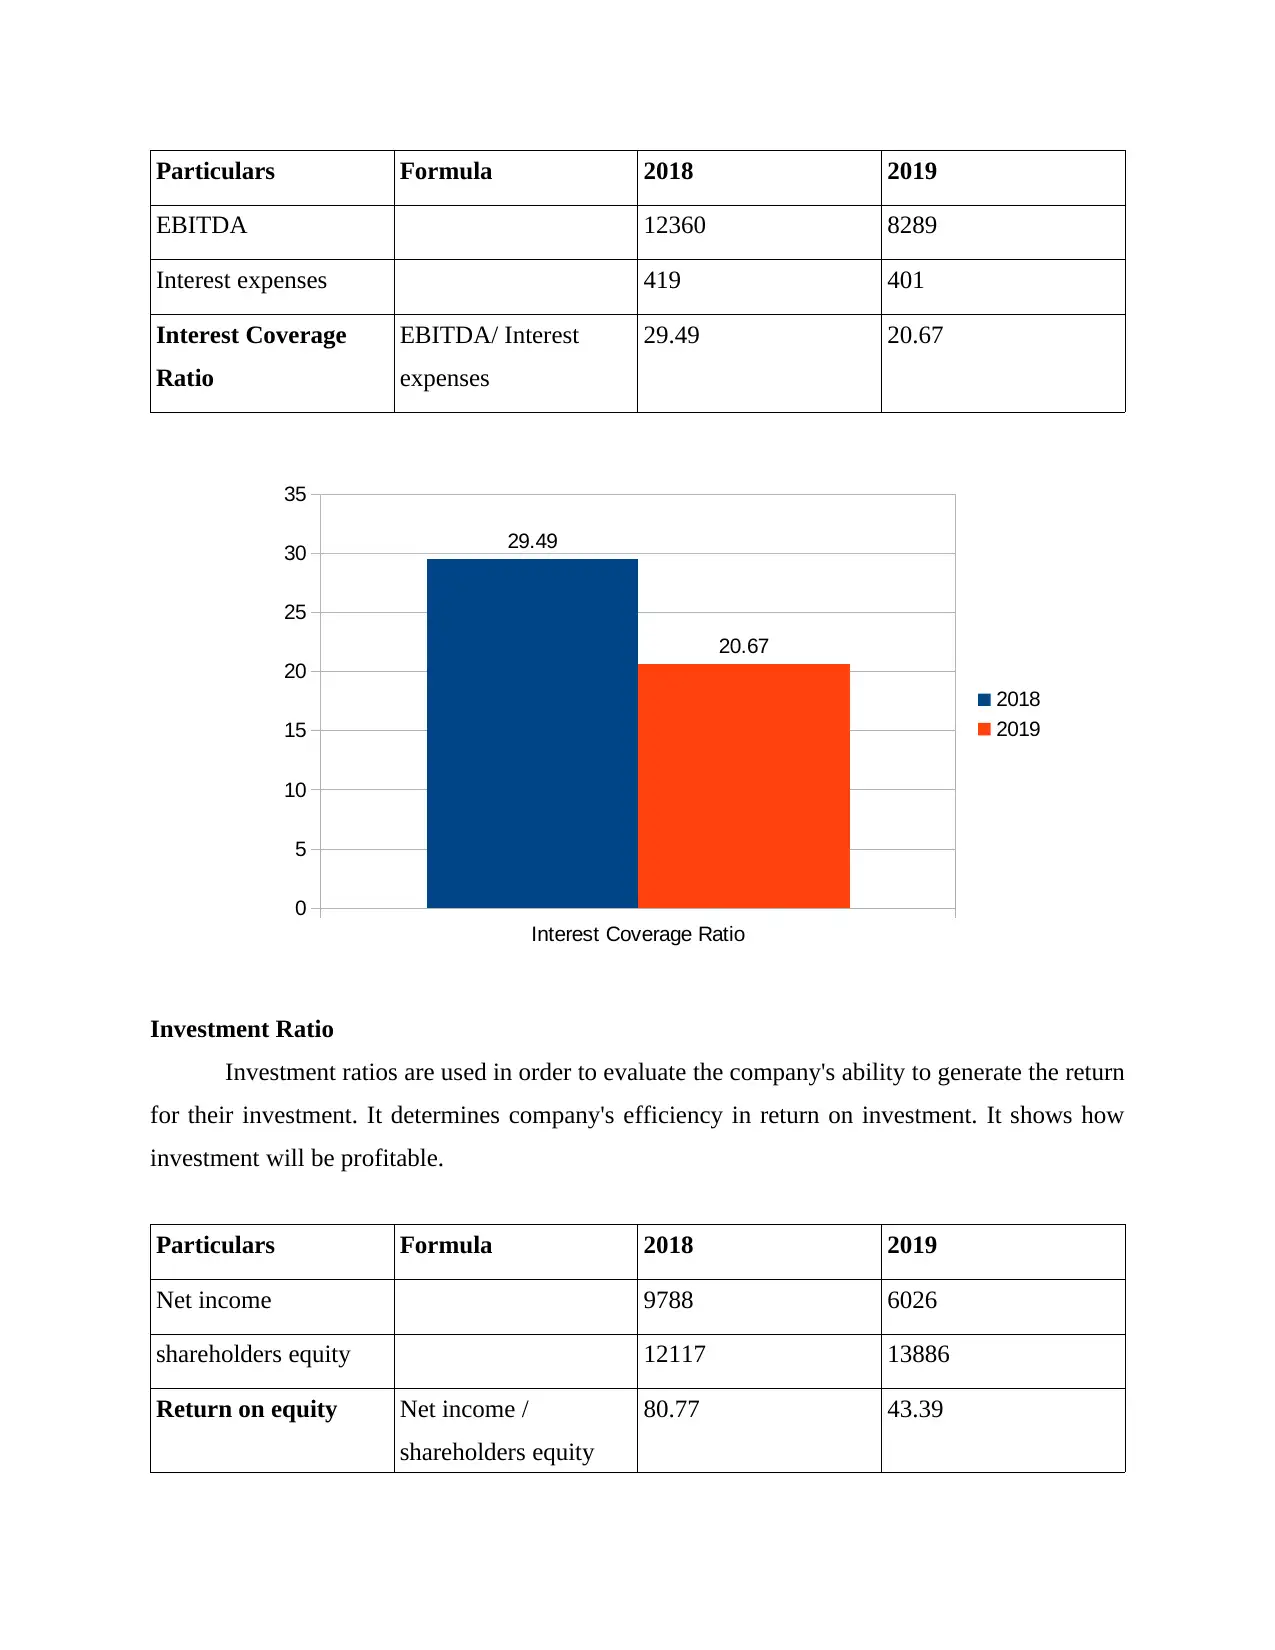
This report presents a comprehensive financial and strategic analysis of Unilever, a major player in the fast-moving consumer goods (FMCG) industry. It begins with an introduction to Unilever, detailing its operations and the FMCG market. The main body of the report delves into a detailed financial analysis, calculating and interpreting key financial ratios such as profitability, liquidity, efficiency, gearing, and investment ratios, using data from two consecutive years. The analysis includes operating profit ratio, net profit ratio, current ratio, quick ratio, assets turnover, fixed assets turnover, gearing ratios, interest coverage and return on equity. Furthermore, the report incorporates a strategic analysis of Unilever, employing a SWOT (Strengths, Weaknesses, Opportunities, and Threats) analysis to assess its position within the industry. Finally, the report concludes with investment recommendations, providing rationale for potential investors based on the financial and strategic findings.

ACCOUNTANCY AND
FINANCE
FINANCE
Paraphrase This Document
Need a fresh take? Get an instant paraphrase of this document with our AI Paraphraser

Table of Contents
INTRODUCTION...........................................................................................................................3
MAIN BODY...................................................................................................................................3
a) Unilever Company..................................................................................................................3
b). Ratios of Unilever Group.......................................................................................................4
c). Interpretation of Financial Ratio Analysis...........................................................................11
d) Strategic Analysis of Unilever Company.............................................................................13
e) Reasons to invest in Unilever................................................................................................16
CONCLUSION..............................................................................................................................18
REFERENCES..............................................................................................................................20
Appendix........................................................................................................................................21

INTRODUCTION
This report shall highlight the strategic and financial analysis of Unilever company, a
multinational consumer goods company which is headquartered in London. It shall be describing
brief details about the Unilever and the industry in which it operates. It shall be demonstrating
the financial and performance ratios of the company based on the data of two consecutive year's
financial statements of Unilever company. Financial analysis of the performance and position of
the company shall be done on the basis of the calculations of profitability, liquidity, gearing,
efficiency and investor performance ratios. Apart from this the other part of the project shall be
including the strategic analysis of the company which shall be based on the management model
of SWOT analysis. Such analysis shall be reflecting the strengths, weaknesses, opportunities and
threats as posed by the external environment of the business. Lastly advice shall be given to the
rationale investors regarding whether they should invest in the Unilever company or not by
giving appropriate reasons for the choice.
MAIN BODY
a) Unilever Company
It is a British multinational fast moving consumer goods company which is headquartered in
London, England. It operates in the FMCG industry and provides a range of goods from food and
refreshment, beauty and personal care and home care products. The company was founded in
1929 and the current CEO of the company is Alan Jope. It is operating globally in about 190
countries with unique and innovated products, and they believe that the purpose should not be
kept ahead of profits but the purpose should be one that drives the profits. They want their brand
to perform well for the consumers so that they stay satisfied and get a feel good and look good
experience (Grant, 2016).
It is the resulting company after the merger of a Dutch company Margarine and the British soap
maker Lever Brothers. It has been the second highest company in terms of packed consumer
goods and third highest food company.
The Unilever company has also strongly focused on generating a positive social impact by
fulfilling their corporate social responsibility. For doing this they have launched programs of
sustainable living wherein they concentrate on long term growth prospects of the company by
⊘ This is a preview!⊘
Do you want full access?
Subscribe today to unlock all pages.

Trusted by 1+ million students worldwide

presently reducing the environmental footprint (Hall, and et.al. 2016). They are constantly trying
to improve the health conditions of their customers and by this they are upgrading the standards
of living and providing better livelihood.
It is operating with more than 400 brands of Unilever and some of the famous ones generating
the highest revenues for the company are Lipton, Knorr, Dove, Hellman's, Rexona etc. It has
conquered a huge market share with the help of these famous brands of beauty and skincare and
food.
Its major competitors operating in the FMCG industry are Procter and Gamble, Johnson &
Johnson, Kimberley Clark, Nestle etc. There is a cut-throat competition in all these companies
and so proper financial and strategic analysis is required to survive the competition.
b). Ratios of Unilever Group
Profitability ratios
Profitability ratios are used to assess the business ability to generate earnings relative to
its revenue, operating cost, balance sheet, over a specific period (Unilever Annual report and
accounts, 2019). It shows how well a company utilizes its assets to create profits. There are
various profitability ratios which helps analyst to determine its probability level of Unilever
group (Kadim, Sunardi and Husain, 2020 ).
Particulars Formula 2018 2019
Operating Profit 12369 8708
Sales 50982 51980
Operating Profit
Ratio
Operating profit
/sales×100
24.26 16.75
Paraphrase This Document
Need a fresh take? Get an instant paraphrase of this document with our AI Paraphraser

Particulars Formula 2018 2019
Net income 9788 6026
Sales 50982 51980
Net Profit Ratio Net income/ sales
*100
19.2 11.59
Liquidity Ratios
Operating Profit Ratio
0
5
10
15
20
25
30
24.26
16.75
2018
2019
Net Profit Ratio
0
5
10
15
20
25
19.2
11.59 2018
2019
Net income 9788 6026
Sales 50982 51980
Net Profit Ratio Net income/ sales
*100
19.2 11.59
Liquidity Ratios
Operating Profit Ratio
0
5
10
15
20
25
30
24.26
16.75
2018
2019
Net Profit Ratio
0
5
10
15
20
25
19.2
11.59 2018
2019

liquidity ratio is used to determine debtors current ability to pay debt obligation without
raising any outside external liability. It is essential accounting tool used to find current debt
repaying ability of borrowers. It helps company's analyst and other investors to find its ability of
paying debt of company (Linares-Mustarós, Coenders, and Vives-Mestres, 2018).
Particulars Formula 2018 2019
Current Assets 15478 16430
Current Liability 20150 20978
Current ratio Current Assets /Current
Liability
0.77 0.78
⊘ This is a preview!⊘
Do you want full access?
Subscribe today to unlock all pages.

Trusted by 1+ million students worldwide

Particulars Formula 2018 2019
Liquid Assets 11177 12266
Current Liability 20150 20978
Quick ratio Liquid Assets / current
liability 0.555 0.59
Current ratio
0.764
0.766
0.768
0.77
0.772
0.774
0.776
0.778
0.78
0.782
0.77
0.78
2018
2019
Liquid Assets 11177 12266
Current Liability 20150 20978
Quick ratio Liquid Assets / current
liability 0.555 0.59
Current ratio
0.764
0.766
0.768
0.77
0.772
0.774
0.776
0.778
0.78
0.782
0.77
0.78
2018
2019
Paraphrase This Document
Need a fresh take? Get an instant paraphrase of this document with our AI Paraphraser

Efficiency Ratios
This ratios are used by company to measure the performance of short term or current
performance (Myšková and Hájek, 2017). It also uses to analyse company's ability to use its
assets and manage its liability effectively in current time.
Particulars Formula 2018 2019
Revenue 50982 51980
total Assets 61111 64806
Assets Turnover Revenue / total Assets 0.83 0.8

Particulars Formula 2018 2019
Revenue 50982 51980
Fixed Assets 16140 17347
Fixed Assets
Turnover
Revenue / Fixed
Assets
3.15 2.99
Assets Turnover
0.785
0.79
0.795
0.8
0.805
0.81
0.815
0.82
0.825
0.83
0.835
0.83
0.8
2018
2019
Revenue 50982 51980
Fixed Assets 16140 17347
Fixed Assets
Turnover
Revenue / Fixed
Assets
3.15 2.99
Assets Turnover
0.785
0.79
0.795
0.8
0.805
0.81
0.815
0.82
0.825
0.83
0.835
0.83
0.8
2018
2019
⊘ This is a preview!⊘
Do you want full access?
Subscribe today to unlock all pages.

Trusted by 1+ million students worldwide

Gearing Ratios
These ratios compare the owner's equity to debt or funds borrowed by the company.
Gearing means its the measurement of entity's financial leverage. It shows the financial activities
of business funded by shareholder's fund creditors fund (Restianti, and Agustina, 2018).
Particulars Formula 2018 2019
Total debt 48994 50920
Total equity 12117 13886
Gearing Ratios Total debt/ total
equity*100
40.40% 36.60%
Fixed Assets Turnover
2.9
2.95
3
3.05
3.1
3.15
3.2
3.15
2.99
2018
2019
Paraphrase This Document
Need a fresh take? Get an instant paraphrase of this document with our AI Paraphraser

Gearing Ratios
0.34
0.35
0.36
0.37
0.38
0.39
0.4
0.41 40.40%
36.60%
2018
2019
0.34
0.35
0.36
0.37
0.38
0.39
0.4
0.41 40.40%
36.60%
2018
2019

Particulars Formula 2018 2019
EBITDA 12360 8289
Interest expenses 419 401
Interest Coverage
Ratio
EBITDA/ Interest
expenses
29.49 20.67
Investment Ratio
Investment ratios are used in order to evaluate the company's ability to generate the return
for their investment. It determines company's efficiency in return on investment. It shows how
investment will be profitable.
Particulars Formula 2018 2019
Net income 9788 6026
shareholders equity 12117 13886
Return on equity Net income /
shareholders equity
80.77 43.39
Interest Coverage Ratio
0
5
10
15
20
25
30
35
29.49
20.67
2018
2019
⊘ This is a preview!⊘
Do you want full access?
Subscribe today to unlock all pages.

Trusted by 1+ million students worldwide
1 out of 24
Related Documents

Your All-in-One AI-Powered Toolkit for Academic Success.
+13062052269
info@desklib.com
Available 24*7 on WhatsApp / Email
Unlock your academic potential
Copyright © 2020–2025 A2Z Services. All Rights Reserved. Developed and managed by ZUCOL.