Business Decision Making: Comparing UK Supermarkets' Performance
VerifiedAdded on 2021/01/02
|24
|4312
|142
Report
AI Summary
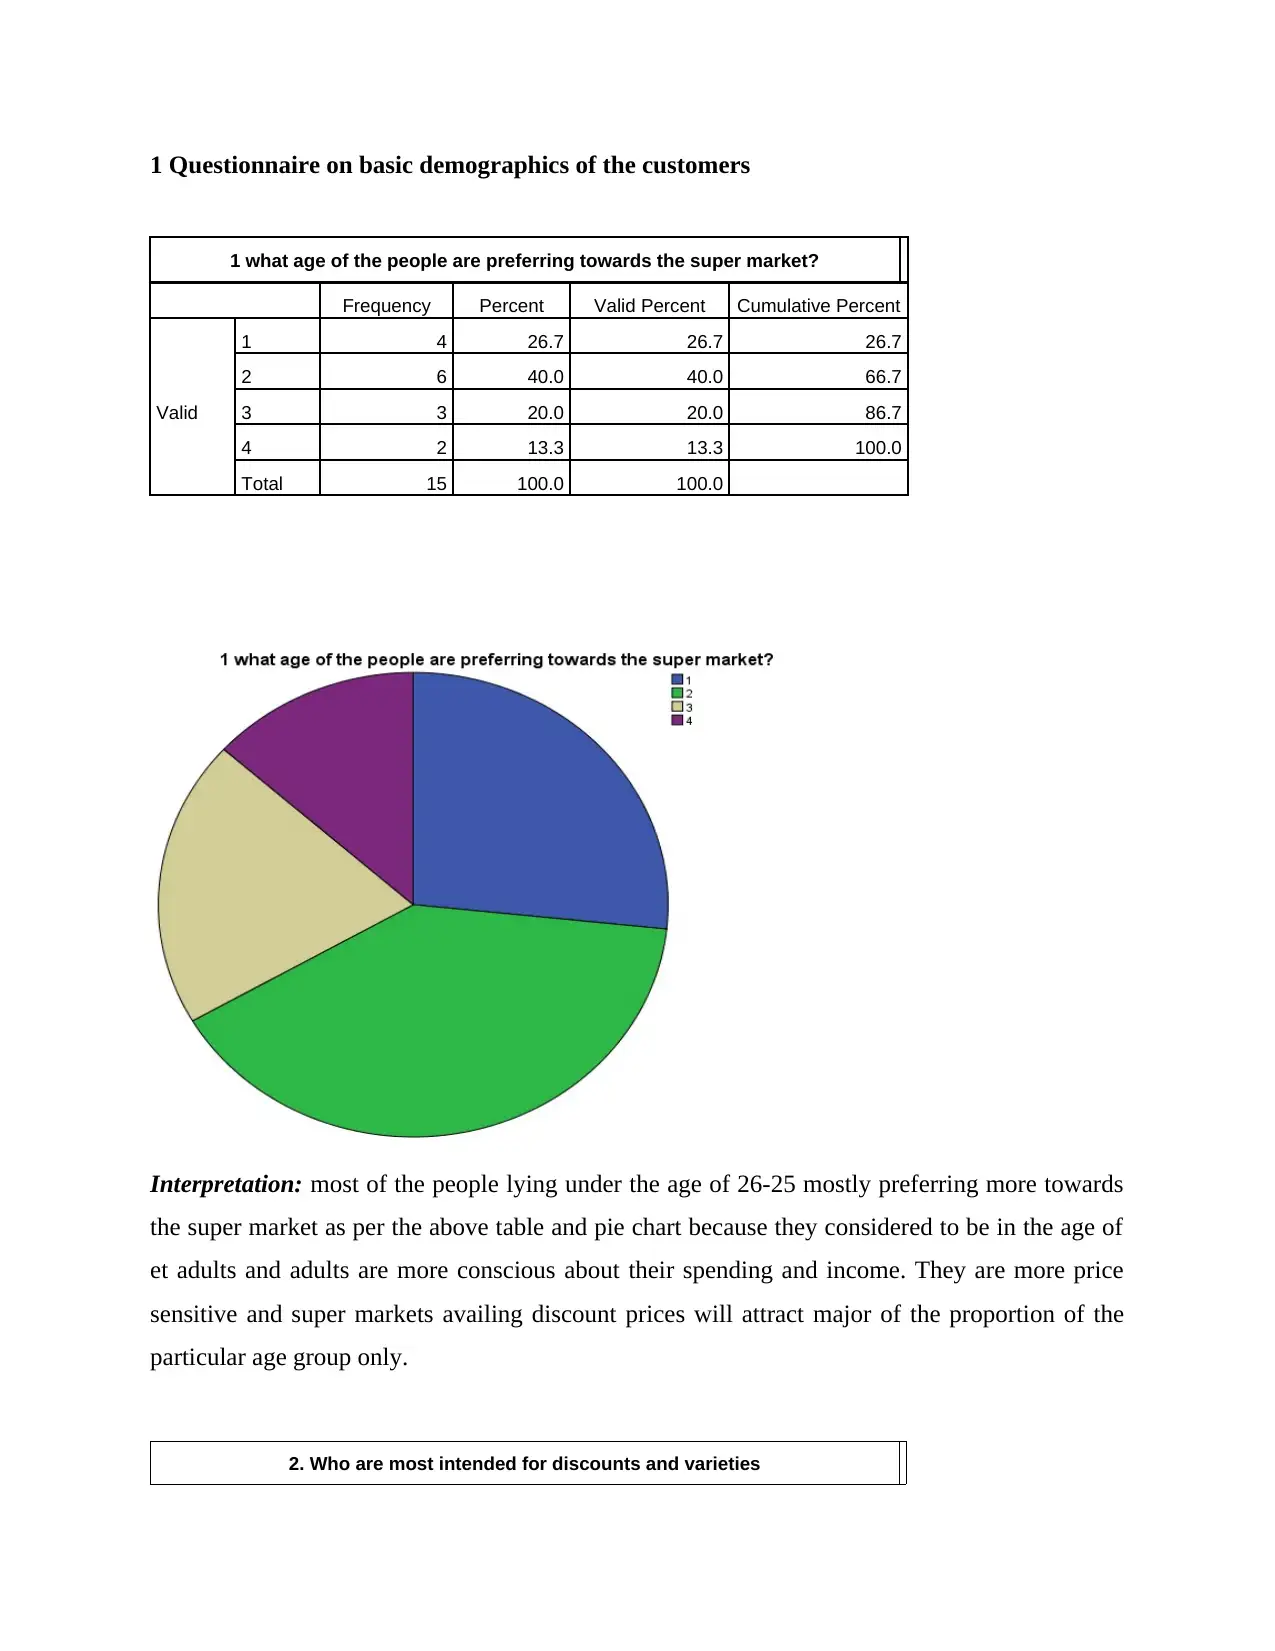
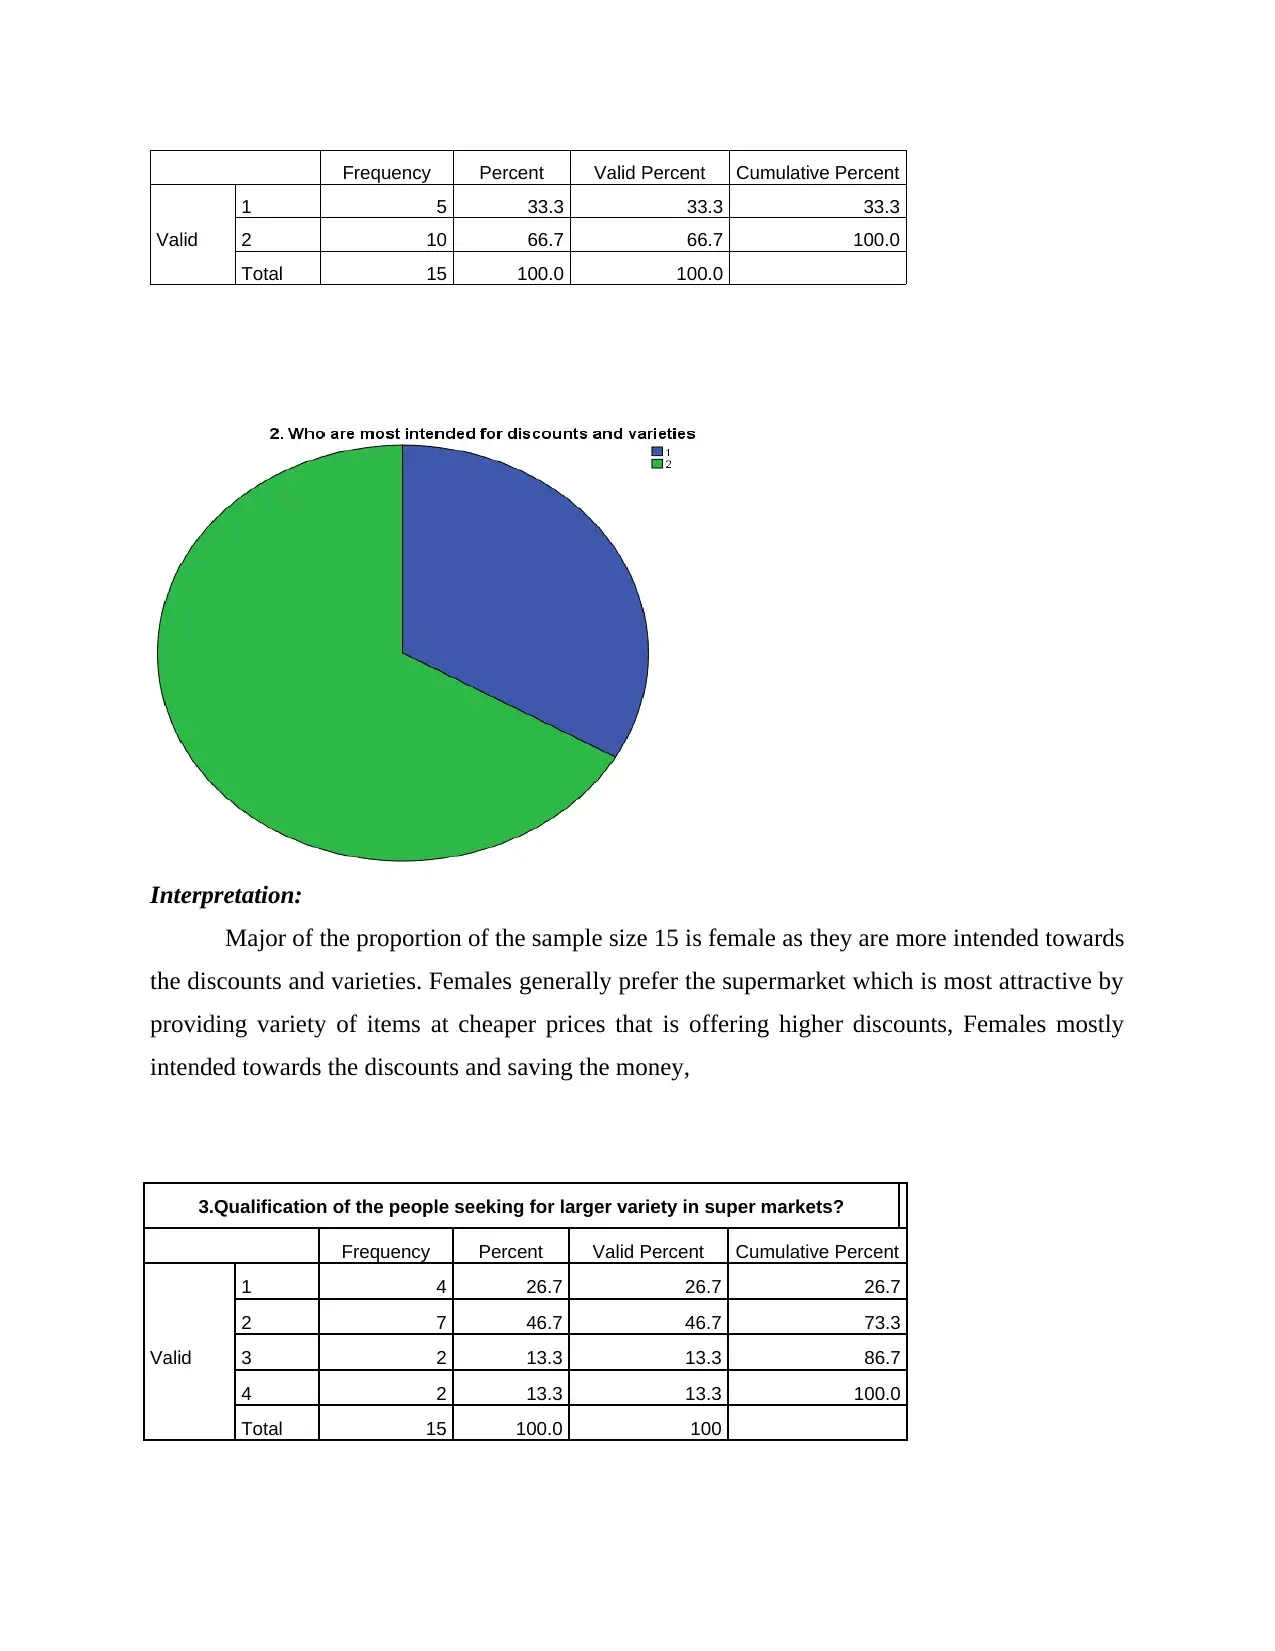
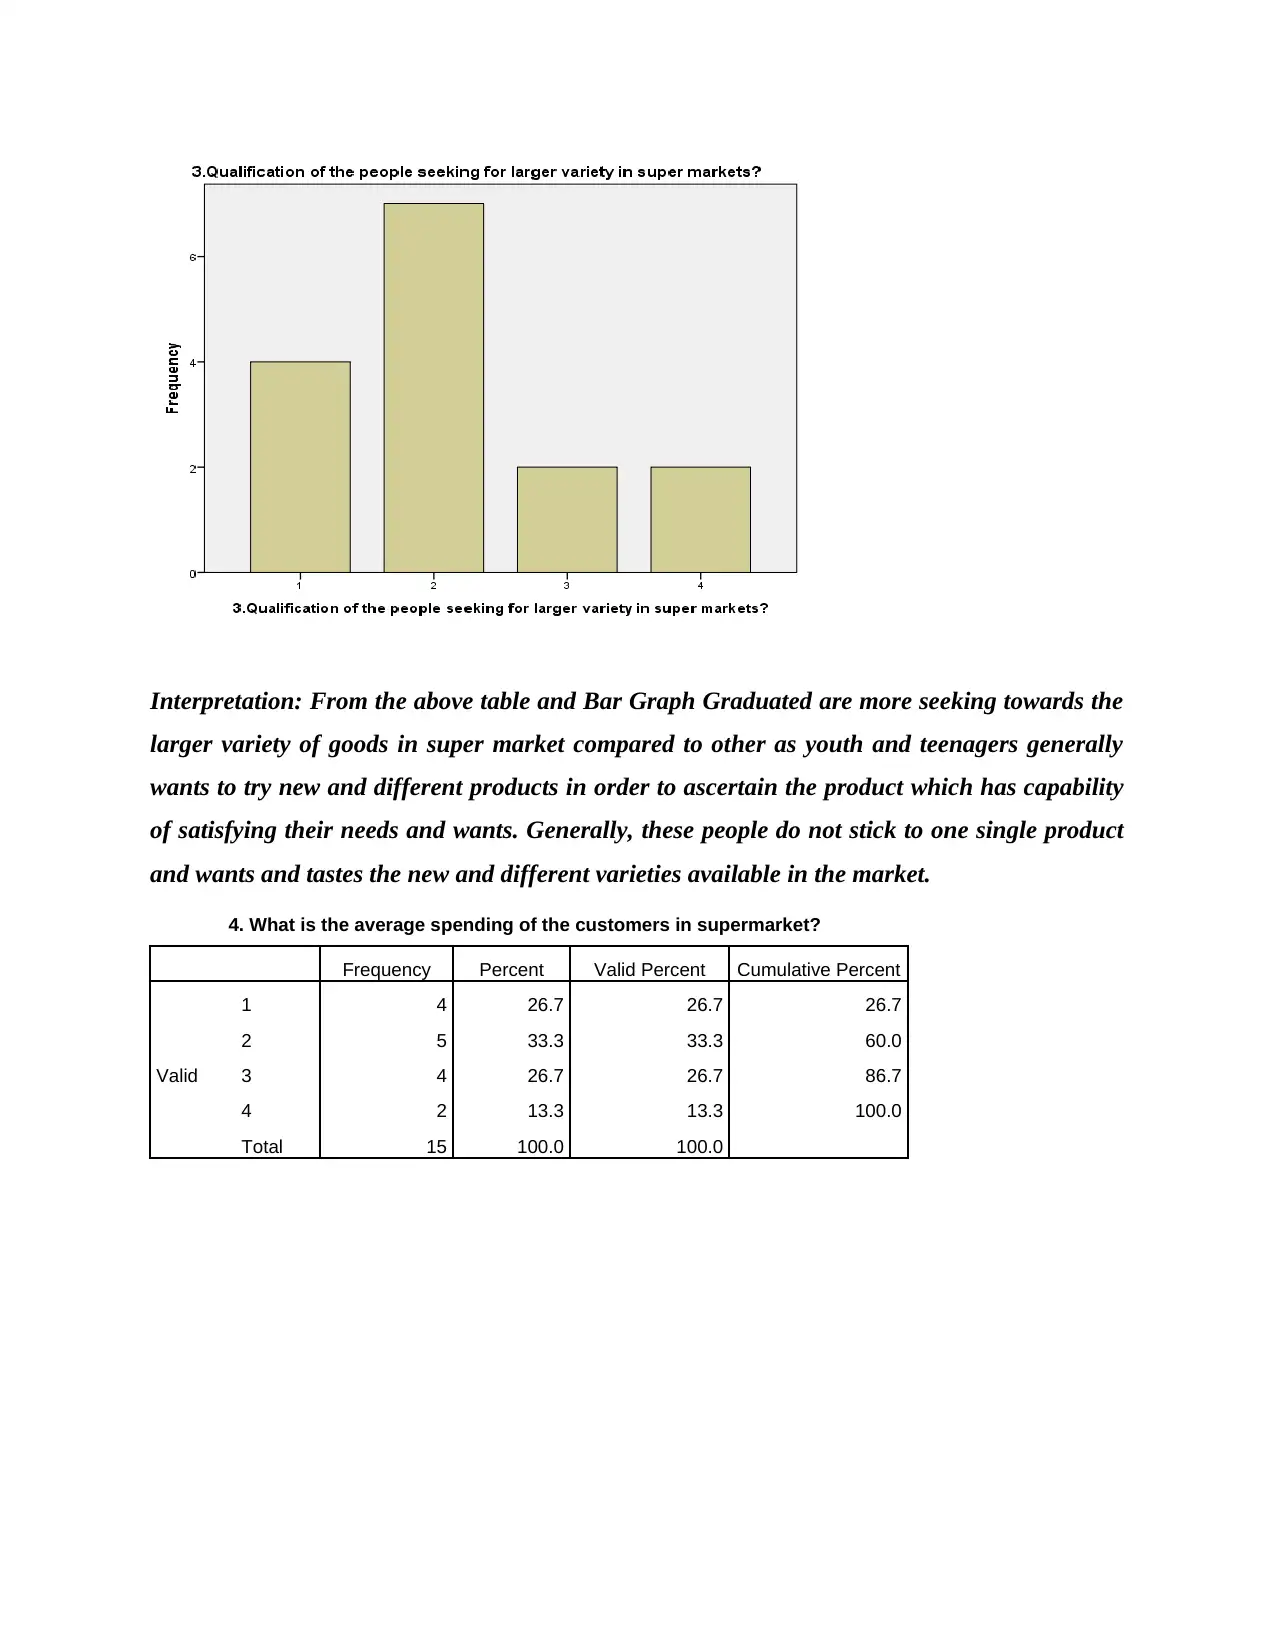
This report delves into business decision-making within the UK supermarket sector, focusing on the comparison between discount supermarkets like B&M and Home Bargains, and major players such as Tesco and Sainsbury's. The study employs primary data collection through questionnaires to assess customer demographics, preferences, and the factors influencing their choices. The report analyzes data on customer age, gender, qualifications, spending habits, and the key drivers behind their supermarket selections. Furthermore, it compares customer preferences regarding product variety, home delivery services, pricing, and discounts across different supermarket chains. The analysis includes a comparison of profitability ratios to evaluate the financial performance of these companies. The findings reveal insights into customer behavior, market trends, and the competitive landscape, providing a comprehensive overview of the UK supermarket industry.

BUSINESS DECISION MAKING
Paraphrase This Document
Need a fresh take? Get an instant paraphrase of this document with our AI Paraphraser

TABLE OF CONTENTS
Executive summary..........................................................................................................................3
INTRODUCTION...........................................................................................................................3
Task 1 Primary data collection and analysis....................................................................................3
Survey methodology...............................................................................................................4
Sampling:................................................................................................................................4
1 Questionnaire on basic demographics of the customers......................................................4
2 Determining the factors which attract customers towards the discount offering supermarkets
................................................................................................................................................5
3 Comparing the customer preferences between the discounts supermarkets and UK Big
supermarkets...........................................................................................................................5
Findings:.................................................................................................................................6
Task:2.............................................................................................................................................16
Profitability Ratios:..............................................................................................................17
CONCLUSION..............................................................................................................................20
REFERENCES..............................................................................................................................21
Online...................................................................................................................................21
APPENDIX....................................................................................................................................22

Executive summary
Business decision making is the process of making the prompt and useful decisions which
helps business in achieving their goal and performing their activities. The present study is based
on the B&M, home bargains are some discount super markets' and other UK big super markets
including Tesco, Sainsbury who are providing varieties and discount to attract more customers.
Primary data is the data collected from the researcher with first hand sources Primary data is
collected by the investigator who is conducting the research. Report is about the comparison
between the financial data of different companies which helps in ascertaining the company
which is more powerful and have a strong market.
⊘ This is a preview!⊘
Do you want full access?
Subscribe today to unlock all pages.

Trusted by 1+ million students worldwide

INTRODUCTION
Business decision making is the process of making the prompt and useful decisions
which helps business in achieving their goal and performing their activities. The decision can be
taken with the help of available information which is generated from different sources of data.
Data helps to generate the useful information which further helps organisation in making useful
decision.
The present study is based on the B&M, home bargains are some discount super markets' and
other UK big super markets including Tesco, Sainsbury who are providing varieties and discount
to attract more customers
The report will also include the comparison of both the companies by considering the
profitability ratios and with the Interpretation of the questions of the questionnaire.
Task 1 Primary data collection and analysis
Primary data is the data collected from the researcher with first hand sources using
different methods including surveys, interviews and experiments (Thomas, 2015). They are
directly collected from the primary sources. Primary data is collected by the investigator who is
conducting the research. Primary data is the information which is collected specifically for the
purpose of the research project. The information obtained is most useful for the researcher when
they need the specific information on a particular field.
Primary data analysis is basically the original analysis of the data which is collected for
research study (Klausen, 2017). In other words, quantitative research attempts to find the
difference or relationships.
Survey methodology
The survey method is the technique for gathering the data by asking questions to the
people who are expected to have desired information (Lakerveld and et.al., 2017). A formal list
of questionnaires is prepared and asked to the people so that survey can be implemented and
useful data and information can be generated through surveys. Researcher have used the
questionnaire method for survey.
Sampling:
It is the process which is used in statistical analysis in which pre-determined number of
observation are taken form the large population (Johnston, 2017). The sample size of 15 is taken
below and simple random sampling is being followed for taking the samples. Simple random
Paraphrase This Document
Need a fresh take? Get an instant paraphrase of this document with our AI Paraphraser

sampling is being used by the researcher as they want the data from random population not from
the specific ones.
1 Questionnaire on basic demographics of the customers
1 what age of people do prefer super market?
 18-25
 26-35
 36-45
 46-55
2. Who are most intended for discounts and varieties?
 Males
 Females
3.Qualification of the people seeking for larger variety in super markets?
 Masters
 Graduated
 Post graduated
 Diploma
4. What is the average spending of the customers in supermarket?
£2500-£5000
£5000-£5500
£5500-£10000
£10000-£10500
2 Determining the factors which attract customers towards the discount offering supermarkets
Why do you attract towards the discount supermarkets?
Tick the sequence from 1 to 3, 1 of the most important factor and 3 for the less important for
your attraction accordingly.
1 2 3
Price
location

Discounts
Product range
3 Comparing the customer preferences between the discounts supermarkets and UK Big
supermarkets.
1. Which supermarket do you shop at most in context with product variety
 B&M
 Tesco
 Sainsbury's
 Morrisons
2. What Do you think, home delivery services are more convenient at
 B&M
 Tesco
 Asda
 Home bargains
3. Which supermarket do you think is providing the low priced and offering great discounts
 Home Bargains and B&M
 Tesco and Sainsbury’s
4. Which is the most important factor when you decide to buy the product
 price discounts
 Delivery services
 Branded products
 Ambience
5. Which of the super market is having better space and ambience
 Home Bargains
 Morrisons
Findings:
⊘ This is a preview!⊘
Do you want full access?
Subscribe today to unlock all pages.

Trusted by 1+ million students worldwide

1 Questionnaire on basic demographics of the customers
1 what age of the people are preferring towards the super market?
Frequency Percent Valid Percent Cumulative Percent
Valid
1 4 26.7 26.7 26.7
2 6 40.0 40.0 66.7
3 3 20.0 20.0 86.7
4 2 13.3 13.3 100.0
Total 15 100.0 100.0
Interpretation: most of the people lying under the age of 26-25 mostly preferring more towards
the super market as per the above table and pie chart because they considered to be in the age of
et adults and adults are more conscious about their spending and income. They are more price
sensitive and super markets availing discount prices will attract major of the proportion of the
particular age group only.
2. Who are most intended for discounts and varieties
Paraphrase This Document
Need a fresh take? Get an instant paraphrase of this document with our AI Paraphraser

Frequency Percent Valid Percent Cumulative Percent
Valid
1 5 33.3 33.3 33.3
2 10 66.7 66.7 100.0
Total 15 100.0 100.0
Interpretation:
Major of the proportion of the sample size 15 is female as they are more intended towards
the discounts and varieties. Females generally prefer the supermarket which is most attractive by
providing variety of items at cheaper prices that is offering higher discounts, Females mostly
intended towards the discounts and saving the money,
3.Qualification of the people seeking for larger variety in super markets?
Frequency Percent Valid Percent Cumulative Percent
Valid
1 4 26.7 26.7 26.7
2 7 46.7 46.7 73.3
3 2 13.3 13.3 86.7
4 2 13.3 13.3 100.0
Total 15 100.0 100
Valid
1 5 33.3 33.3 33.3
2 10 66.7 66.7 100.0
Total 15 100.0 100.0
Interpretation:
Major of the proportion of the sample size 15 is female as they are more intended towards
the discounts and varieties. Females generally prefer the supermarket which is most attractive by
providing variety of items at cheaper prices that is offering higher discounts, Females mostly
intended towards the discounts and saving the money,
3.Qualification of the people seeking for larger variety in super markets?
Frequency Percent Valid Percent Cumulative Percent
Valid
1 4 26.7 26.7 26.7
2 7 46.7 46.7 73.3
3 2 13.3 13.3 86.7
4 2 13.3 13.3 100.0
Total 15 100.0 100

Interpretation: From the above table and Bar Graph Graduated are more seeking towards the
larger variety of goods in super market compared to other as youth and teenagers generally
wants to try new and different products in order to ascertain the product which has capability
of satisfying their needs and wants. Generally, these people do not stick to one single product
and wants and tastes the new and different varieties available in the market.
4. What is the average spending of the customers in supermarket?
Frequency Percent Valid Percent Cumulative Percent
Valid
1 4 26.7 26.7 26.7
2 5 33.3 33.3 60.0
3 4 26.7 26.7 86.7
4 2 13.3 13.3 100.0
Total 15 100.0 100.0
⊘ This is a preview!⊘
Do you want full access?
Subscribe today to unlock all pages.

Trusted by 1+ million students worldwide

Interpretation: From the above table and pie diagram it is clearly stated teat major of the
population spend their income of around 5000-5500 in supermarket for the goods and services
they want. The general people do not spend much amount on the products as this is wastage of
financial resources. People intended to save and invest more rather than expenses. Generally, a
medium range of spending is being spent on the goods which are capable of satisfying the needs
and wants of the customers.
2 Determining the factors which attract customers towards the discount offering
supermarkets
1. Why do you attracted towards the discount supermarkets?
Highest Moderate Lowest
Price 7 5 3
location 6 6 3
Discounts 8 3 4
Product range 9 3 3
Price location Discount Product
Paraphrase This Document
Need a fresh take? Get an instant paraphrase of this document with our AI Paraphraser

s range
Mean 5 Mean 5 Mean 5 Mean 5
Standard
Error
1.154700538
4
Standard
Error 1
Standard
Error
1.527525231
7
Standard
Error 2
Median 5 Median 6 Median 4 Median 3
Mode #N/A Mode 6 Mode #N/A Mode 3
Standard
Deviation 2
Standard
Deviation
1.732050
8076
Standard
Deviation
2.645751311
1
Standard
Deviation
3.464101
6151
Interpretation: People are more attracted towards the discounted super markets as they attracted
towards many factors. From the above table it is only interpreted that the people are focusing on
different factors as they make attract them towards the super market that is price discounts, brand
value, location where people are easy to reach and product range which offers many varieties' for
the people for choosing the best among the available one which have capability of satisfying the
customers’ needs and wants/
3 Comparing the customer preferences between the discounts supermarkets and UK Big
supermarkets.
1. Which supermarket do you shop at most in context with product variety
Frequency Percent Valid Percent Cumulative Percent
Valid
1 5 33.3 33.3 33.3
2 5 33.3 33.3 66.7
3 3 20.0 20.0 86.7
4 2 13.3 13.3 100.0
Total 15 100.0 100.0

Interpretation:
From the above chart and table, it can be interpreted that the B&M and Tesco offering with more
product variety which is attracting the customers more and helps the business in earning good
amount of profit. As more variety and more options are provided by the companies for satisfying
the needs, wants and requirements of the customers in all way. The customer will switch to the
product which satisfies them the most. B&M are the discount markets and Tesco is also the UK
big super market providing the variety of offerings.
2. What Do you think, home delivery services are more convenient at
Frequency Percent Valid Percent Cumulative Percent
Valid
1 6 40.0 40.0 40.0
2 3 20.0 20.0 60.0
3 2 13.3 13.3 73.3
4 4 26.7 26.7 100.0
Total 15 100.0 100.0
⊘ This is a preview!⊘
Do you want full access?
Subscribe today to unlock all pages.

Trusted by 1+ million students worldwide
1 out of 24
Related Documents
Your All-in-One AI-Powered Toolkit for Academic Success.
+13062052269
info@desklib.com
Available 24*7 on WhatsApp / Email
Unlock your academic potential
Copyright © 2020–2025 A2Z Services. All Rights Reserved. Developed and managed by ZUCOL.


