Financial Performance Analysis: Australian Telecom Industry Report
VerifiedAdded on 2020/04/01
|20
|4108
|119
Report
AI Summary
This report offers a comprehensive financial analysis of the Australian telecommunications industry, employing a top-down and bottom-up approach. The executive summary highlights the performance of the sector, focusing on major players Telstra Corporation and TPG Telecom. The report examines the macroeconomic environment, including economic growth, regulatory contexts, and technological changes influencing the industry. It presents a comparative analysis of Telstra and TPG Telecom, evaluating their profitability, liquidity, capital structure, and market performance using financial ratios from 2015 and 2016. The analysis includes return on assets, net profit margin, current and quick ratios, debt-to-equity, and earnings per share, providing insights into their financial health and market positioning. The conclusion and recommendations summarize the findings, offering strategic insights for investors and stakeholders within the Australian telecom sector.

Principals of Financial Markets
1
1
Paraphrase This Document
Need a fresh take? Get an instant paraphrase of this document with our AI Paraphraser
Executive Summary
The purpose of the report is to provide insight into the performance of telecom industry
in Australia through using top down analysis. This report also provides specific information
about the two major players of the telecom industry. The two companies that are selected for this
purpose are Telstra Corporation and TPG Telecom. Both these company has different level of
workings in the industry. Telstra has performed better as compared to TPG Telecom in segment
like liquidity of firm, market performance and profitability analysis but capital structure of TPG
Telecom was much better than Telstra Corporation.
2
Contents
Executive Summary.........................................................................................................................2
Introduction......................................................................................................................................4
Top Down analysis..........................................................................................................................4
Australian Economic Environment..............................................................................................5
Macro-economic environment of Telecommunication Sector of Australia.................................6
Part B: Bottom up analysis of the companies selected under the same industry (Telstra and TPG
Telecom)........................................................................................................................................10
Profitability Ratio Analysis........................................................................................................14
Liquidity Analysis......................................................................................................................15
Capital Structure Ratio Analysis................................................................................................16
Market Performance...................................................................................................................17
Conclusion and Recommendations................................................................................................18
References......................................................................................................................................19
3
⊘ This is a preview!⊘
Do you want full access?
Subscribe today to unlock all pages.
Trusted by 1+ million students worldwide
Introduction
The present report conducts a fundamental analysis of an industry for identifying the
factors that impacts the stock movement of the companies in the industry. The fundamental
analysis mainly aims to predict the performance of an industry through examining its present and
future investment strategies. This is done to predict the economical value of the stocks of a
company in the future context by analyzing its past and present performances. The investors of a
company can conduct a fundamental analysis through examining its financial statements,
economic and technical environment. There are mainly two approaches used to carry out
fundamental analysis of a company that are, bottom-up and top-down analysis. The top-down
approach consist of analyzing the macroeconomic factors impacting the stock performances such
as GDP, currency rates, trade balances inflation and interest rates for identifying the stocks that
are performing well. This is followed by selecting the companies that have efficient assets
allocation for releasing capital gains by top-down investors. On the other hand, bottom-up
analysis analyses the microeconomic factors that have an impact on the companies in which they
are seeking to invest (Bulkowski, 2012). In this context, the report undertakes a fundamental
analysis of telecommunication industry of Australia. The top-down and bottom-up analysis of
two ASX listed companies in the industry that are, Telstra Corporation and TPG Telecom has
been done in the report.
Top Down analysis
The top-down approach in the fundamental analysis consists of analyzing the broad
economic factors that tends to influence the share prices and at last selecting a specific company
for investment purpose on the basis of the analysis. As such, this analysis is referred to as
4
Paraphrase This Document
Need a fresh take? Get an instant paraphrase of this document with our AI Paraphraser
macro-fundamental approach because it begins at a wide level and then narrows down to
individual business level. The approach begins with analyzing the trend of macroeconomic
factors with a specific industry and then evaluating the fundamental characteristics of stocks
within that sector. This requires carrying out an extensive research on the part of top-down
investors for analyzing properly the economic environment impacting an industry performance.
This helps the investors to select the most favorable company that has an upward stock
movement in order to achieve more capital gains (Krantz, 2016).
The top-down analysis of the telecommunication industry in Australia is carried out by
analyzing the macroeconomic factors that are likely to influence its performance in the future
time-period. The telecommunication industry is estimated to contribute to about $17.4 billion to
the economic growth of the country in the recent years. The increasing need for mobile and data
services is causing the growth and development of the telecommunication sector. The level of
usage of telecommunication services is increasing at a rapid rate in the Australia with large
number of players operating within the industry. This has caused the rise of competition within
the industry and thereby impacting the trading environment of companies operating in the sector.
However, the industry is presently facing many economic challenges due to the rapid
transformation in the telecommunication sector of the country. The macroeconomic factors that
are impacting the telecommunication sector performance are technological changes, Australian
dollar strong valuation and the existing monopoly in the industry. These factors are strongly
influencing the industrial performance of the telecommunication sector and thus causing the need
for adopting strategic changes in its current operational activities (Scutt, 2016).
5
Australian Economic Environment
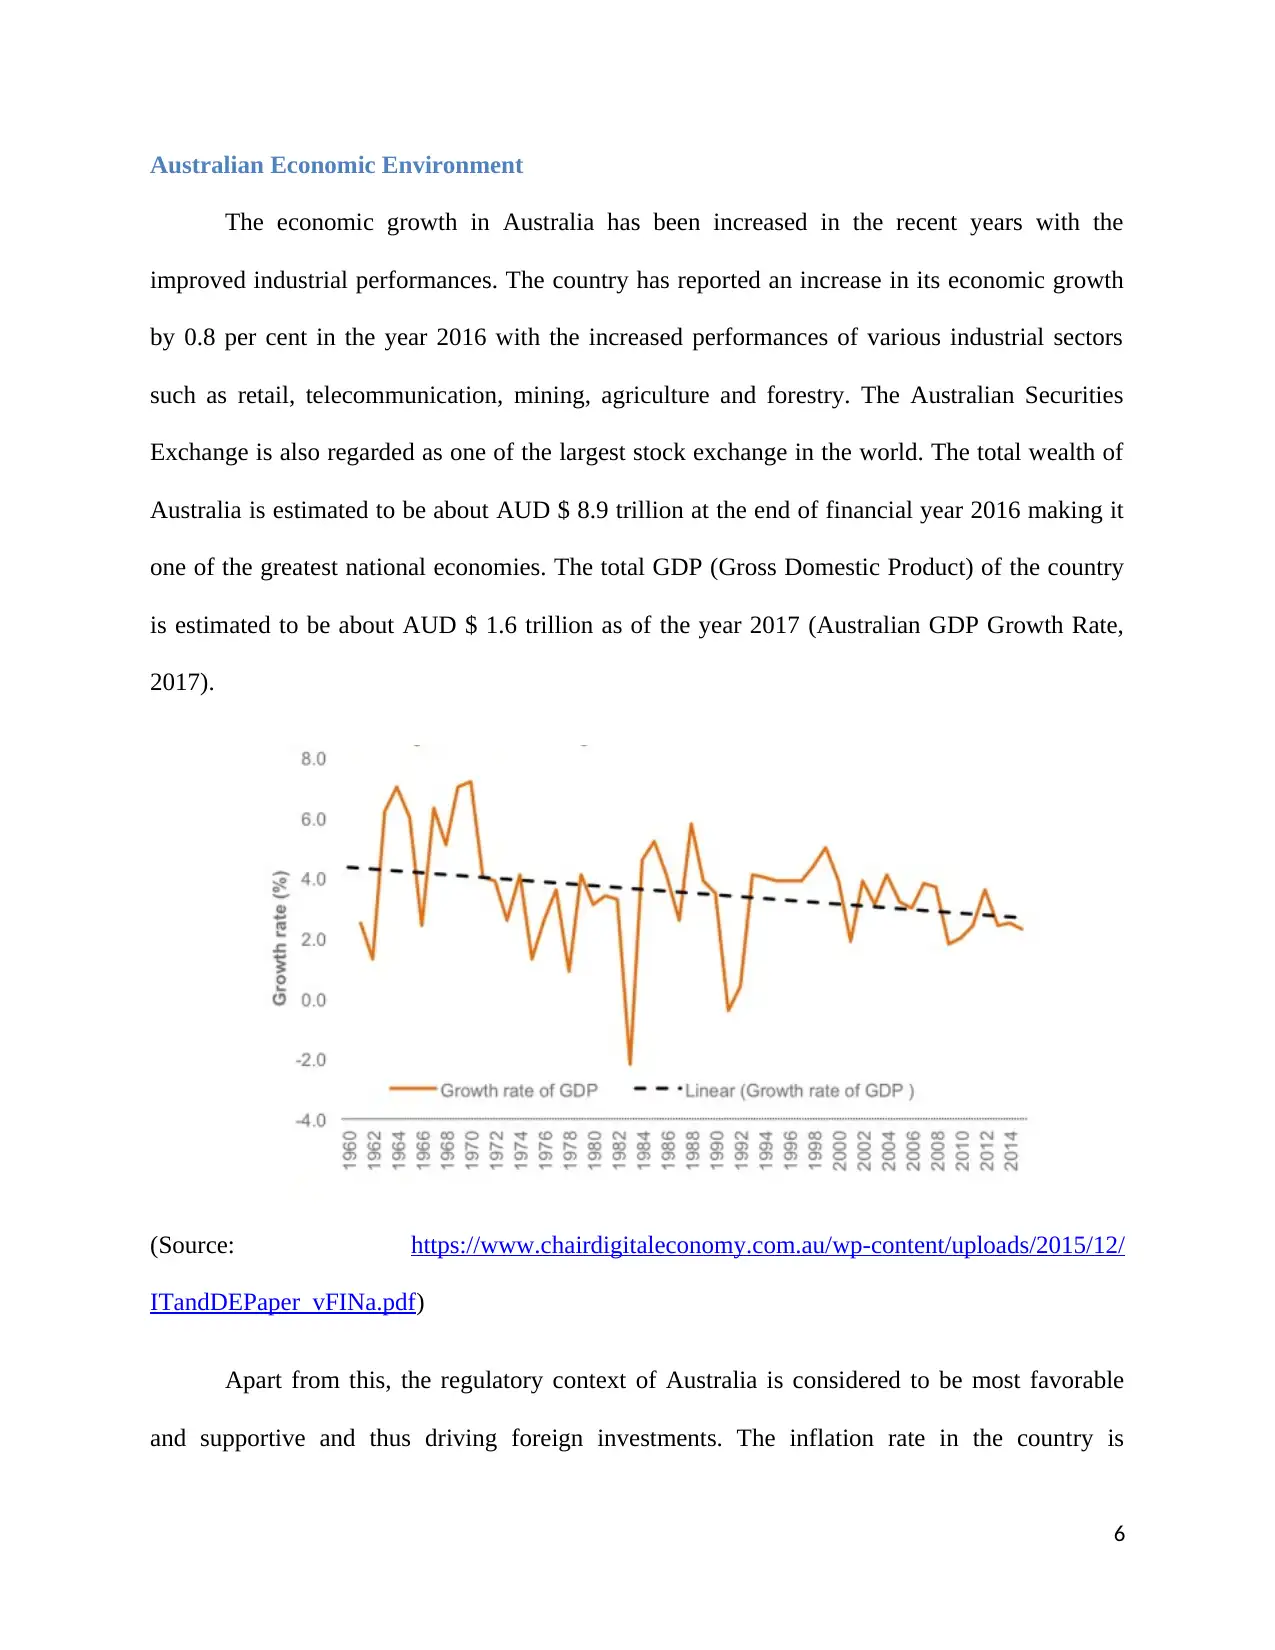
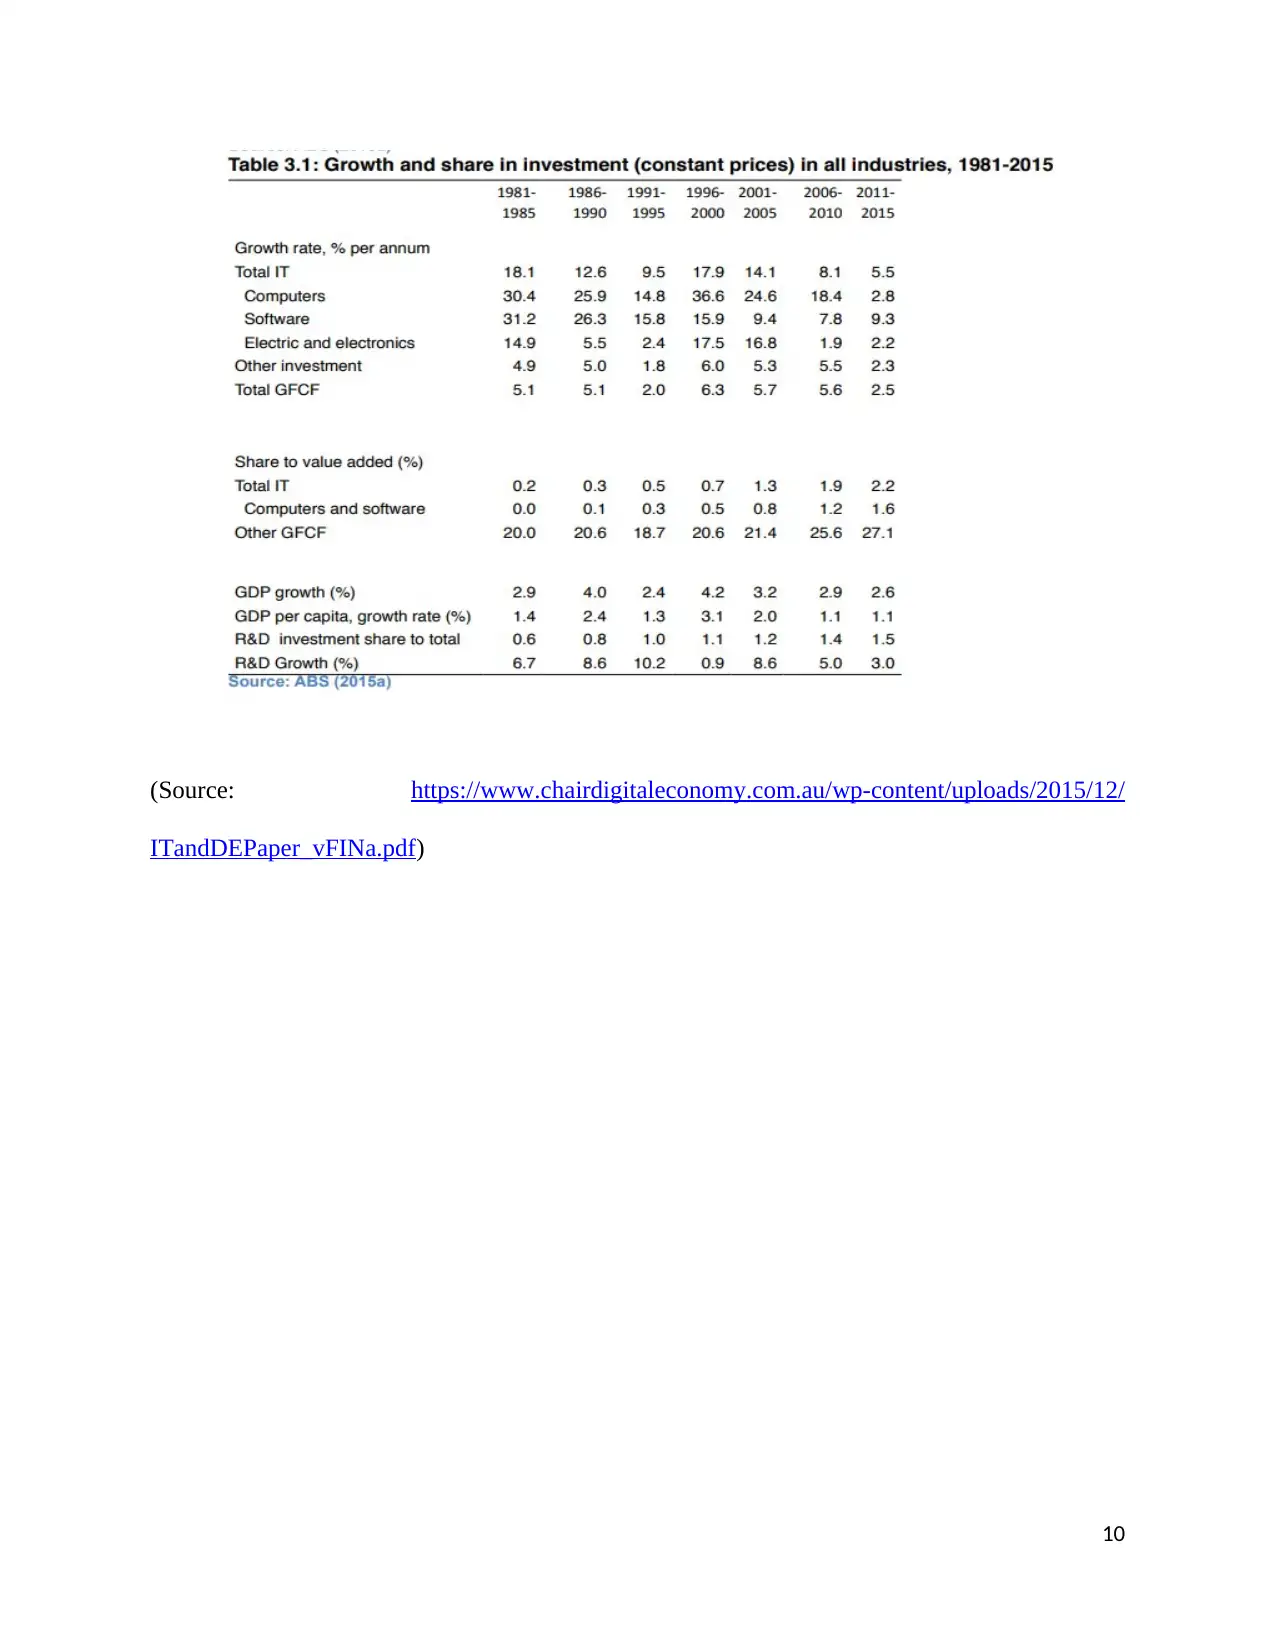
The economic growth in Australia has been increased in the recent years with the
improved industrial performances. The country has reported an increase in its economic growth
by 0.8 per cent in the year 2016 with the increased performances of various industrial sectors
such as retail, telecommunication, mining, agriculture and forestry. The Australian Securities
Exchange is also regarded as one of the largest stock exchange in the world. The total wealth of
Australia is estimated to be about AUD $ 8.9 trillion at the end of financial year 2016 making it
one of the greatest national economies. The total GDP (Gross Domestic Product) of the country
is estimated to be about AUD $ 1.6 trillion as of the year 2017 (Australian GDP Growth Rate,
2017).
(Source: https://www.chairdigitaleconomy.com.au/wp-content/uploads/2015/12/
ITandDEPaper_vFINa.pdf)
Apart from this, the regulatory context of Australia is considered to be most favorable
and supportive and thus driving foreign investments. The inflation rate in the country is
6
⊘ This is a preview!⊘
Do you want full access?
Subscribe today to unlock all pages.
Trusted by 1+ million students worldwide
estimated to be about 2.7% as of the year 2017. The strong economic growth in the country is
largely contributed by the service sector that is estimated to provide employment to about 79.2 %
of the workforce diversity of the country. As per the Reserve Bank of Australia, the interest rate
in the country has been declined from 2 % in the year 2015 to 1.5% in the year 2016. However,
the interest rate is expected to rise to about 3.5% till the end of the year 2020 (Trading
Economics, 2016).
Macro-economic environment of Telecommunication Sector of Australia
The service sector also contributes about 61.1% of the total GDP of the country being
dominated by telecommunication, media and art industries. The service sector of the country is
estimated to have a hold of about 60% of the overall industrial market share. The
telecommunication sector is also showing signing of positive growth in the recent years with the
rising demand of telecommunication services among the population of the country. As such, the
companies involved in the IT sector are likely to realize good profit returns in the future context.
However, the increase in the competition in the industry will cause the players operating in the
industry to develop and provide innovative telecom product and services to their consumers. The
telecom companies need to meet the digital, broadband ad wireless technological needs of the
consumers rapidly. This requires the, to develop highly-integrated broadband telecom networks;
cloud computing and data analytic software that will help them to meet the customer
expectations (OECD, 2004).
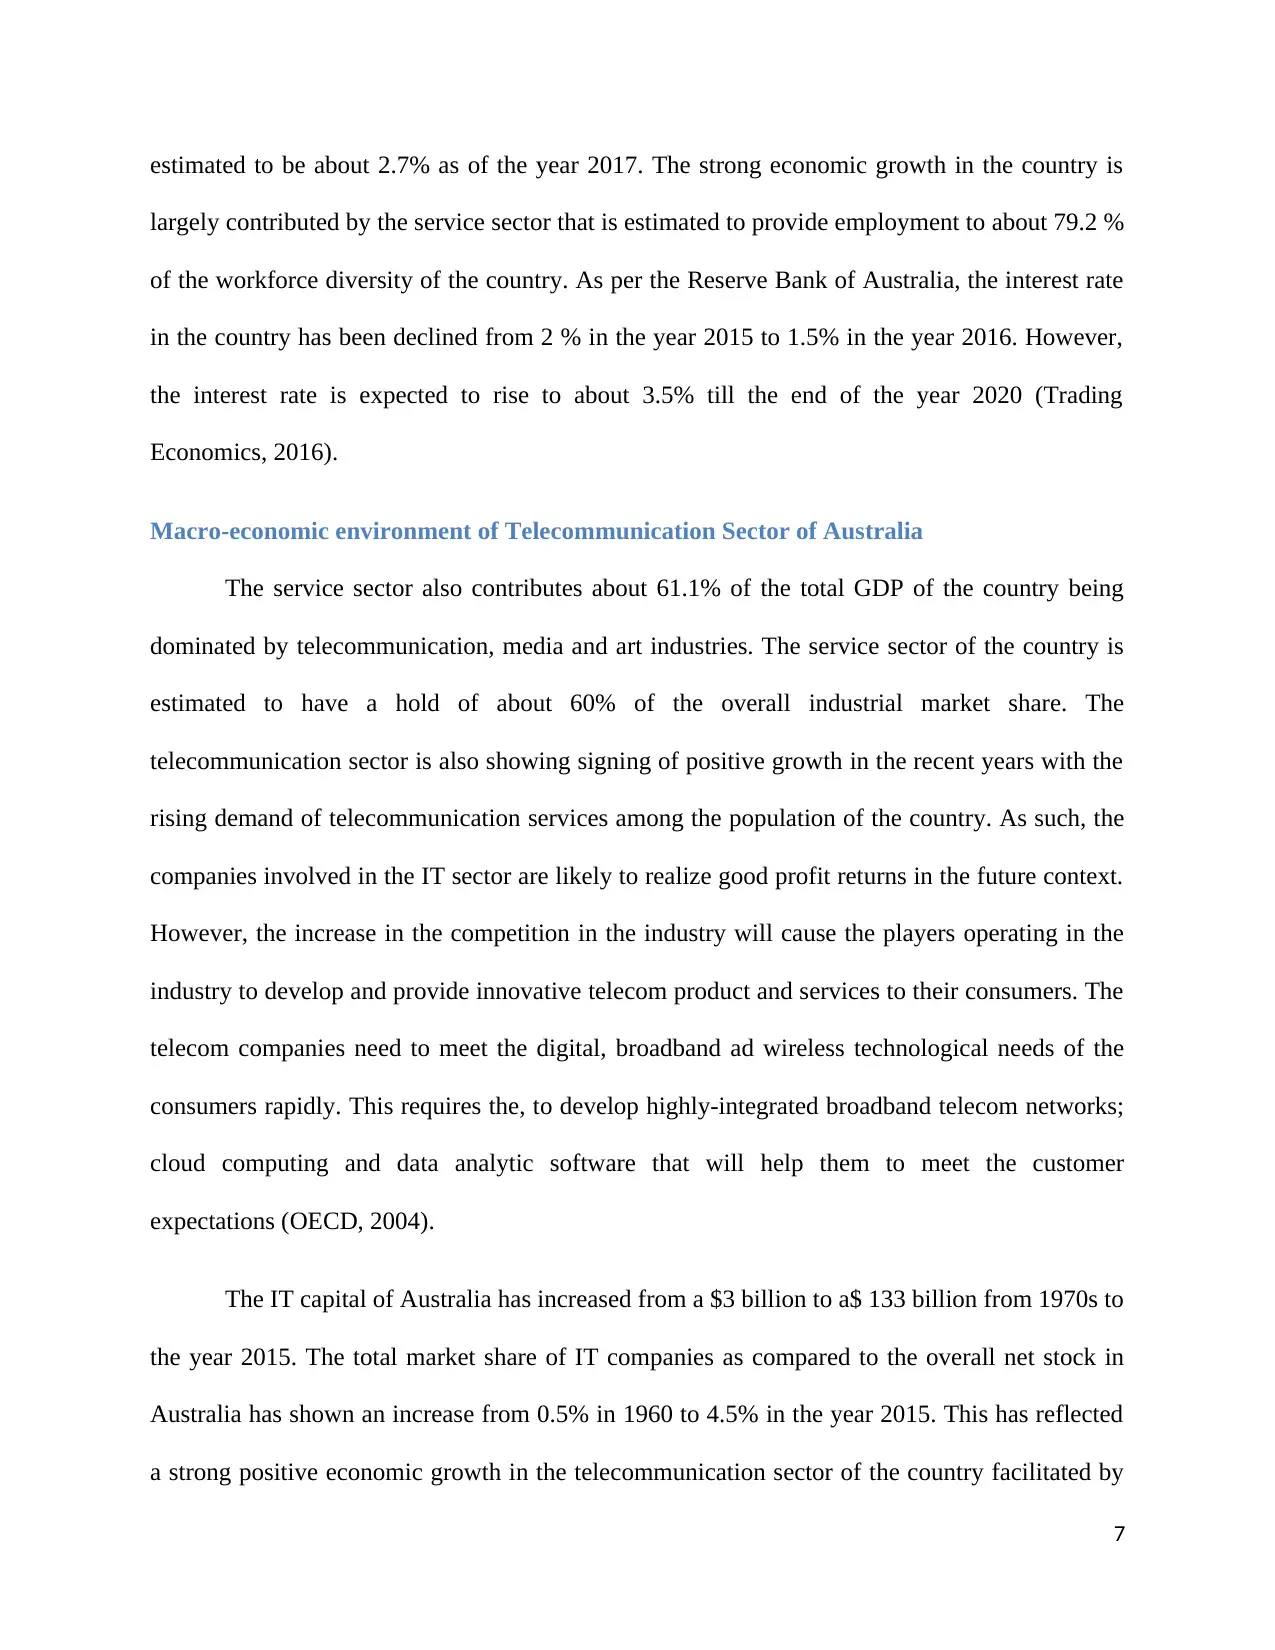
The IT capital of Australia has increased from a $3 billion to a$ 133 billion from 1970s to
the year 2015. The total market share of IT companies as compared to the overall net stock in
Australia has shown an increase from 0.5% in 1960 to 4.5% in the year 2015. This has reflected
a strong positive economic growth in the telecommunication sector of the country facilitated by
7
largely contributed by the service sector that is estimated to provide employment to about 79.2 %
of the workforce diversity of the country. As per the Reserve Bank of Australia, the interest rate
in the country has been declined from 2 % in the year 2015 to 1.5% in the year 2016. However,
the interest rate is expected to rise to about 3.5% till the end of the year 2020 (Trading
Economics, 2016).
Macro-economic environment of Telecommunication Sector of Australia
The service sector also contributes about 61.1% of the total GDP of the country being
dominated by telecommunication, media and art industries. The service sector of the country is
estimated to have a hold of about 60% of the overall industrial market share. The
telecommunication sector is also showing signing of positive growth in the recent years with the
rising demand of telecommunication services among the population of the country. As such, the
companies involved in the IT sector are likely to realize good profit returns in the future context.
However, the increase in the competition in the industry will cause the players operating in the
industry to develop and provide innovative telecom product and services to their consumers. The
telecom companies need to meet the digital, broadband ad wireless technological needs of the
consumers rapidly. This requires the, to develop highly-integrated broadband telecom networks;
cloud computing and data analytic software that will help them to meet the customer
expectations (OECD, 2004).
The IT capital of Australia has increased from a $3 billion to a$ 133 billion from 1970s to
the year 2015. The total market share of IT companies as compared to the overall net stock in
Australia has shown an increase from 0.5% in 1960 to 4.5% in the year 2015. This has reflected
a strong positive economic growth in the telecommunication sector of the country facilitated by
7
Paraphrase This Document
Need a fresh take? Get an instant paraphrase of this document with our AI Paraphraser
the development and application of new technologies in its industrials sectors. The large-scale
adoption of IT technologies is supported by the rapid increase in business investment in the
country. The large use of IT capital in the business context is due to the capability of IT
technologies to improve the production and distribution efficiency (McLean, 2013). The large-
scale increase in IT investment as compared to other investment is largely attributed to the
country transformation to a more digitalized economy. The annual IT gross fixed capital
formation has increased from a$ 1 billion in the ear 1980 to a$ 34 billion in the year 2015. The
GDP growth of the country has also become tripled during the time thus indicating the large
contribution of telecommunication sector to Australia.
(Source: https://www.chairdigitaleconomy.com.au/wp-content/uploads/2015/12/
ITandDEPaper_vFINa.pdf)
8
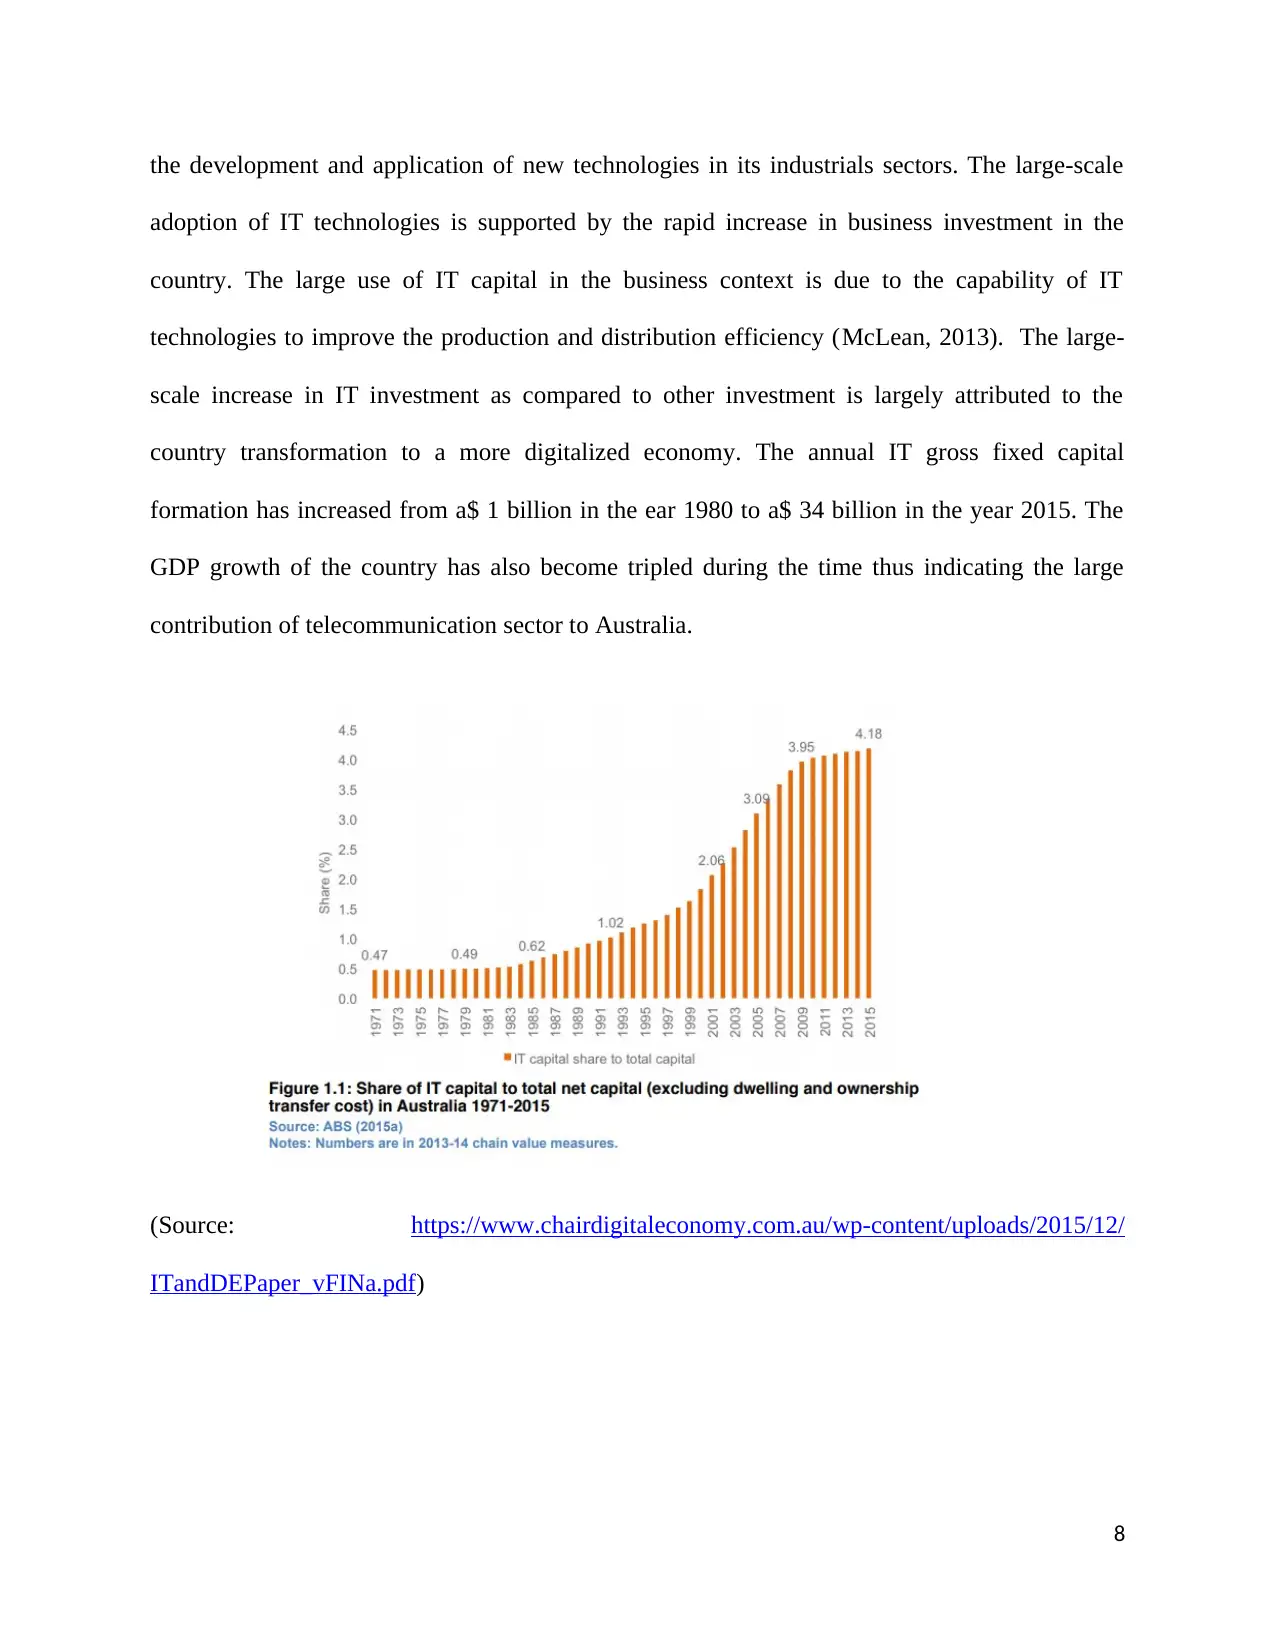
(Source: https://www.chairdigitaleconomy.com.au/wp-content/uploads/2015/12/
ITandDEPaper_vFINa.pdf)
The large-scale technological innovations are causing the major changes in the telecom
industry of the country. The country has been recognized as highest provider of mobile
broadband services at an international level. The Telstra and TPG companies are regarded to be
prominent players in the telecommunication industry of the country. The Telstra Company is
estimated to have a hold of about 60% market share revenue in the telecommunication industry.
The company is estimated to provide services to about 16 million customers in the country. The
TPG Company is also regarded to have good growth prospects in the telecommunications sector
of the country supported by its huge economic growth and profitability. This is indicated by the
fact that its markets share has increased by 8% in the year 2015. Thus, it can be said from macro-
environment analysis of Australia that it has good growth prospect for telecommunication sector
and thus is estimated to provide good capital gains to the investors in the coming period of time
Growing (Australia’s Productive Digital Economy, 2015).
9
⊘ This is a preview!⊘
Do you want full access?
Subscribe today to unlock all pages.
Trusted by 1+ million students worldwide
(Source: https://www.chairdigitaleconomy.com.au/wp-content/uploads/2015/12/
ITandDEPaper_vFINa.pdf)
10
ITandDEPaper_vFINa.pdf)
10
Paraphrase This Document
Need a fresh take? Get an instant paraphrase of this document with our AI Paraphraser
Part B: Bottom up analysis of the companies selected under the same industry (Telstra and
TPG Telecom)
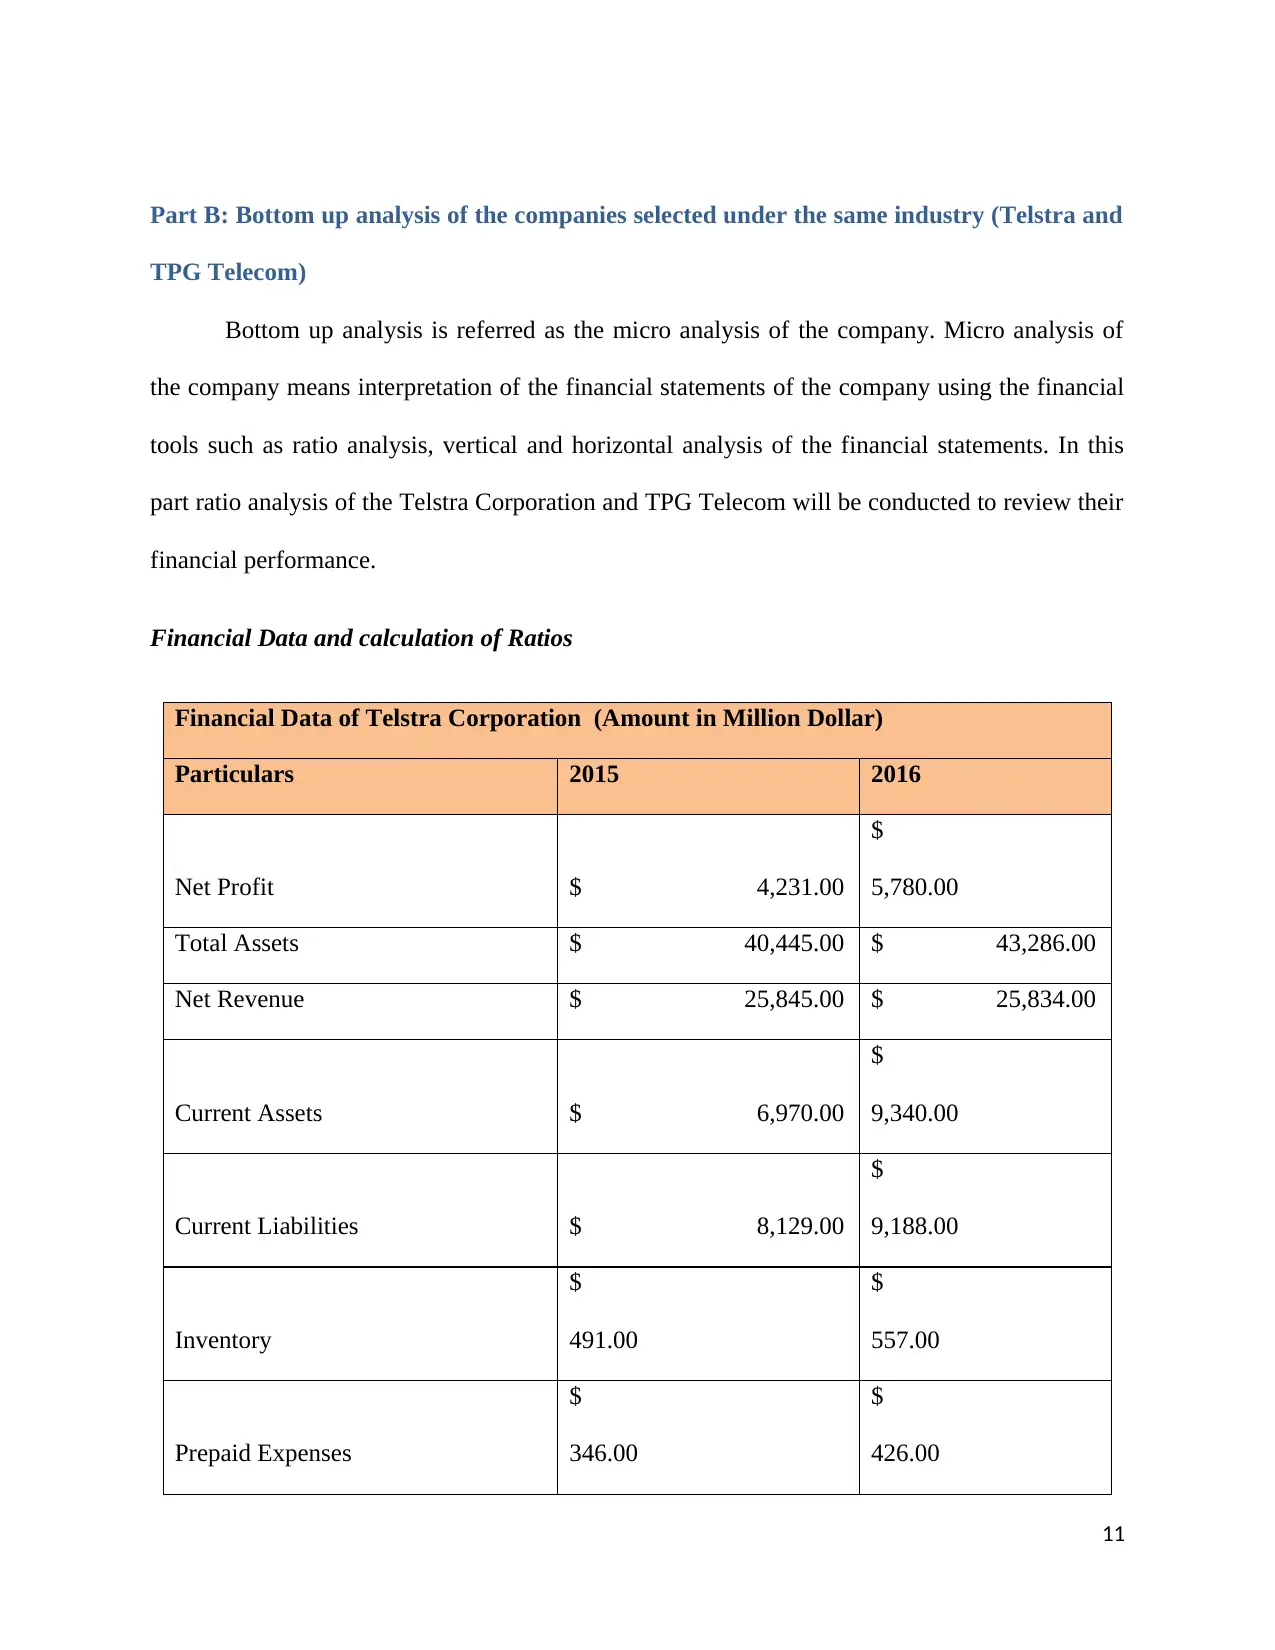
Bottom up analysis is referred as the micro analysis of the company. Micro analysis of
the company means interpretation of the financial statements of the company using the financial
tools such as ratio analysis, vertical and horizontal analysis of the financial statements. In this
part ratio analysis of the Telstra Corporation and TPG Telecom will be conducted to review their
financial performance.
Financial Data and calculation of Ratios
Financial Data of Telstra Corporation (Amount in Million Dollar)
Particulars 2015 2016
Net Profit $ 4,231.00
$
5,780.00
Total Assets $ 40,445.00 $ 43,286.00
Net Revenue $ 25,845.00 $ 25,834.00
Current Assets $ 6,970.00
$
9,340.00
Current Liabilities $ 8,129.00
$
9,188.00
Inventory
$
491.00
$
557.00
Prepaid Expenses
$
346.00
$
426.00
11
TPG Telecom)
Bottom up analysis is referred as the micro analysis of the company. Micro analysis of
the company means interpretation of the financial statements of the company using the financial
tools such as ratio analysis, vertical and horizontal analysis of the financial statements. In this
part ratio analysis of the Telstra Corporation and TPG Telecom will be conducted to review their
financial performance.
Financial Data and calculation of Ratios
Financial Data of Telstra Corporation (Amount in Million Dollar)
Particulars 2015 2016
Net Profit $ 4,231.00
$
5,780.00
Total Assets $ 40,445.00 $ 43,286.00
Net Revenue $ 25,845.00 $ 25,834.00
Current Assets $ 6,970.00
$
9,340.00
Current Liabilities $ 8,129.00
$
9,188.00
Inventory
$
491.00
$
557.00
Prepaid Expenses
$
346.00
$
426.00
11
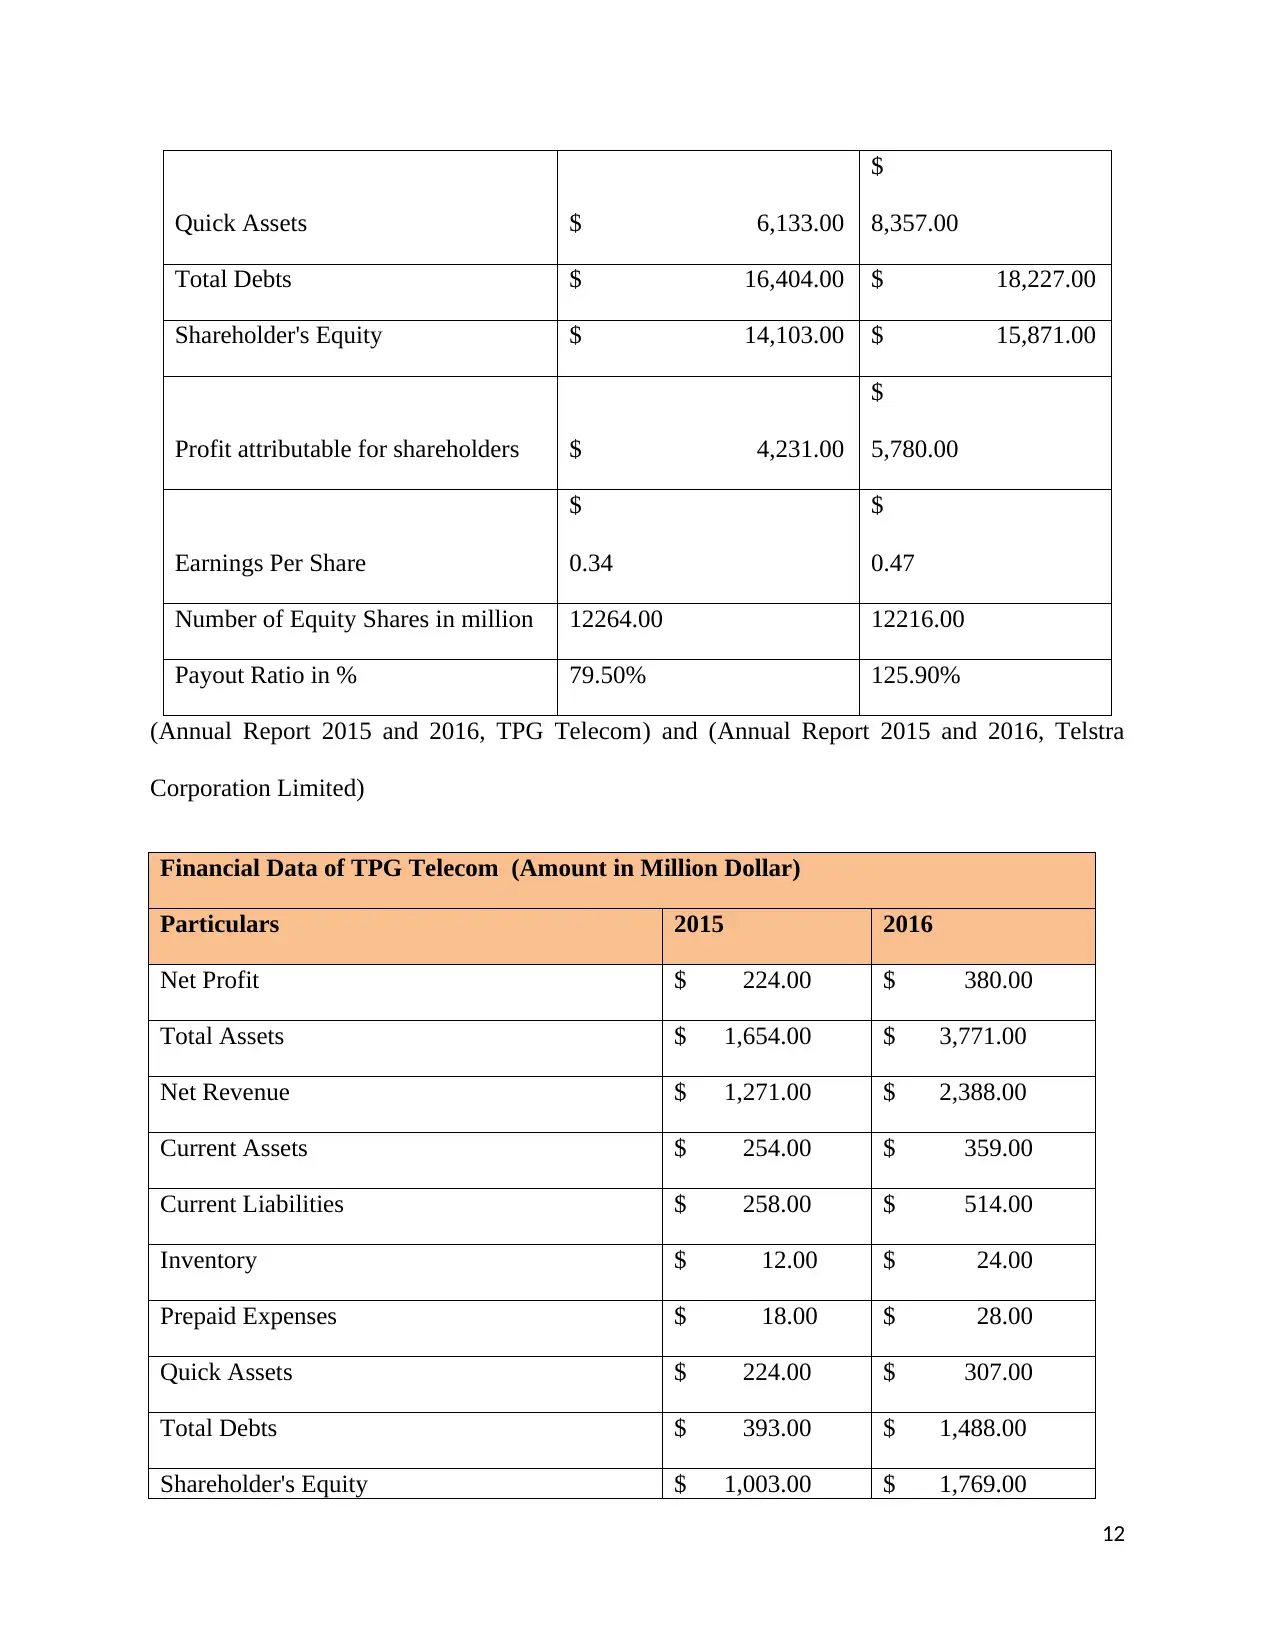
Quick Assets $ 6,133.00
$
8,357.00
Total Debts $ 16,404.00 $ 18,227.00
Shareholder's Equity $ 14,103.00 $ 15,871.00
Profit attributable for shareholders $ 4,231.00
$
5,780.00
Earnings Per Share
$
0.34
$
0.47
Number of Equity Shares in million 12264.00 12216.00
Payout Ratio in % 79.50% 125.90%
(Annual Report 2015 and 2016, TPG Telecom) and (Annual Report 2015 and 2016, Telstra
Corporation Limited)
Financial Data of TPG Telecom (Amount in Million Dollar)
Particulars 2015 2016
Net Profit $ 224.00 $ 380.00
Total Assets $ 1,654.00 $ 3,771.00
Net Revenue $ 1,271.00 $ 2,388.00
Current Assets $ 254.00 $ 359.00
Current Liabilities $ 258.00 $ 514.00
Inventory $ 12.00 $ 24.00
Prepaid Expenses $ 18.00 $ 28.00
Quick Assets $ 224.00 $ 307.00
Total Debts $ 393.00 $ 1,488.00
Shareholder's Equity $ 1,003.00 $ 1,769.00
12
$
8,357.00
Total Debts $ 16,404.00 $ 18,227.00
Shareholder's Equity $ 14,103.00 $ 15,871.00
Profit attributable for shareholders $ 4,231.00
$
5,780.00
Earnings Per Share
$
0.34
$
0.47
Number of Equity Shares in million 12264.00 12216.00
Payout Ratio in % 79.50% 125.90%
(Annual Report 2015 and 2016, TPG Telecom) and (Annual Report 2015 and 2016, Telstra
Corporation Limited)
Financial Data of TPG Telecom (Amount in Million Dollar)
Particulars 2015 2016
Net Profit $ 224.00 $ 380.00
Total Assets $ 1,654.00 $ 3,771.00
Net Revenue $ 1,271.00 $ 2,388.00
Current Assets $ 254.00 $ 359.00
Current Liabilities $ 258.00 $ 514.00
Inventory $ 12.00 $ 24.00
Prepaid Expenses $ 18.00 $ 28.00
Quick Assets $ 224.00 $ 307.00
Total Debts $ 393.00 $ 1,488.00
Shareholder's Equity $ 1,003.00 $ 1,769.00
12
⊘ This is a preview!⊘
Do you want full access?
Subscribe today to unlock all pages.
Trusted by 1+ million students worldwide
1 out of 20
Related Documents


Your All-in-One AI-Powered Toolkit for Academic Success.
+13062052269
info@desklib.com
Available 24*7 on WhatsApp / Email
![[object Object]](/_next/static/media/star-bottom.7253800d.svg)
Unlock your academic potential
Copyright © 2020–2026 A2Z Services. All Rights Reserved. Developed and managed by ZUCOL.