Tesco PLC: Analysis of Financial Resource Management and Performance
VerifiedAdded on 2023/01/16
|20
|4967
|1
Report
AI Summary
This report provides a detailed analysis of Tesco's financial resource management. It begins with an introduction to financial resource management principles and then focuses on Tesco's performance. The report includes a thorough ratio analysis, evaluating profitability, liquidity, and efficiency ratios, comparing 2017 and 2018 data. It examines income statement and balance sheet analyses, assessing the company's financial health and identifying key performance indicators (KPIs). The analysis covers Tesco's market position, including its share in the UK retail sector and its competitive landscape. The report also explores the value drivers and KPIs used by Tesco to achieve its goals. The report concludes with an overview of Tesco's financial strategies and overall performance.
Managing Financial Resources
Paraphrase This Document
Need a fresh take? Get an instant paraphrase of this document with our AI Paraphraser
Table of Contents
INTRODUCTION...........................................................................................................................3
Ratio Analysis .............................................................................................................................4
Income statement analysis ..............................................................................................................7
Balance sheet Analysis ...................................................................................................................8
a. Liquidity analysis ....................................................................................................................9
b. Efficiency analysis ..................................................................................................................9
c. Solvency analysis ..................................................................................................................10
Key performance Indicators...........................................................................................................10
(1) The company’s historical record and position in the market.....................................................1
(2) What might appear to be the value drivers and/or the key performance indicators in the
company?.........................................................................................................................................5
CONCLUSION................................................................................................................................6
REFERENCES................................................................................................................................1
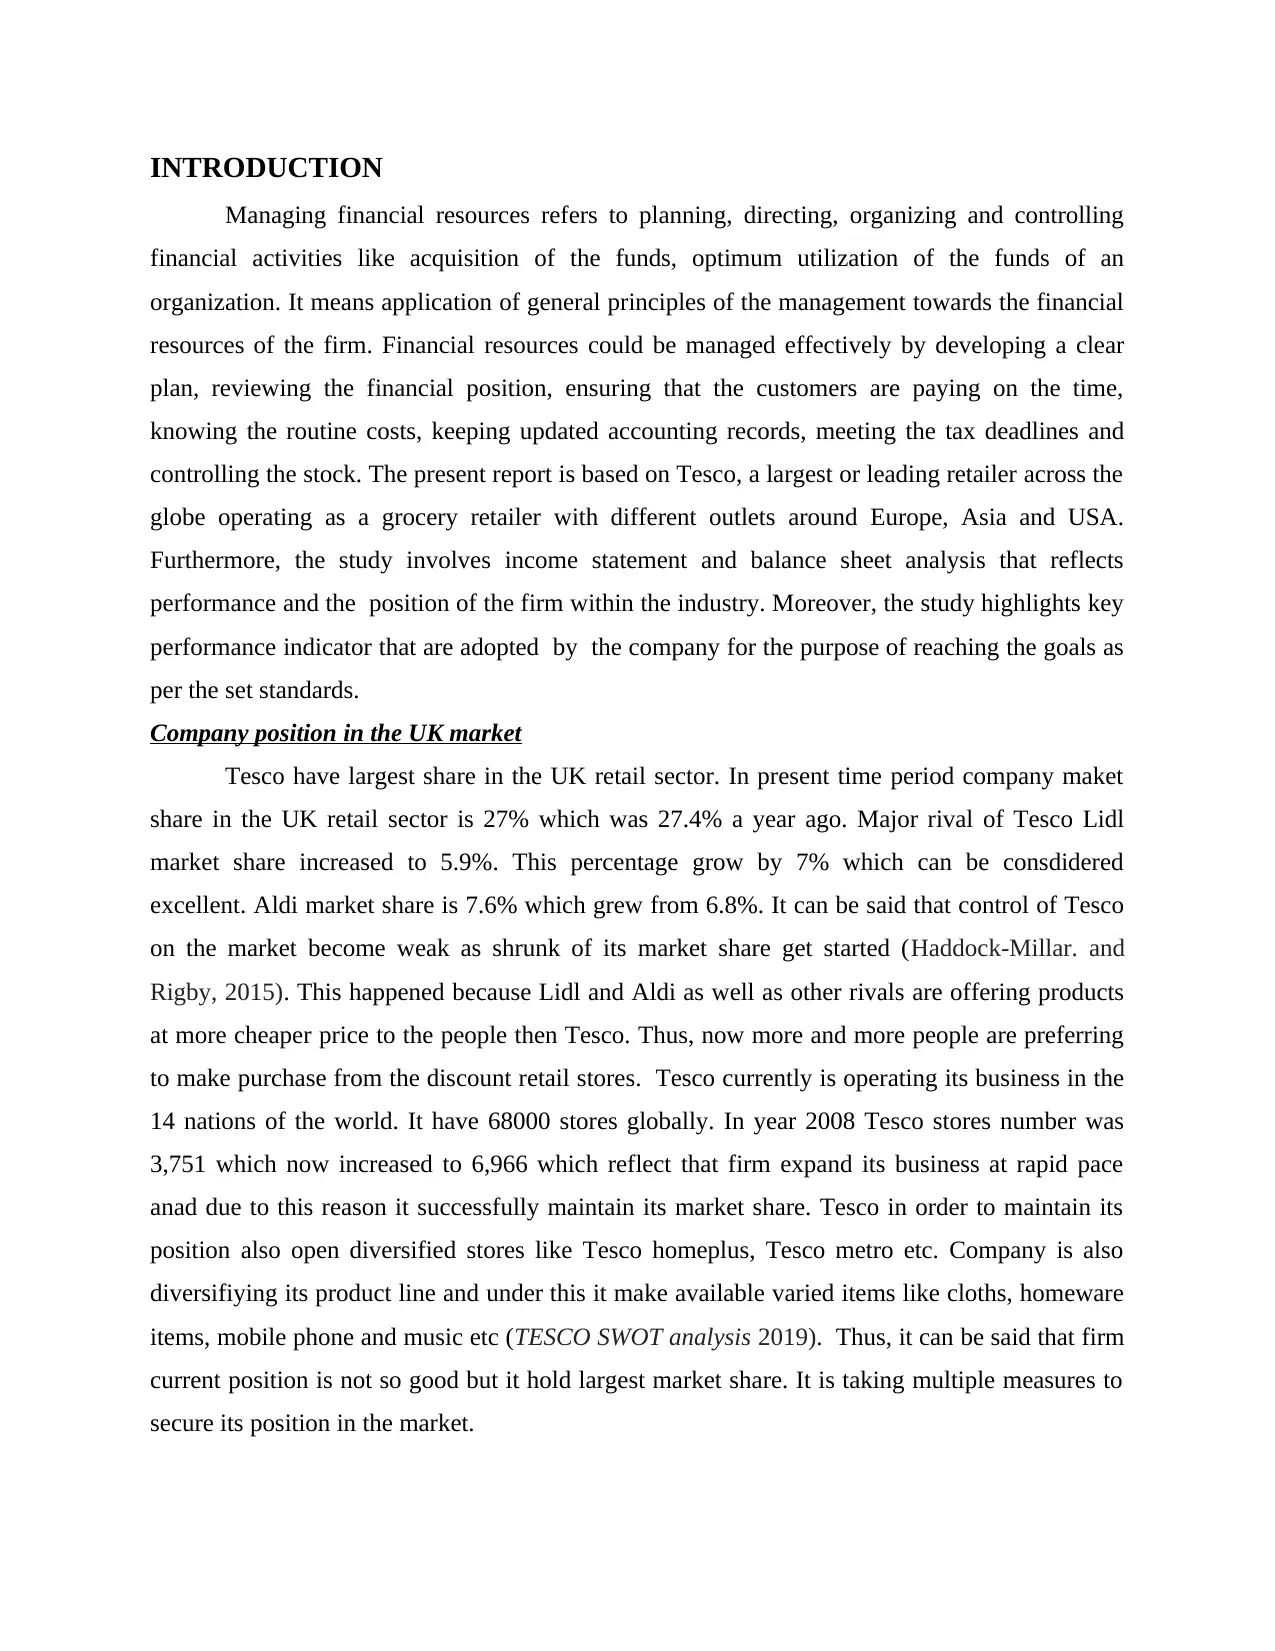
INTRODUCTION
Managing financial resources refers to planning, directing, organizing and controlling
financial activities like acquisition of the funds, optimum utilization of the funds of an
organization. It means application of general principles of the management towards the financial
resources of the firm. Financial resources could be managed effectively by developing a clear
plan, reviewing the financial position, ensuring that the customers are paying on the time,
knowing the routine costs, keeping updated accounting records, meeting the tax deadlines and
controlling the stock. The present report is based on Tesco, a largest or leading retailer across the
globe operating as a grocery retailer with different outlets around Europe, Asia and USA.
Furthermore, the study involves income statement and balance sheet analysis that reflects
performance and the position of the firm within the industry. Moreover, the study highlights key
performance indicator that are adopted by the company for the purpose of reaching the goals as
per the set standards.
Company position in the UK market
Tesco have largest share in the UK retail sector. In present time period company maket
share in the UK retail sector is 27% which was 27.4% a year ago. Major rival of Tesco Lidl
market share increased to 5.9%. This percentage grow by 7% which can be consdidered
excellent. Aldi market share is 7.6% which grew from 6.8%. It can be said that control of Tesco
on the market become weak as shrunk of its market share get started (Haddock-Millar. and
Rigby, 2015). This happened because Lidl and Aldi as well as other rivals are offering products
at more cheaper price to the people then Tesco. Thus, now more and more people are preferring
to make purchase from the discount retail stores. Tesco currently is operating its business in the
14 nations of the world. It have 68000 stores globally. In year 2008 Tesco stores number was
3,751 which now increased to 6,966 which reflect that firm expand its business at rapid pace
anad due to this reason it successfully maintain its market share. Tesco in order to maintain its
position also open diversified stores like Tesco homeplus, Tesco metro etc. Company is also
diversifiying its product line and under this it make available varied items like cloths, homeware
items, mobile phone and music etc (TESCO SWOT analysis 2019). Thus, it can be said that firm
current position is not so good but it hold largest market share. It is taking multiple measures to
secure its position in the market.
⊘ This is a preview!⊘
Do you want full access?
Subscribe today to unlock all pages.
Trusted by 1+ million students worldwide
Ratio Analysis
TESCO PLC
Ratio Analysis
Particulars Formula 2018 2017
Profitability
Ratios
Return on
capital
employed
Net operating
profit/Employe
d Capital 15.80% 1.27%
Employed
Capital
Total assets –
Current
liabilities (13726-5512) 8214 (15417-3988) 11429
Net operating
profit 1298 145
Return on
Equity
Net Income /
Shareholder's
Equity 11.55% -0.84%
Net Income 1208 -54
Shareholder's
Equity 10458 6414
Gross profit
margin
Total Sales –
COGS/Total
Sales 5.83% 5.19%
COS 54141 53015
Paraphrase This Document
Need a fresh take? Get an instant paraphrase of this document with our AI Paraphraser
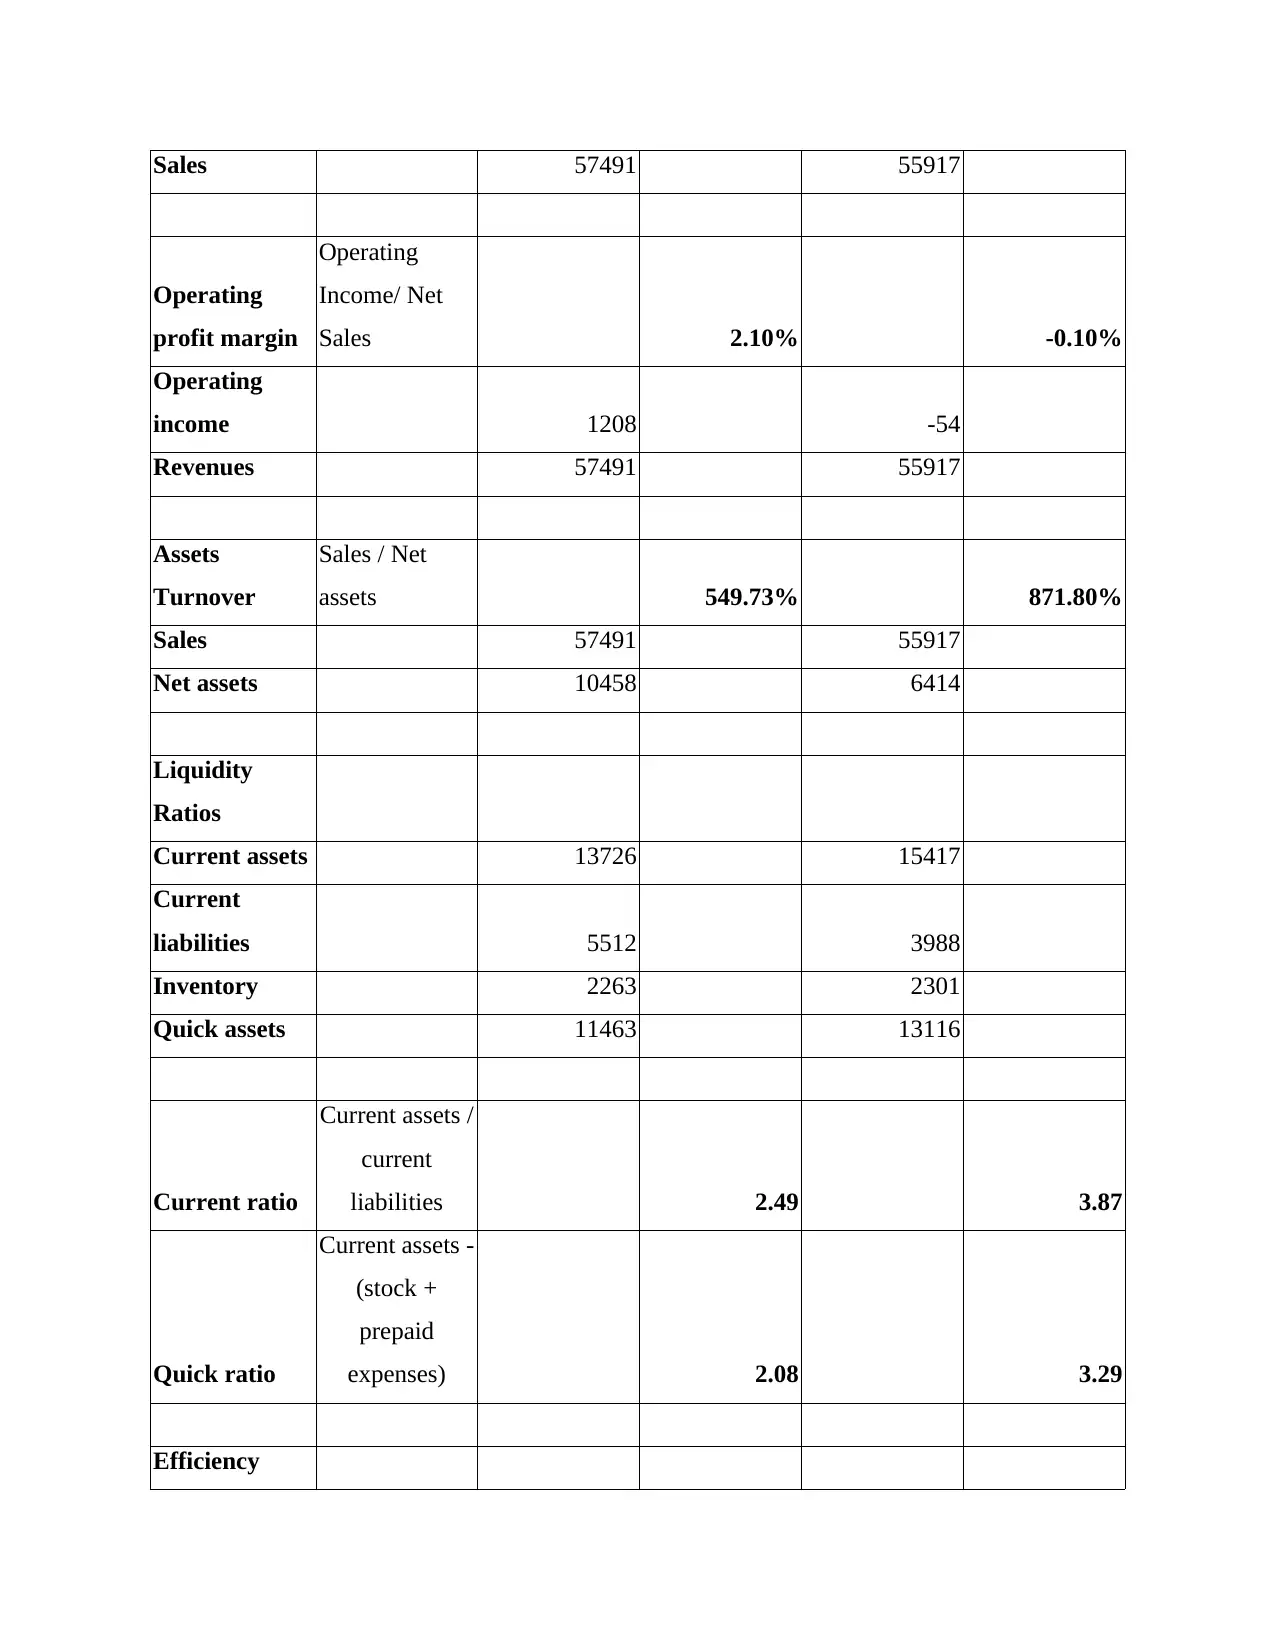
Sales 57491 55917
Operating
profit margin
Operating
Income/ Net
Sales 2.10% -0.10%
Operating
income 1208 -54
Revenues 57491 55917
Assets
Turnover
Sales / Net
assets 549.73% 871.80%
Sales 57491 55917
Net assets 10458 6414
Liquidity
Ratios
Current assets 13726 15417
Current
liabilities 5512 3988
Inventory 2263 2301
Quick assets 11463 13116
Current ratio
Current assets /
current
liabilities 2.49 3.87
Quick ratio
Current assets -
(stock +
prepaid
expenses) 2.08 3.29
Efficiency
Operating
profit margin
Operating
Income/ Net
Sales 2.10% -0.10%
Operating
income 1208 -54
Revenues 57491 55917
Assets
Turnover
Sales / Net
assets 549.73% 871.80%
Sales 57491 55917
Net assets 10458 6414
Liquidity
Ratios
Current assets 13726 15417
Current
liabilities 5512 3988
Inventory 2263 2301
Quick assets 11463 13116
Current ratio
Current assets /
current
liabilities 2.49 3.87
Quick ratio
Current assets -
(stock +
prepaid
expenses) 2.08 3.29
Efficiency
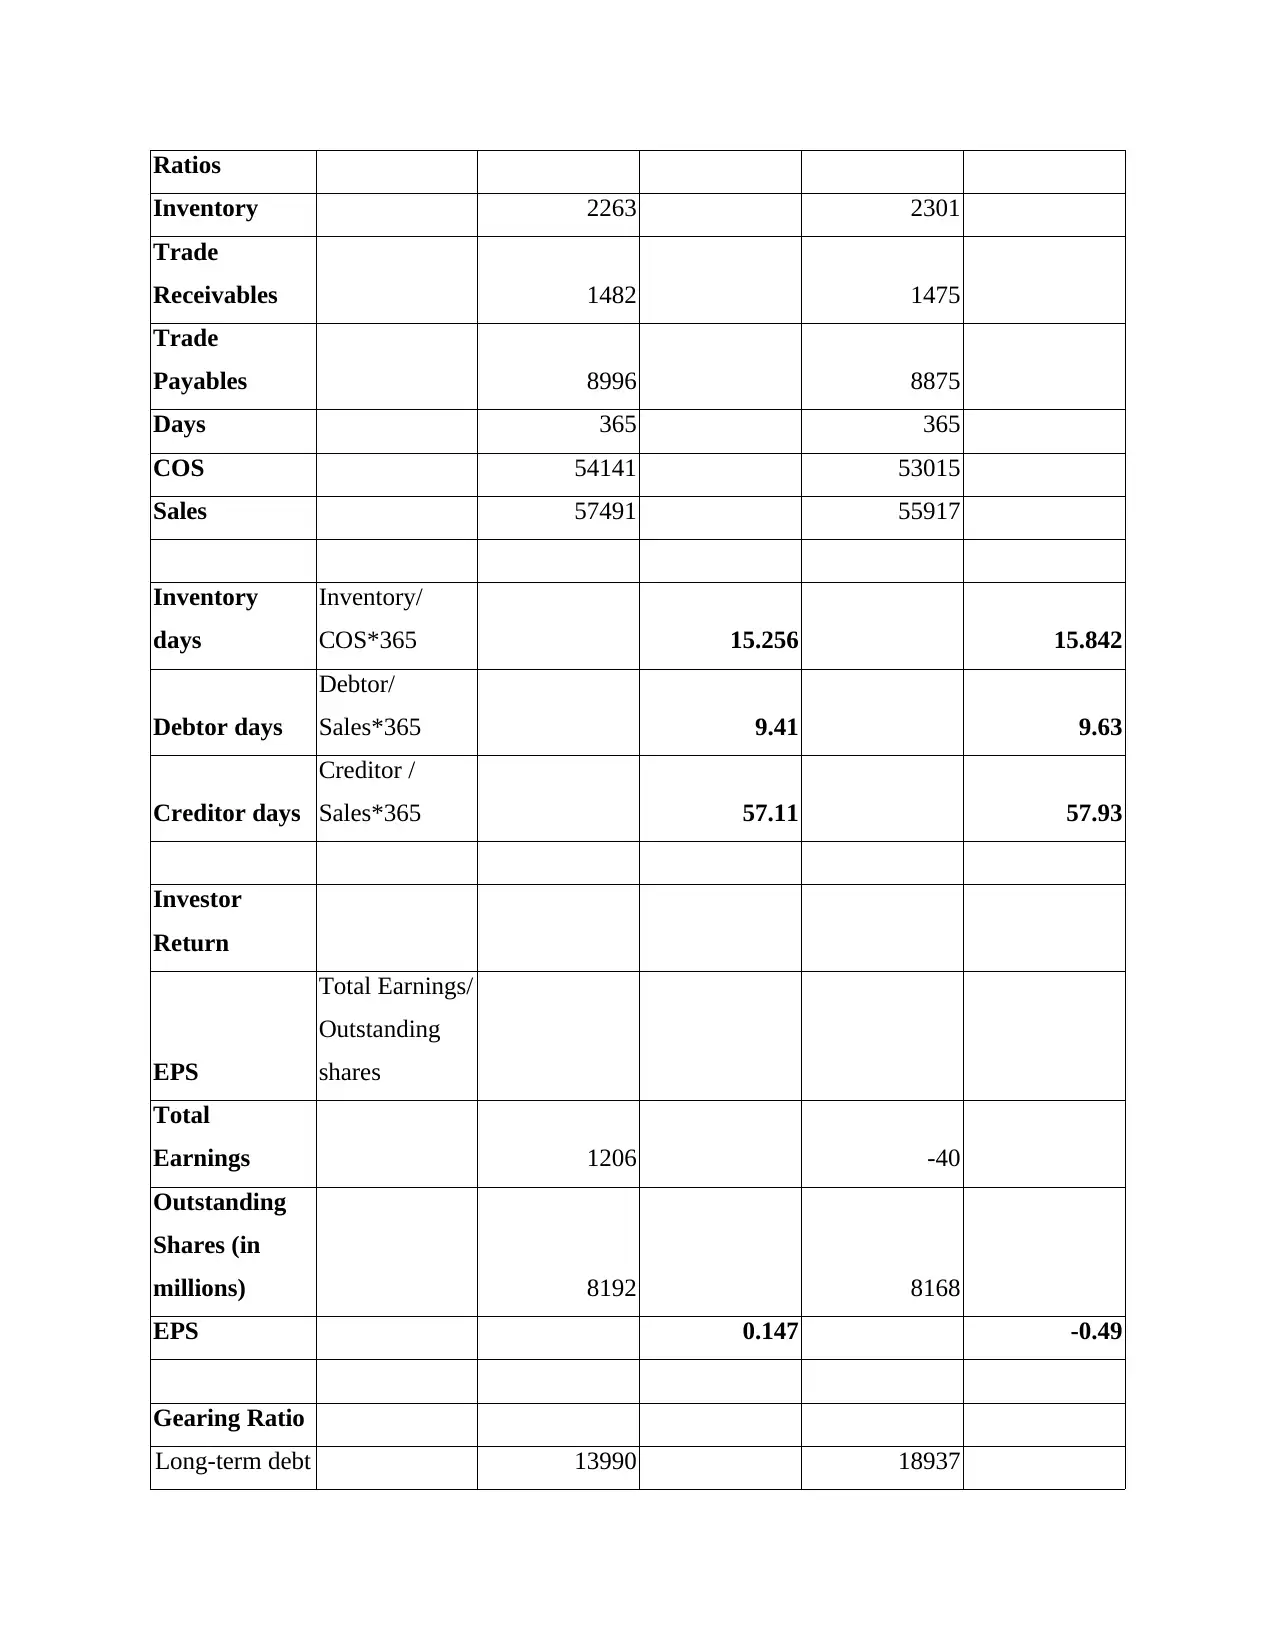
Ratios
Inventory 2263 2301
Trade
Receivables 1482 1475
Trade
Payables 8996 8875
Days 365 365
COS 54141 53015
Sales 57491 55917
Inventory
days
Inventory/
COS*365 15.256 15.842
Debtor days
Debtor/
Sales*365 9.41 9.63
Creditor days
Creditor /
Sales*365 57.11 57.93
Investor
Return
EPS
Total Earnings/
Outstanding
shares
Total
Earnings 1206 -40
Outstanding
Shares (in
millions) 8192 8168
EPS 0.147 -0.49
Gearing Ratio
Long-term debt 13990 18937
⊘ This is a preview!⊘
Do you want full access?
Subscribe today to unlock all pages.
Trusted by 1+ million students worldwide
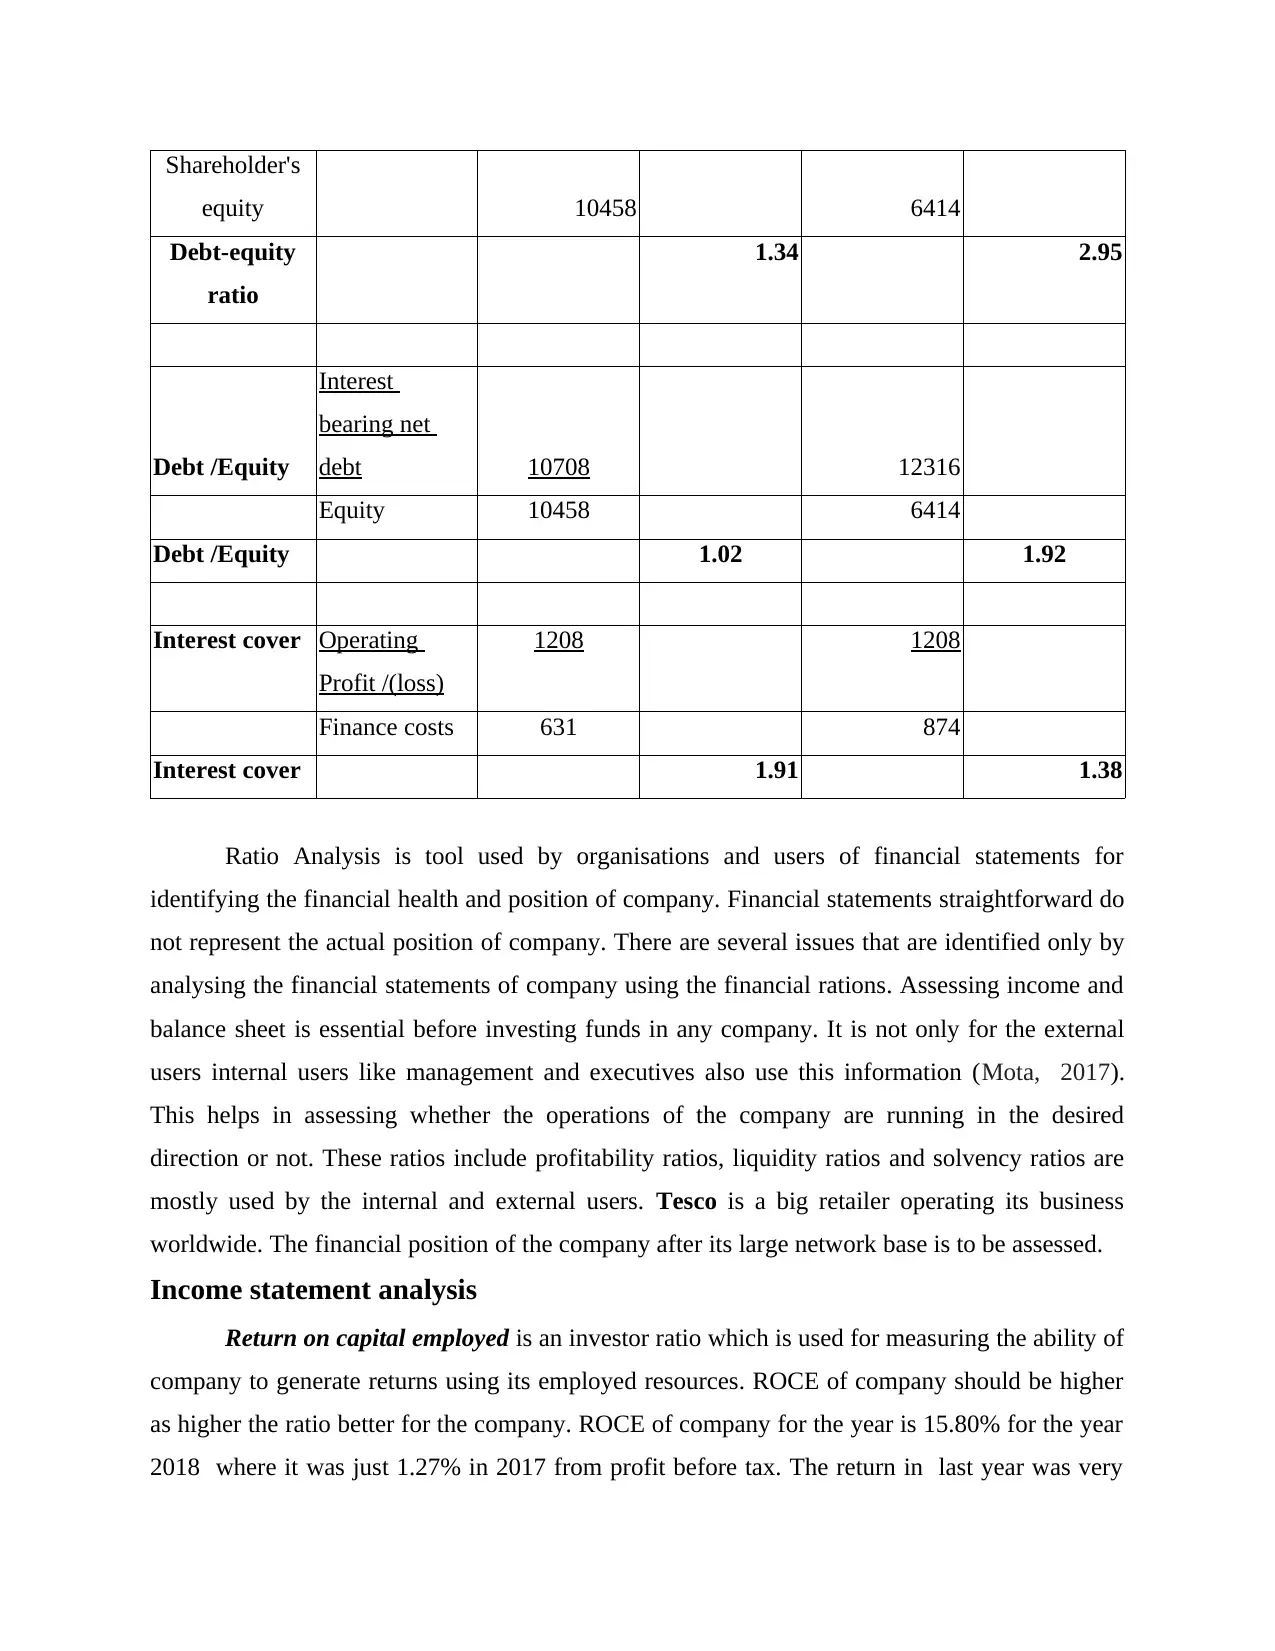
Shareholder's
equity 10458 6414
Debt-equity
ratio
1.34 2.95
Debt /Equity
Interest
bearing net
debt 10708 12316
Equity 10458 6414
Debt /Equity 1.02 1.92
Interest cover Operating
Profit /(loss)
1208 1208
Finance costs 631 874
Interest cover 1.91 1.38
Ratio Analysis is tool used by organisations and users of financial statements for
identifying the financial health and position of company. Financial statements straightforward do
not represent the actual position of company. There are several issues that are identified only by
analysing the financial statements of company using the financial rations. Assessing income and
balance sheet is essential before investing funds in any company. It is not only for the external
users internal users like management and executives also use this information (Mota, 2017).
This helps in assessing whether the operations of the company are running in the desired
direction or not. These ratios include profitability ratios, liquidity ratios and solvency ratios are
mostly used by the internal and external users. Tesco is a big retailer operating its business
worldwide. The financial position of the company after its large network base is to be assessed.
Income statement analysis
Return on capital employed is an investor ratio which is used for measuring the ability of
company to generate returns using its employed resources. ROCE of company should be higher
as higher the ratio better for the company. ROCE of company for the year is 15.80% for the year
2018 where it was just 1.27% in 2017 from profit before tax. The return in last year was very
Paraphrase This Document
Need a fresh take? Get an instant paraphrase of this document with our AI Paraphraser
low however the structural change of company helped the company to regain the required level
of returns. If the return is lower than nit shows that company is inefficient in using its resources
appropriately (ner Kaya, 2016). This can affect the image of company and people may not invest
funds in company. Return over capital employed can be improved by disposing off the
unproductive assets that are of longer beneficial for the company. Returns company do not have
significantly high returns from its large business.
Return over Equity is an another ratio that is used by the financial analysts for analysing
then returns that are available to the equity investments. This ratio identifies the amount of profit
that is left to the equity owners after carrying out all its expenses and finance costs. Every
company runs business for earning significant amount of profit by putting their money and
investments. Equity holders are the owners of company that are only left with profits of
company. ROE of company inn current year is 11.55% which was negative last year. Negative
ROE represent that company has not earned any profit and instead suffered losses. Seeing the
return it could be assessed company has adopted significant strategies for improving the financial
position of company and its return over equity. There is high improvement in returns that will
help company in attracting new investors as well as in raising funds (Jadoon, Guang and Ali,
2019). This year company has also made profits from the discontinued operations. It is a big
retailer and has large number of equity shareholder therefore it is essential for them to earn
reasonable rate of return.
Gross profit margin ratio is used for measuring the ability of company in running its
business operations. Gross profit refers to the amount that is left with company for carrying out
its further business activities after all the directs costs. Gross profit margin of company is 5.83%
and it was 5.19% last year. It has not shown a considerably variations in the profit levels. This
shows that company that its trading activities had not impacted the business significantly. There
is not significant rise in cost of sales of company. Company has managed to maintain control
over its trading activities of purchasing goods and other direct costs associated with it. This
trading concern do not have high GP as purchases of goods covers its majority costs which is
not the case with manufacturing concerns (Annual Report 2018, 2018). Cost of sale will increase
with increase in cost of other products with inflation in market.
Net profit margin is calculated for assessing whether company is left with profits after
carrying out its operations. This is essential for the business to earn a reasonable rate of return
over th business otherwise business may lose its motivation and effectiveness. Net profit margin
of company is 2.10% in current year 2018. This level of profit does not represent a profitable
company in which funds should be invested. But seeing the position of company which had
negative profits last year it can be seen that company has revived its position and it can be
expected that company may raise its profits to further levels. The decline in last year was seen
mainly due to high level of finance costs. Company last year also suffered losses from it joint
ventures that put the profits further down. Company however managed to reduce its finance cost
this year and it helped it to raise its profit levels. Also this year company had positive returns
from the discontinued operations(Hughen and Strauss, 2017.). Company properly managed its
administration expenses from last year and reduced them appropriately to only towards
productive expenditures. Company along with these expenses should also focus over raising the
revenues and sales so that the earning of the company are high. It should use effective
promotional strategies that will increase its sales levels which help it to generate high returns.
Balance sheet Analysis
It refers to an entire assessment of the all the items on balance sheet at different intervals
of the time that involves quarterly, half-yearly, annually that is utilised by an investors,
institutions and the shareholders in understanding detailed financial state of an entity (Eboli,
2019). It facilitates an outline of most common information that is used by the financial analyst
and an investors in analysing an enterprise.
a. Liquidity analysis
Current ratio- It is considered as the part of the liquidity ratio that determines the
capability of an entity in paying off its current obligations with the use of the current assets.
Higher the ratio seems as better the liquidity position of the company. The ratio greater than 1,
indicates that an enterprise is having sufficient or adequate level of the current assets in settling
down their respective current liabilities. As per the analysis, the current ratio of Tesco in the year
2017, the ratio accounted as 3.87 which is stated as too high current assets and during the year
⊘ This is a preview!⊘
Do you want full access?
Subscribe today to unlock all pages.
Trusted by 1+ million students worldwide
2018, it evaluated as 2.49 which means that ideal liquidity position of Tesco that in shows that it
is making an effective use of its current assets.
Quick ratio- It is seen as the acid-test ratio that measures an ability of the firm in making
use of their near cash or the quick assets for extinguishing its short term liabilities on an
immediate basis. The greater the value of ratio, better the ability of the firm in meeting its
immediate cash requirement. In accordance to the analysis, it has been ascertained that over the
year, the quick ratio of Tesco shown an increasing trend and reaching to the ideal position that is
2.08.
Thus, the overall liquidity of Tesco in current year seen as ideal that means it is managing
its current assets optimally and sufficient cash resources in order to meet its short term needs and
obligations.
b. Efficiency analysis
Inventory days- This ratio measures an average number of the days for which the
corporation is holding its stock before selling it off to the buyers. This ratio measures number of
the days for which the funds are been tied up in the inventory. High inventory days is said to
better as it means that the company is the goods on quick basis and reflects that the demand of
their product is high (Howe, 2018). On the other hand, lower ratio indicates a weaker sales and
the decreasing demand for the product of the company. The results shows that Inventory days of
Tesco is stable which means that it is converting its stock into cash within 15 days and this
shows better efficiency position of the firm.
Debtor days- It measures how quickly the cash is been collected from the debtors. Longer
period depicts that company is taking more time to collect an amount owed. The ratio of Tesco
is showing an decreasing with very little points as reached from 9.63 to 9.41 which means that
the company is focusing on giving goods on the credit basis from one period to another.
Creditor days- It reflects the average number of the time taken by the firm in making
payment of its invoices and liabilities with the trade suppliers. By viewing the ratios of Tesco it
has been interpreted that with passage of the accounting period its creditor days is decreasing and
remains stable which means that it is taking same period of time with very little difference in
paying to its creditor.
Paraphrase This Document
Need a fresh take? Get an instant paraphrase of this document with our AI Paraphraser
c. Solvency analysis
Debt equity ratio- It refers to the financial ratio that indicates a relative proportion of the
shareholders equity and the debt that had been used for financing the assets of the company.
Higher ratio shows higher risk on the firm while lower ratio depicts lower risk as less borrowed
funds are used for financing. The D/E ratios evaluated of the Tesco is seen as declining which
means that its long term borrowings are decreasing and the equities is increasing, this shows a
better solvency position of the company.
Interest coverage ratio- This solvency ratio identifies in an ability of the company in
meeting its interest obligation on the outstanding debts (Blatt and Gulbin, 2018). It is been
computed by dividing earnings of the company before interest and the taxes with that of an
interest expenses for a similar period. Greater the ICR indicates that firm is having sufficient
amount of profits in paying off its interest related expenses. The ICR of Tesco is increasing over
the years which clearly states that its earnings are increasing and has full capability in paying its
interest expenses.
Thus, solvency, efficiency and the liquidity of Tesco is seen as better in the present year
that in turn means the company is managing its assets, liabilities whether current or non-current
in an efficient and effective manner. It is also making an appropriate use of its equities in order
to gain larger returns and meeting the debts.
Key performance Indicators
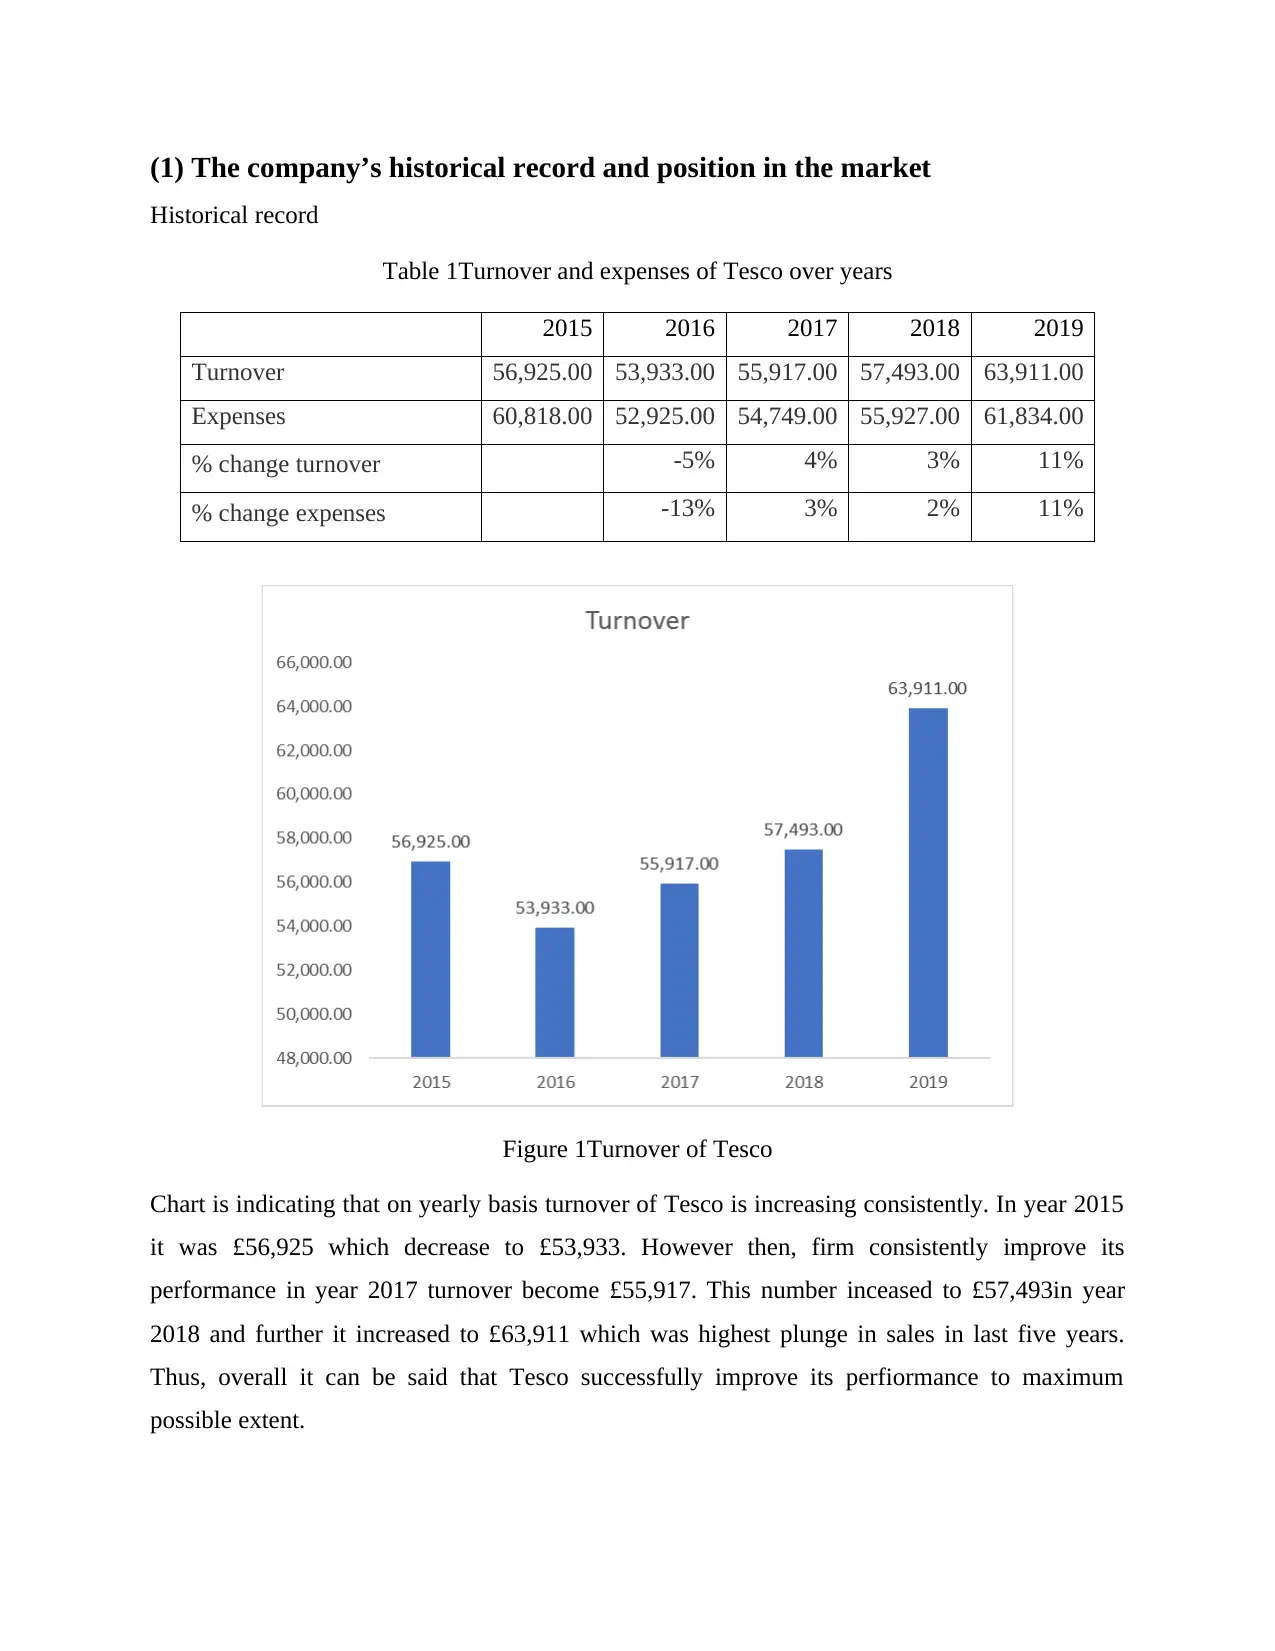
(1) The company’s historical record and position in the market
Historical record
Table 1Turnover and expenses of Tesco over years
2015 2016 2017 2018 2019
Turnover 56,925.00 53,933.00 55,917.00 57,493.00 63,911.00
Expenses 60,818.00 52,925.00 54,749.00 55,927.00 61,834.00
% change turnover -5% 4% 3% 11%
% change expenses -13% 3% 2% 11%
Figure 1Turnover of Tesco
Chart is indicating that on yearly basis turnover of Tesco is increasing consistently. In year 2015
it was £56,925 which decrease to £53,933. However then, firm consistently improve its
performance in year 2017 turnover become £55,917. This number inceased to £57,493in year
2018 and further it increased to £63,911 which was highest plunge in sales in last five years.
Thus, overall it can be said that Tesco successfully improve its perfiormance to maximum
possible extent.
⊘ This is a preview!⊘
Do you want full access?
Subscribe today to unlock all pages.
Trusted by 1+ million students worldwide
1 out of 20
Related Documents


Your All-in-One AI-Powered Toolkit for Academic Success.
+13062052269
info@desklib.com
Available 24*7 on WhatsApp / Email
![[object Object]](/_next/static/media/star-bottom.7253800d.svg)
Unlock your academic potential
Copyright © 2020–2026 A2Z Services. All Rights Reserved. Developed and managed by ZUCOL.