Managerial Accounting: Comprehensive Financial Analysis of Unilever
VerifiedAdded on  2023/03/30
|16
|2373
|310
Case Study
AI Summary
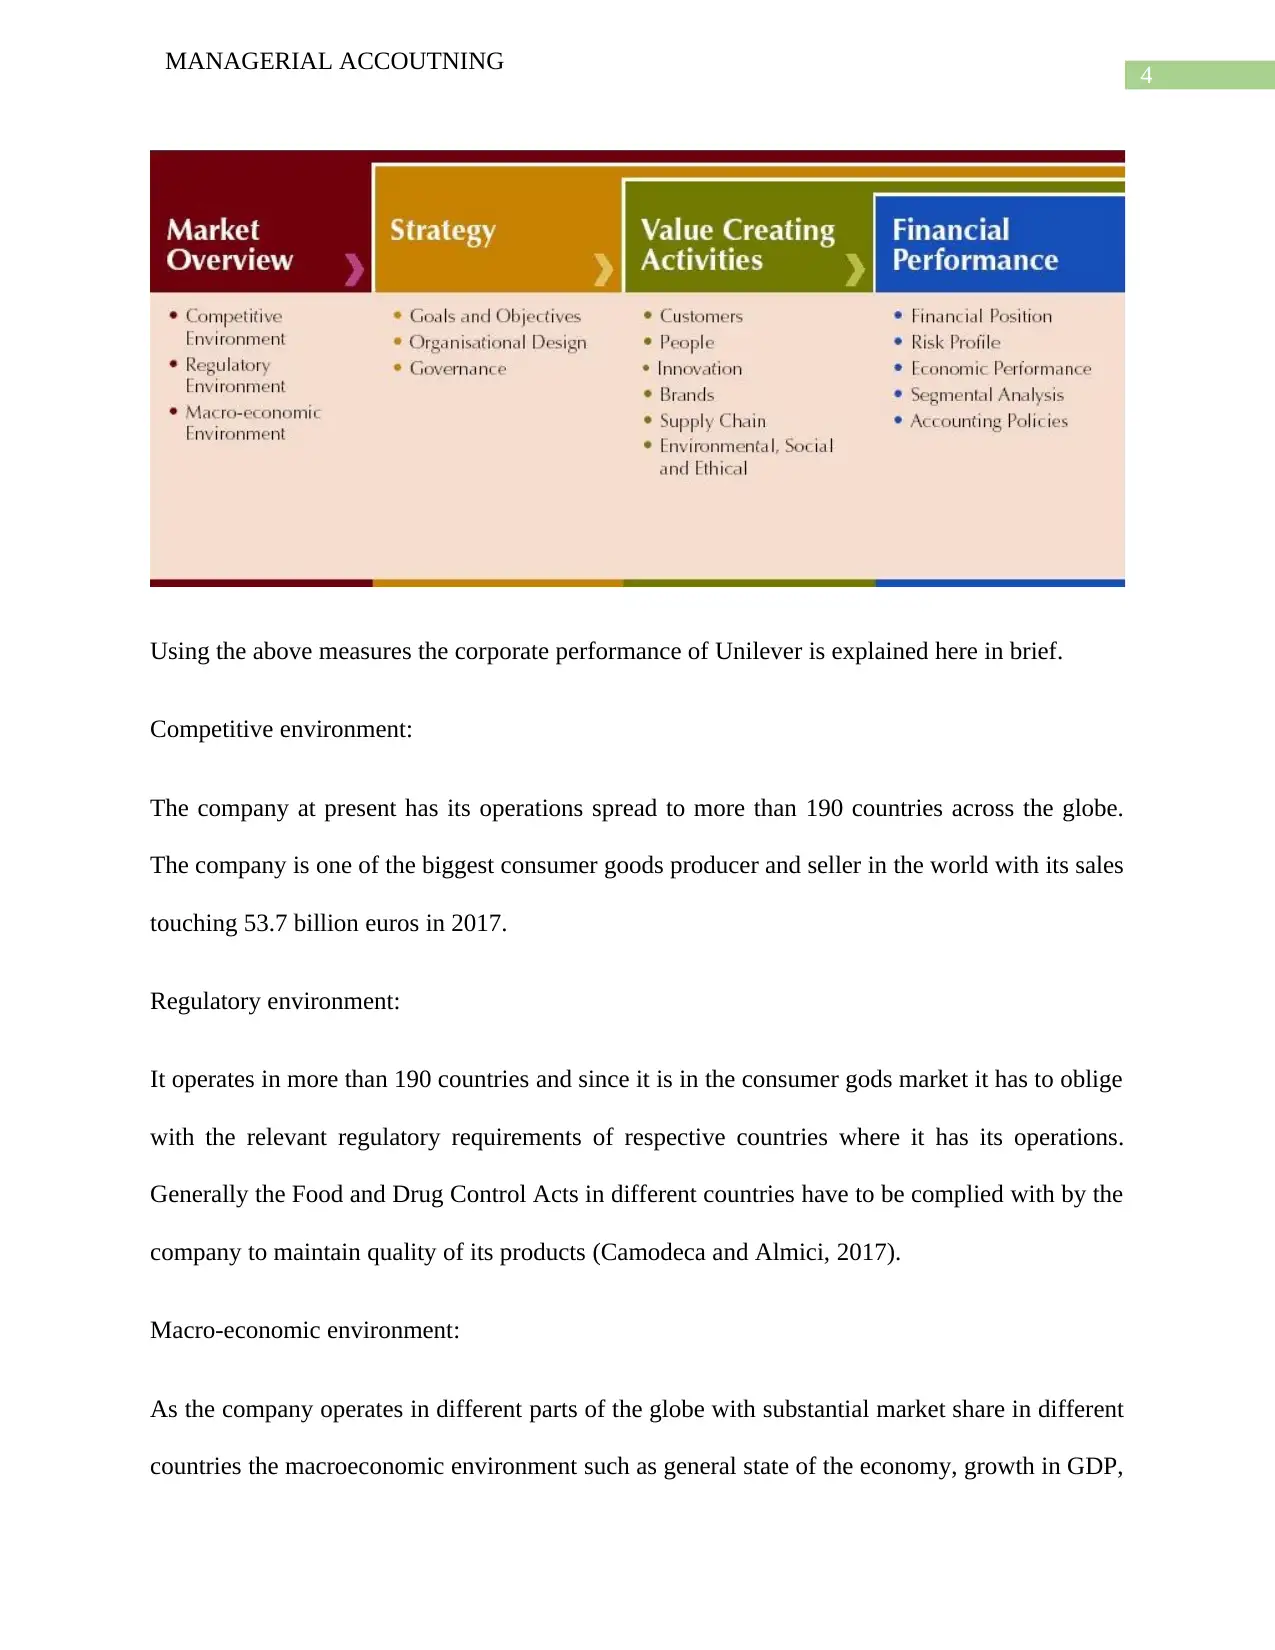
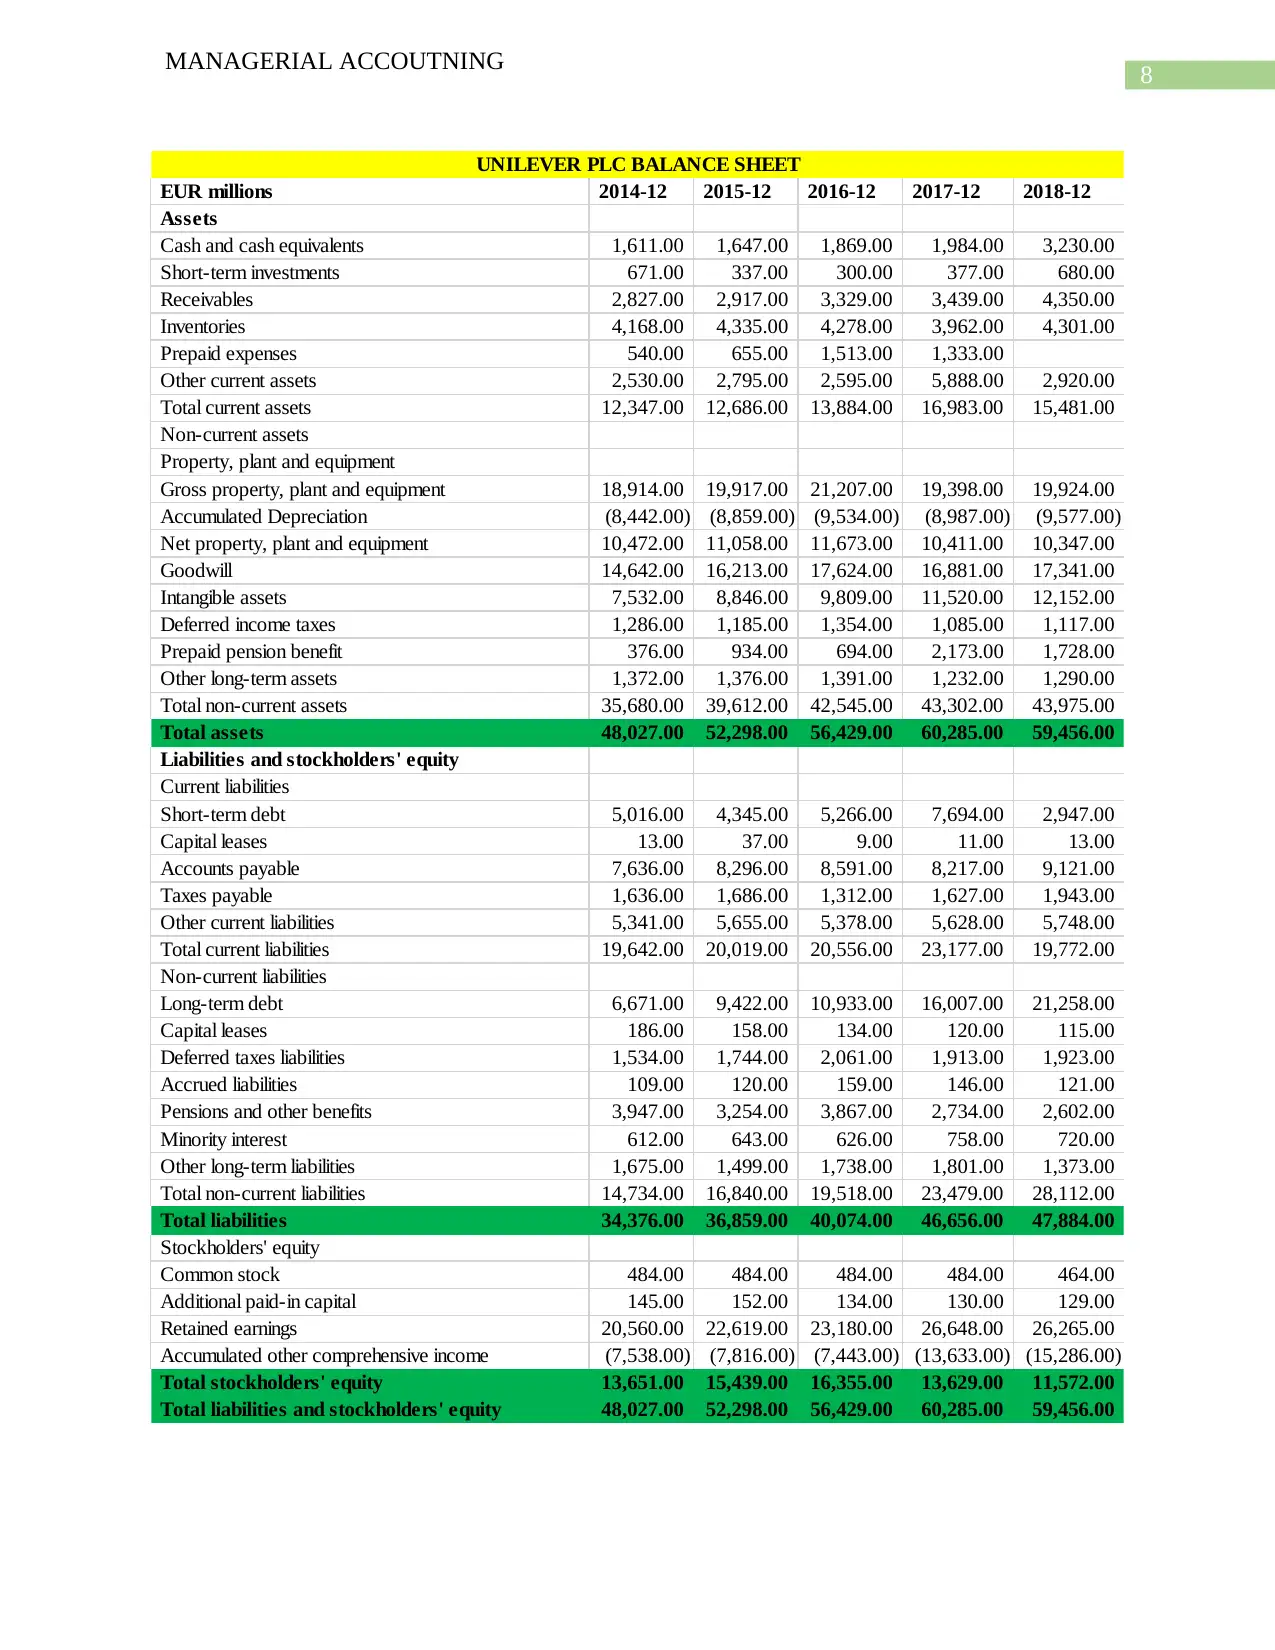
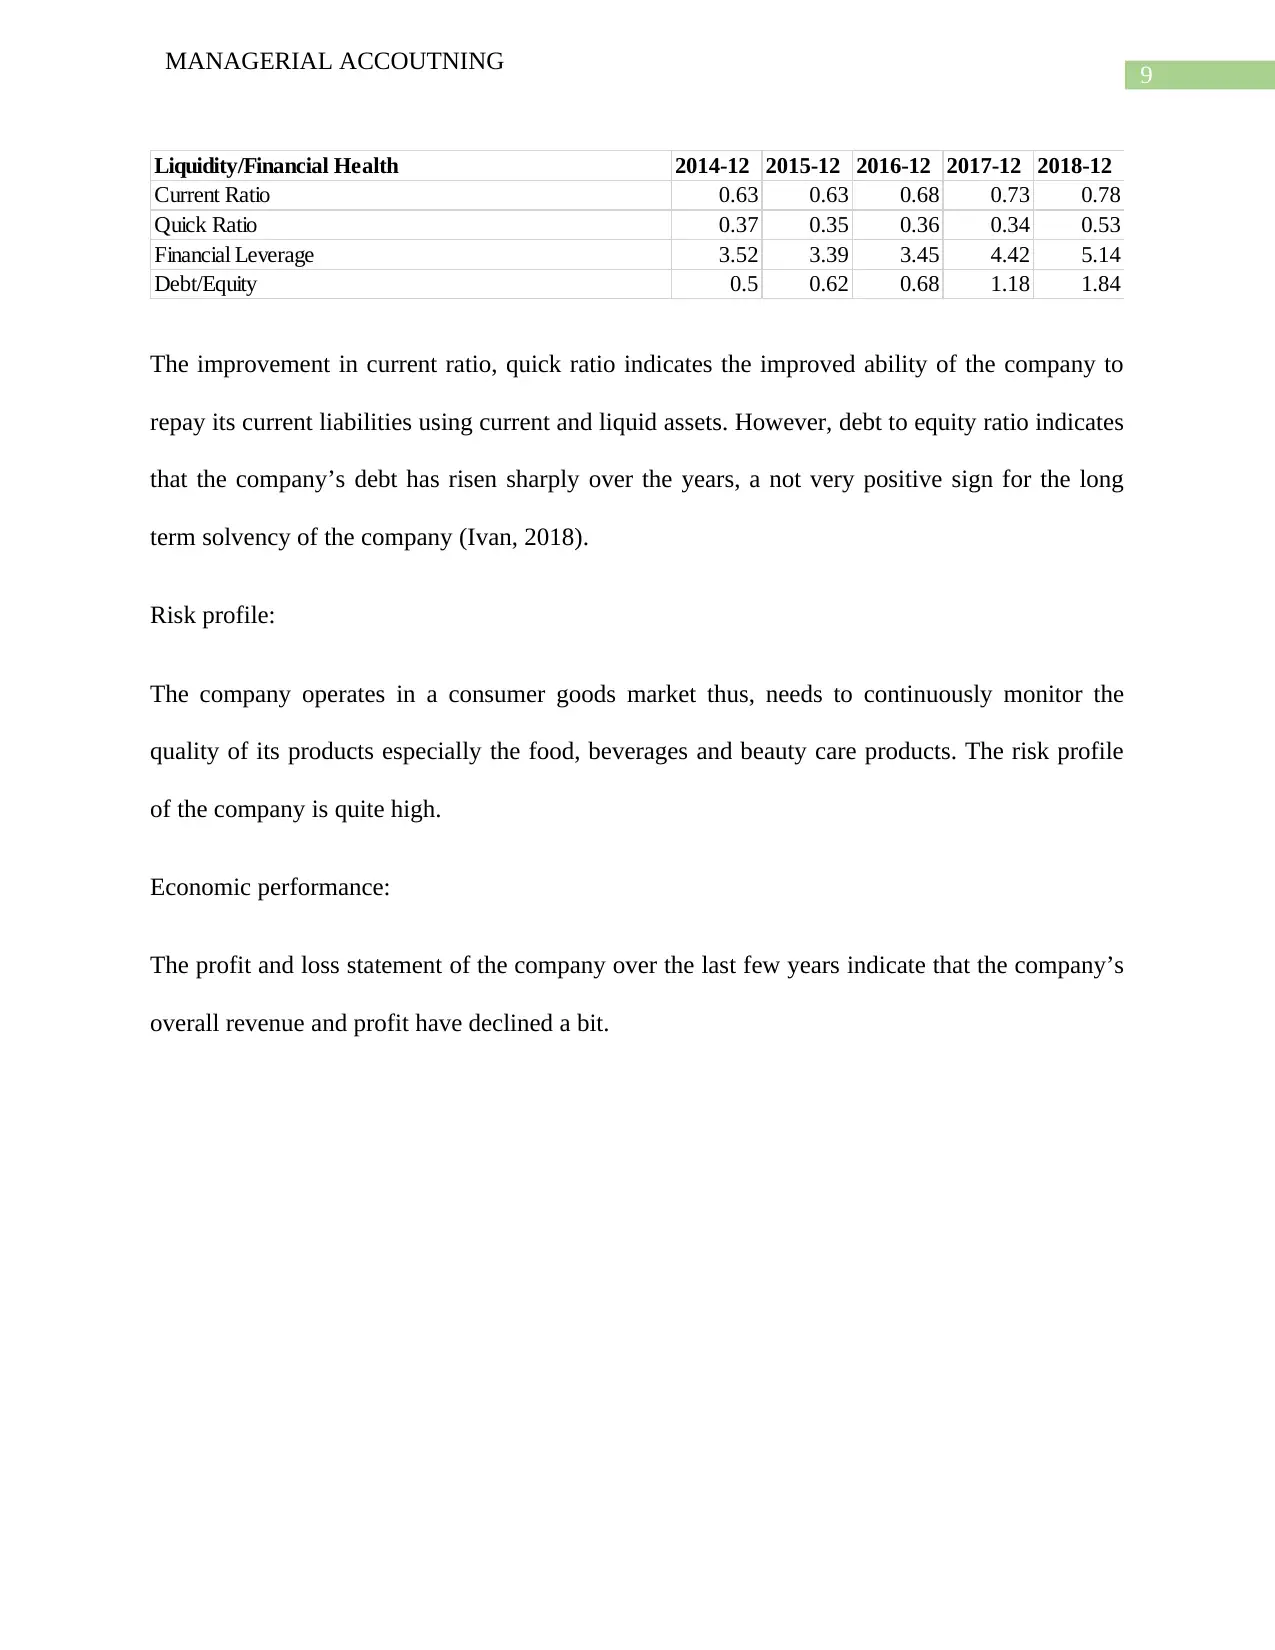
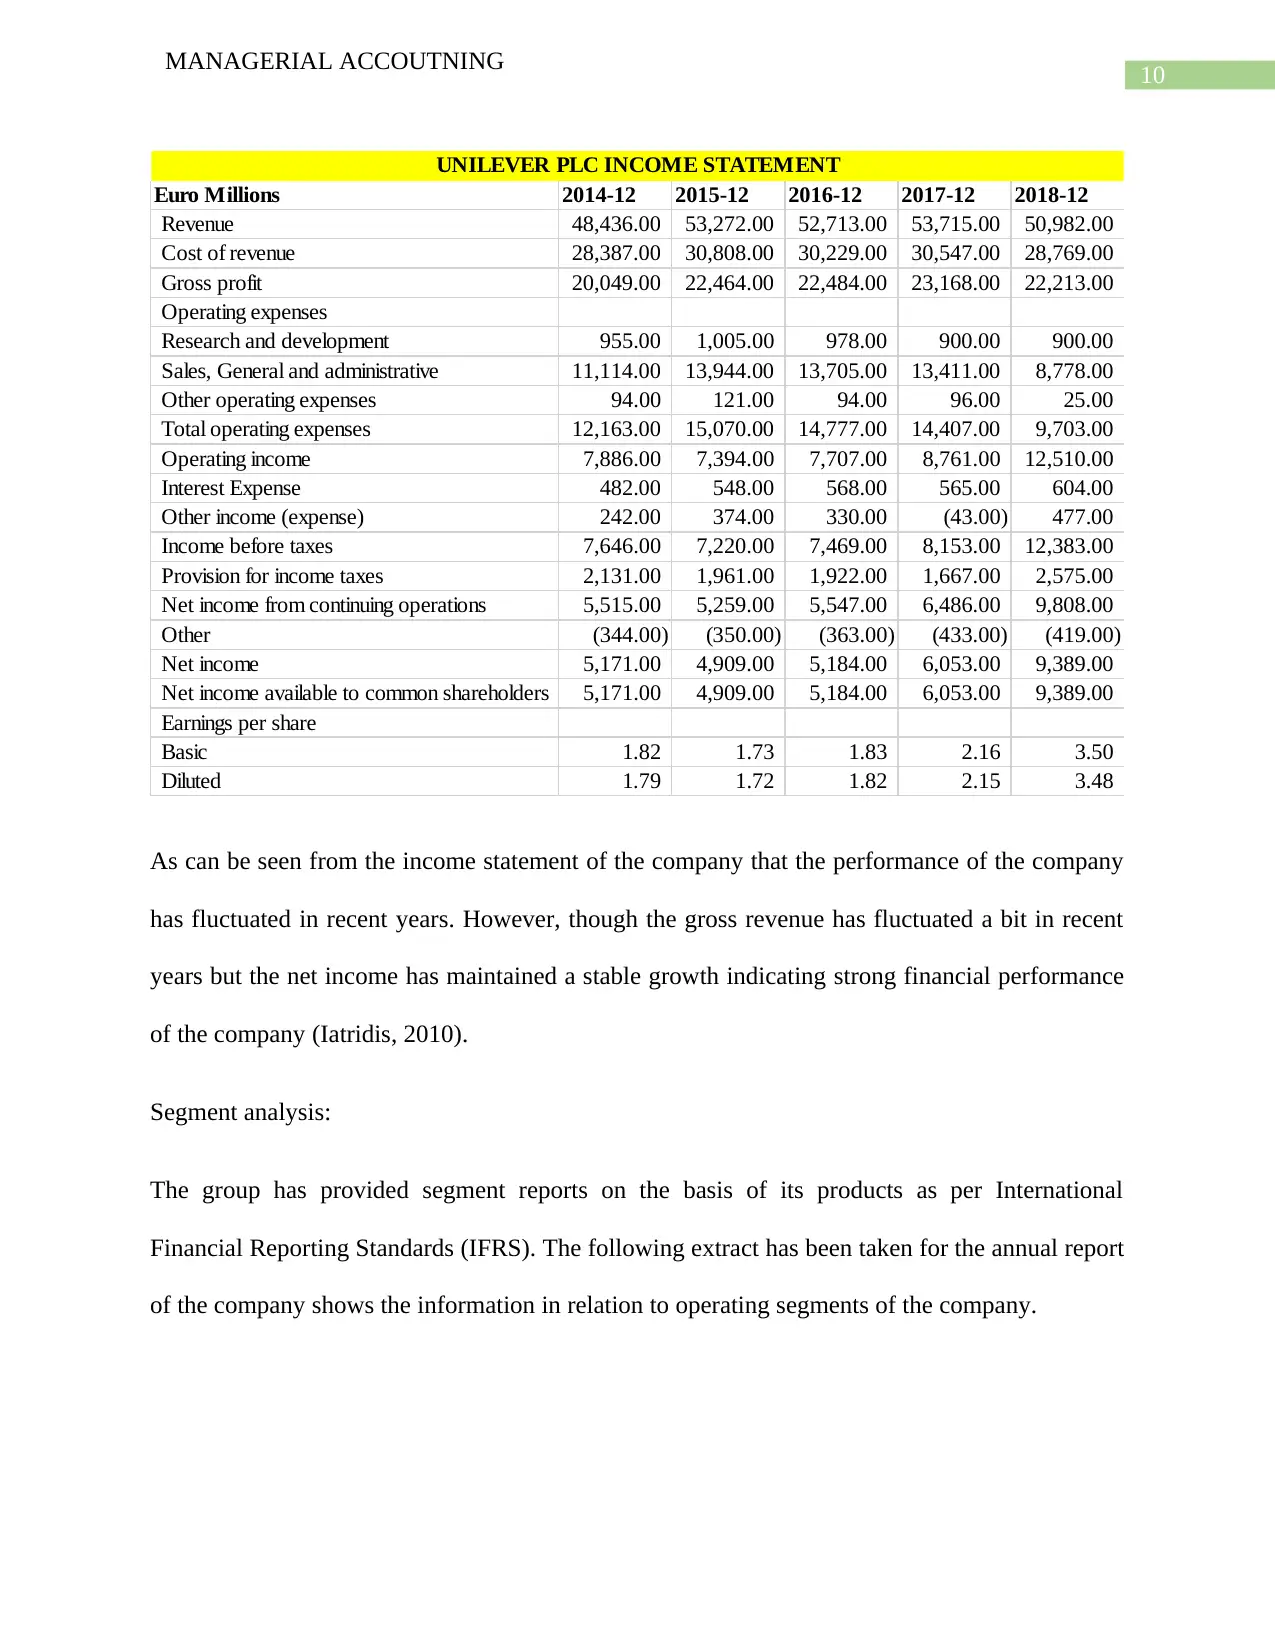
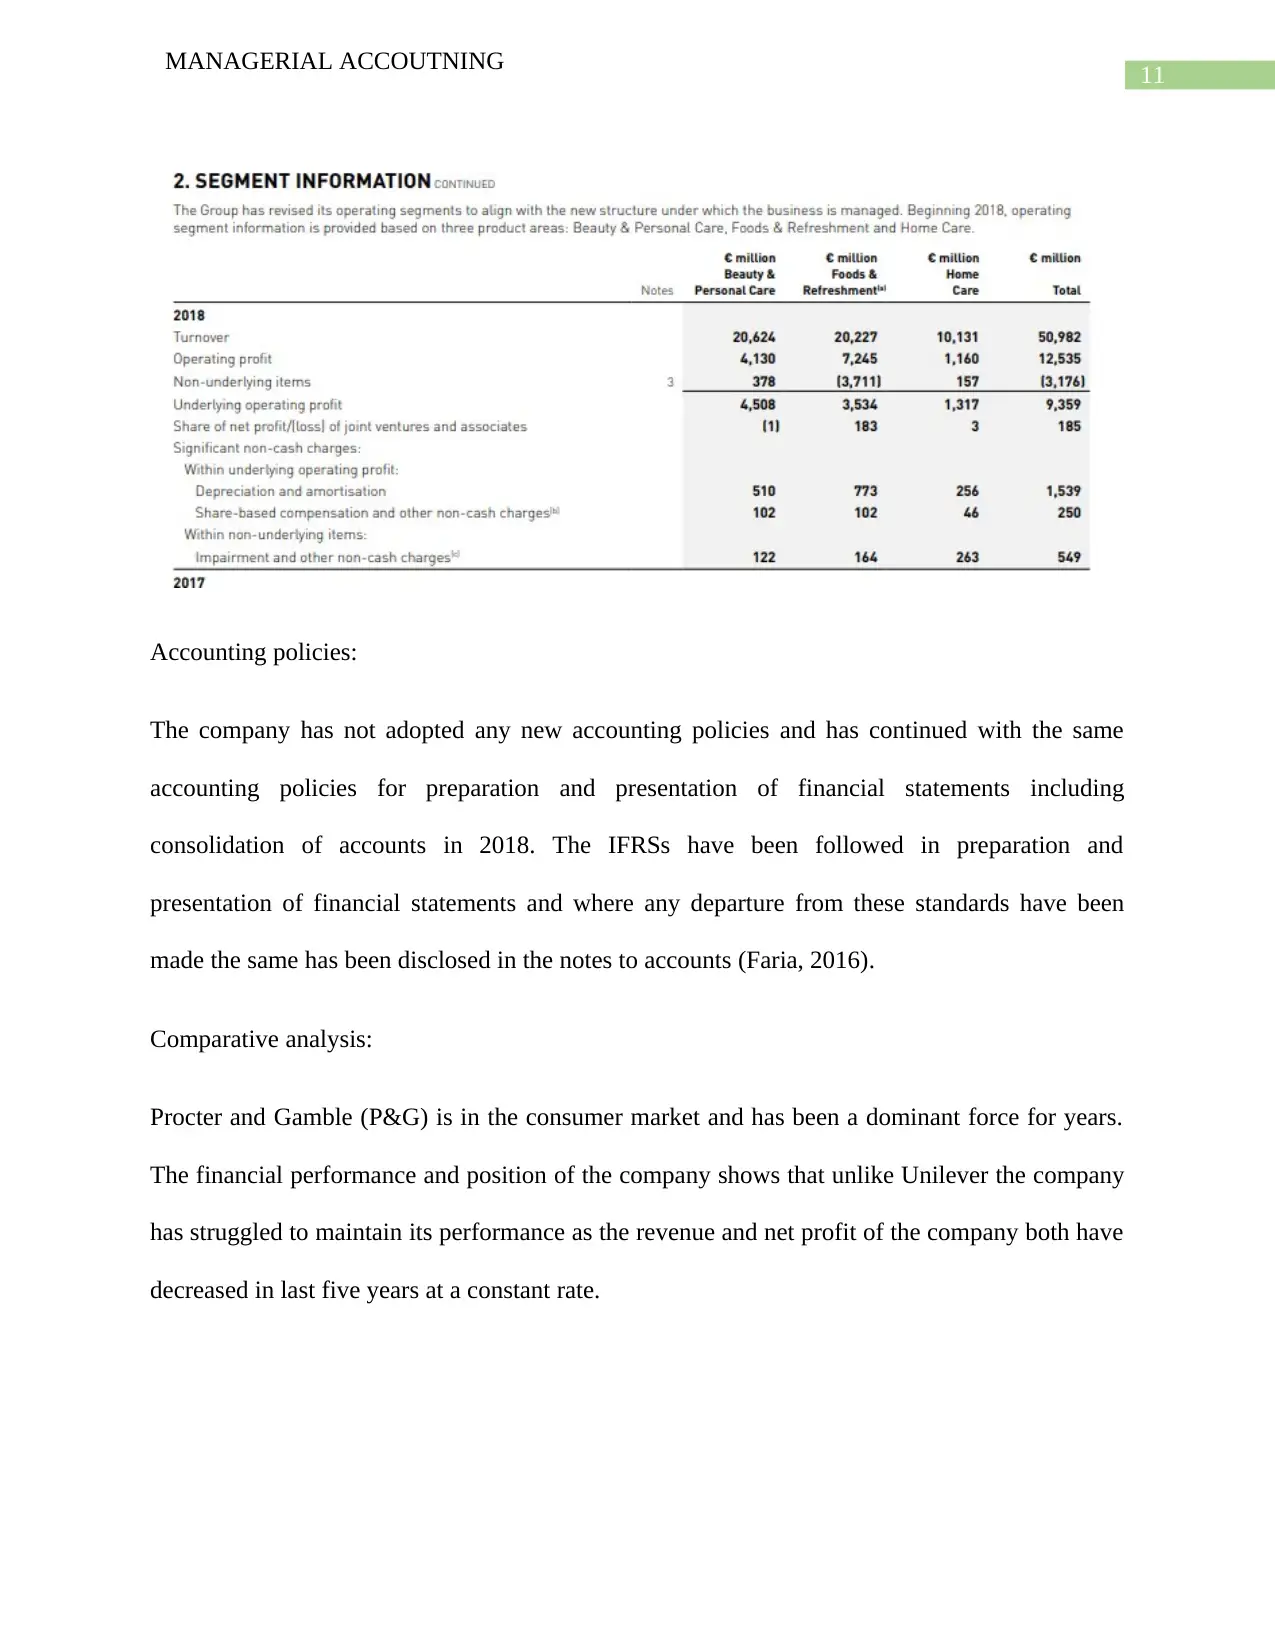
This case study provides a detailed financial analysis of Unilever, a multinational consumer goods company. The analysis examines Unilever's financial performance using the value reporting framework developed by PricewaterhouseCoopers (PWC), including market overview, strategy, value creation, and financial performance. The study reviews key financial statements, including balance sheets and income statements, from 2014 to 2018, and calculates crucial financial ratios such as current ratio, quick ratio, and debt-to-equity ratio to assess the company's liquidity, solvency, and overall financial health. A comparative analysis is also performed with Procter & Gamble (P&G) to benchmark Unilever's performance within the consumer goods market. The study also includes profitability ratios and segment analysis, offering a comprehensive view of Unilever's financial standing and strategic decisions, providing insights into its market position and future growth prospects. The study concludes with an assessment of the company's risk profile and economic performance, highlighting key trends and potential challenges.

Running head: MANAGERIAL ACCOUTNING
Managerial Accounting
Name of the Student:
Name of the University:
Authors Note:
Managerial Accounting
Name of the Student:
Name of the University:
Authors Note:
Paraphrase This Document
Need a fresh take? Get an instant paraphrase of this document with our AI Paraphraser

1
MANAGERIAL ACCOUTNING

2
MANAGERIAL ACCOUTNING
Contents
Introduction:....................................................................................................................................2
Task 2:.............................................................................................................................................2
Task 3:...........................................................................................................................................10
Conclusion:....................................................................................................................................11
References:....................................................................................................................................13
⊘ This is a preview!⊘
Do you want full access?
Subscribe today to unlock all pages.

Trusted by 1+ million students worldwide

3
MANAGERIAL ACCOUTNING
Introduction:
In order to evaluate the performance and financial state of a company it is important to conduct a
thorough and detailed analysis of the financial statements of the company. In this document an
honest effort is made to assess the financial performance and position of Unilever. Unilever is a
British-Dutch consumer goods company having twin headquarters in London and Rotterdam.
The company provides food, beverages, cleanings agents, beauty and personal care products to
the consumers. The company is truly a multinational company with its products available in
more than 190 countries across the globe. A detailed discussion on its financial performance is
provided in this document.
Task 2:
In order to properly measure and manage performance of corporate houses Pricewaterhouse
Coopers (PWC) has developed value reporting framework. The value reporting framework of
PWC is mainly segregated into market overview, strategy, value creation and financial
performance. The diagram below shall further detailed the 17 important elements of which are to
be considered for measuring and managing corporate performance.
Paraphrase This Document
Need a fresh take? Get an instant paraphrase of this document with our AI Paraphraser

4
MANAGERIAL ACCOUTNING
Using the above measures the corporate performance of Unilever is explained here in brief.
Competitive environment:
The company at present has its operations spread to more than 190 countries across the globe.
The company is one of the biggest consumer goods producer and seller in the world with its sales
touching 53.7 billion euros in 2017.
Regulatory environment:
It operates in more than 190 countries and since it is in the consumer gods market it has to oblige
with the relevant regulatory requirements of respective countries where it has its operations.
Generally the Food and Drug Control Acts in different countries have to be complied with by the
company to maintain quality of its products (Camodeca and Almici, 2017).
Macro-economic environment:
As the company operates in different parts of the globe with substantial market share in different
countries the macroeconomic environment such as general state of the economy, growth in GDP,

5
MANAGERIAL ACCOUTNING
unemployment rates all these effects the company and its market. For example the company has
a significant market share in India. The huge market in India provides the company an
opportunity to maintain its sustainable growth by catering to the needs of the huge population in
that country (Tabor, 2014).
Goals and objectives:
The goals and objectives as mentioned in the annual report of the company is mainly to provide
quality food, beverage, beauty, personal care and other products to the customers and maintain
sustainable growth in the future. The company currently owns 400 brands and the goal is to
innovate new and better products to satisfy the ever changing customer preferences.
Organizational design:
The company has a standard organizational structure with Chairman presiding over and above
all. The Board of the company has 12 directors in total including both executive and non-
executive directors. Marijn Dekker is the current Chairman of the company with Alan Jope and
Graeme Pitkethly holding the position of CEO and CFO of the company.
Governance:
The responsibility of governing and managing the affairs of the company is solely on the Board
of directors of the company. Over the years the Board of directors have done a tremendous job to
take the company into new heights. At present the company has at-least 13 brands with sales in
excess of 1 billion euro each in every year. The exceptional governance by the management of
the company is mainly responsible for such feet of the company.
⊘ This is a preview!⊘
Do you want full access?
Subscribe today to unlock all pages.

Trusted by 1+ million students worldwide

6
MANAGERIAL ACCOUTNING
Customers:
With its operations spreading into more than 190 countries in the world, the company has
millions of loyal customers. The goals of the company include providing quality products to the
customers at reasonable price.
People:
The employees, workers, vendors, managerial personnel the company and its success is very
much due to the people. Proper compensation to these people and providing them with suitable
working environment has always been the top priority for the company.
Innovation:
The company has a standard policy to invest significant amount of its revenue on research and
development activities to develop new and better products for the customers. This is the reason
that the company owns more than 400 brands at present (Martinez, 2016).
Brands:
As mentioned earlier currently the company owns more than 400 brands in food, beverages,
beauty care, personal care, cleaning agents and other consumer products. Out of these a
staggering 13 brans have sales in excess of 1 billion euro in each year.
Supply chain:
The company has one of the largest supply chain which helps the company to distribute its
products to different corners of the globe.
Environmental, social and ethical:
Paraphrase This Document
Need a fresh take? Get an instant paraphrase of this document with our AI Paraphraser

7
MANAGERIAL ACCOUTNING
The sustainability report of the company shows that the company has taken number of steps to
reduce its energy consumption and reducing pollution from its manufacturing activities.
Financial position:
In order to assess the financial position of the company a closer look shall be given to the
financial statement of the company.

8
MANAGERIAL ACCOUTNING
EUR millions 2014-12 2015-12 2016-12 2017-12 2018-12
Assets
Cash and cash equivalents 1,611.00 1,647.00 1,869.00 1,984.00 3,230.00
Short-term investments 671.00 337.00 300.00 377.00 680.00
Receivables 2,827.00 2,917.00 3,329.00 3,439.00 4,350.00
Inventories 4,168.00 4,335.00 4,278.00 3,962.00 4,301.00
Prepaid expenses 540.00 655.00 1,513.00 1,333.00
Other current assets 2,530.00 2,795.00 2,595.00 5,888.00 2,920.00
Total current assets 12,347.00 12,686.00 13,884.00 16,983.00 15,481.00
Non-current assets
Property, plant and equipment
Gross property, plant and equipment 18,914.00 19,917.00 21,207.00 19,398.00 19,924.00
Accumulated Depreciation (8,442.00) (8,859.00) (9,534.00) (8,987.00) (9,577.00)
Net property, plant and equipment 10,472.00 11,058.00 11,673.00 10,411.00 10,347.00
Goodwill 14,642.00 16,213.00 17,624.00 16,881.00 17,341.00
Intangible assets 7,532.00 8,846.00 9,809.00 11,520.00 12,152.00
Deferred income taxes 1,286.00 1,185.00 1,354.00 1,085.00 1,117.00
Prepaid pension benefit 376.00 934.00 694.00 2,173.00 1,728.00
Other long-term assets 1,372.00 1,376.00 1,391.00 1,232.00 1,290.00
Total non-current assets 35,680.00 39,612.00 42,545.00 43,302.00 43,975.00
Total assets 48,027.00 52,298.00 56,429.00 60,285.00 59,456.00
Liabilities and stockholders' equity
Current liabilities
Short-term debt 5,016.00 4,345.00 5,266.00 7,694.00 2,947.00
Capital leases 13.00 37.00 9.00 11.00 13.00
Accounts payable 7,636.00 8,296.00 8,591.00 8,217.00 9,121.00
Taxes payable 1,636.00 1,686.00 1,312.00 1,627.00 1,943.00
Other current liabilities 5,341.00 5,655.00 5,378.00 5,628.00 5,748.00
Total current liabilities 19,642.00 20,019.00 20,556.00 23,177.00 19,772.00
Non-current liabilities
Long-term debt 6,671.00 9,422.00 10,933.00 16,007.00 21,258.00
Capital leases 186.00 158.00 134.00 120.00 115.00
Deferred taxes liabilities 1,534.00 1,744.00 2,061.00 1,913.00 1,923.00
Accrued liabilities 109.00 120.00 159.00 146.00 121.00
Pensions and other benefits 3,947.00 3,254.00 3,867.00 2,734.00 2,602.00
Minority interest 612.00 643.00 626.00 758.00 720.00
Other long-term liabilities 1,675.00 1,499.00 1,738.00 1,801.00 1,373.00
Total non-current liabilities 14,734.00 16,840.00 19,518.00 23,479.00 28,112.00
Total liabilities 34,376.00 36,859.00 40,074.00 46,656.00 47,884.00
Stockholders' equity
Common stock 484.00 484.00 484.00 484.00 464.00
Additional paid-in capital 145.00 152.00 134.00 130.00 129.00
Retained earnings 20,560.00 22,619.00 23,180.00 26,648.00 26,265.00
Accumulated other comprehensive income (7,538.00) (7,816.00) (7,443.00) (13,633.00) (15,286.00)
Total stockholders' equity 13,651.00 15,439.00 16,355.00 13,629.00 11,572.00
Total liabilities and stockholders' equity 48,027.00 52,298.00 56,429.00 60,285.00 59,456.00
UNILEVER PLC BALANCE SHEET
⊘ This is a preview!⊘
Do you want full access?
Subscribe today to unlock all pages.

Trusted by 1+ million students worldwide

9
MANAGERIAL ACCOUTNING
Liquidity/Financial Health 2014-12 2015-12 2016-12 2017-12 2018-12
Current Ratio 0.63 0.63 0.68 0.73 0.78
Quick Ratio 0.37 0.35 0.36 0.34 0.53
Financial Leverage 3.52 3.39 3.45 4.42 5.14
Debt/Equity 0.5 0.62 0.68 1.18 1.84
The improvement in current ratio, quick ratio indicates the improved ability of the company to
repay its current liabilities using current and liquid assets. However, debt to equity ratio indicates
that the company’s debt has risen sharply over the years, a not very positive sign for the long
term solvency of the company (Ivan, 2018).
Risk profile:
The company operates in a consumer goods market thus, needs to continuously monitor the
quality of its products especially the food, beverages and beauty care products. The risk profile
of the company is quite high.
Economic performance:
The profit and loss statement of the company over the last few years indicate that the company’s
overall revenue and profit have declined a bit.
Paraphrase This Document
Need a fresh take? Get an instant paraphrase of this document with our AI Paraphraser

10
MANAGERIAL ACCOUTNING
Euro Millions 2014-12 2015-12 2016-12 2017-12 2018-12
Revenue 48,436.00 53,272.00 52,713.00 53,715.00 50,982.00
Cost of revenue 28,387.00 30,808.00 30,229.00 30,547.00 28,769.00
Gross profit 20,049.00 22,464.00 22,484.00 23,168.00 22,213.00
Operating expenses
Research and development 955.00 1,005.00 978.00 900.00 900.00
Sales, General and administrative 11,114.00 13,944.00 13,705.00 13,411.00 8,778.00
Other operating expenses 94.00 121.00 94.00 96.00 25.00
Total operating expenses 12,163.00 15,070.00 14,777.00 14,407.00 9,703.00
Operating income 7,886.00 7,394.00 7,707.00 8,761.00 12,510.00
Interest Expense 482.00 548.00 568.00 565.00 604.00
Other income (expense) 242.00 374.00 330.00 (43.00) 477.00
Income before taxes 7,646.00 7,220.00 7,469.00 8,153.00 12,383.00
Provision for income taxes 2,131.00 1,961.00 1,922.00 1,667.00 2,575.00
Net income from continuing operations 5,515.00 5,259.00 5,547.00 6,486.00 9,808.00
Other (344.00) (350.00) (363.00) (433.00) (419.00)
Net income 5,171.00 4,909.00 5,184.00 6,053.00 9,389.00
Net income available to common shareholders 5,171.00 4,909.00 5,184.00 6,053.00 9,389.00
Earnings per share
Basic 1.82 1.73 1.83 2.16 3.50
Diluted 1.79 1.72 1.82 2.15 3.48
UNILEVER PLC INCOME STATEMENT
As can be seen from the income statement of the company that the performance of the company
has fluctuated in recent years. However, though the gross revenue has fluctuated a bit in recent
years but the net income has maintained a stable growth indicating strong financial performance
of the company (Iatridis, 2010).
Segment analysis:
The group has provided segment reports on the basis of its products as per International
Financial Reporting Standards (IFRS). The following extract has been taken for the annual report
of the company shows the information in relation to operating segments of the company.

11
MANAGERIAL ACCOUTNING
Accounting policies:
The company has not adopted any new accounting policies and has continued with the same
accounting policies for preparation and presentation of financial statements including
consolidation of accounts in 2018. The IFRSs have been followed in preparation and
presentation of financial statements and where any departure from these standards have been
made the same has been disclosed in the notes to accounts (Faria, 2016).
Comparative analysis:
Procter and Gamble (P&G) is in the consumer market and has been a dominant force for years.
The financial performance and position of the company shows that unlike Unilever the company
has struggled to maintain its performance as the revenue and net profit of the company both have
decreased in last five years at a constant rate.
⊘ This is a preview!⊘
Do you want full access?
Subscribe today to unlock all pages.

Trusted by 1+ million students worldwide
1 out of 16
Related Documents
Your All-in-One AI-Powered Toolkit for Academic Success.
 +13062052269
info@desklib.com
Available 24*7 on WhatsApp / Email
Unlock your academic potential
Copyright © 2020–2026 A2Z Services. All Rights Reserved. Developed and managed by ZUCOL.


