Financial Analysis: Valuation Method and Investment Decision Report

Verified

Added on  2021/06/15

|21
|3623
|80
Report
AI Summary
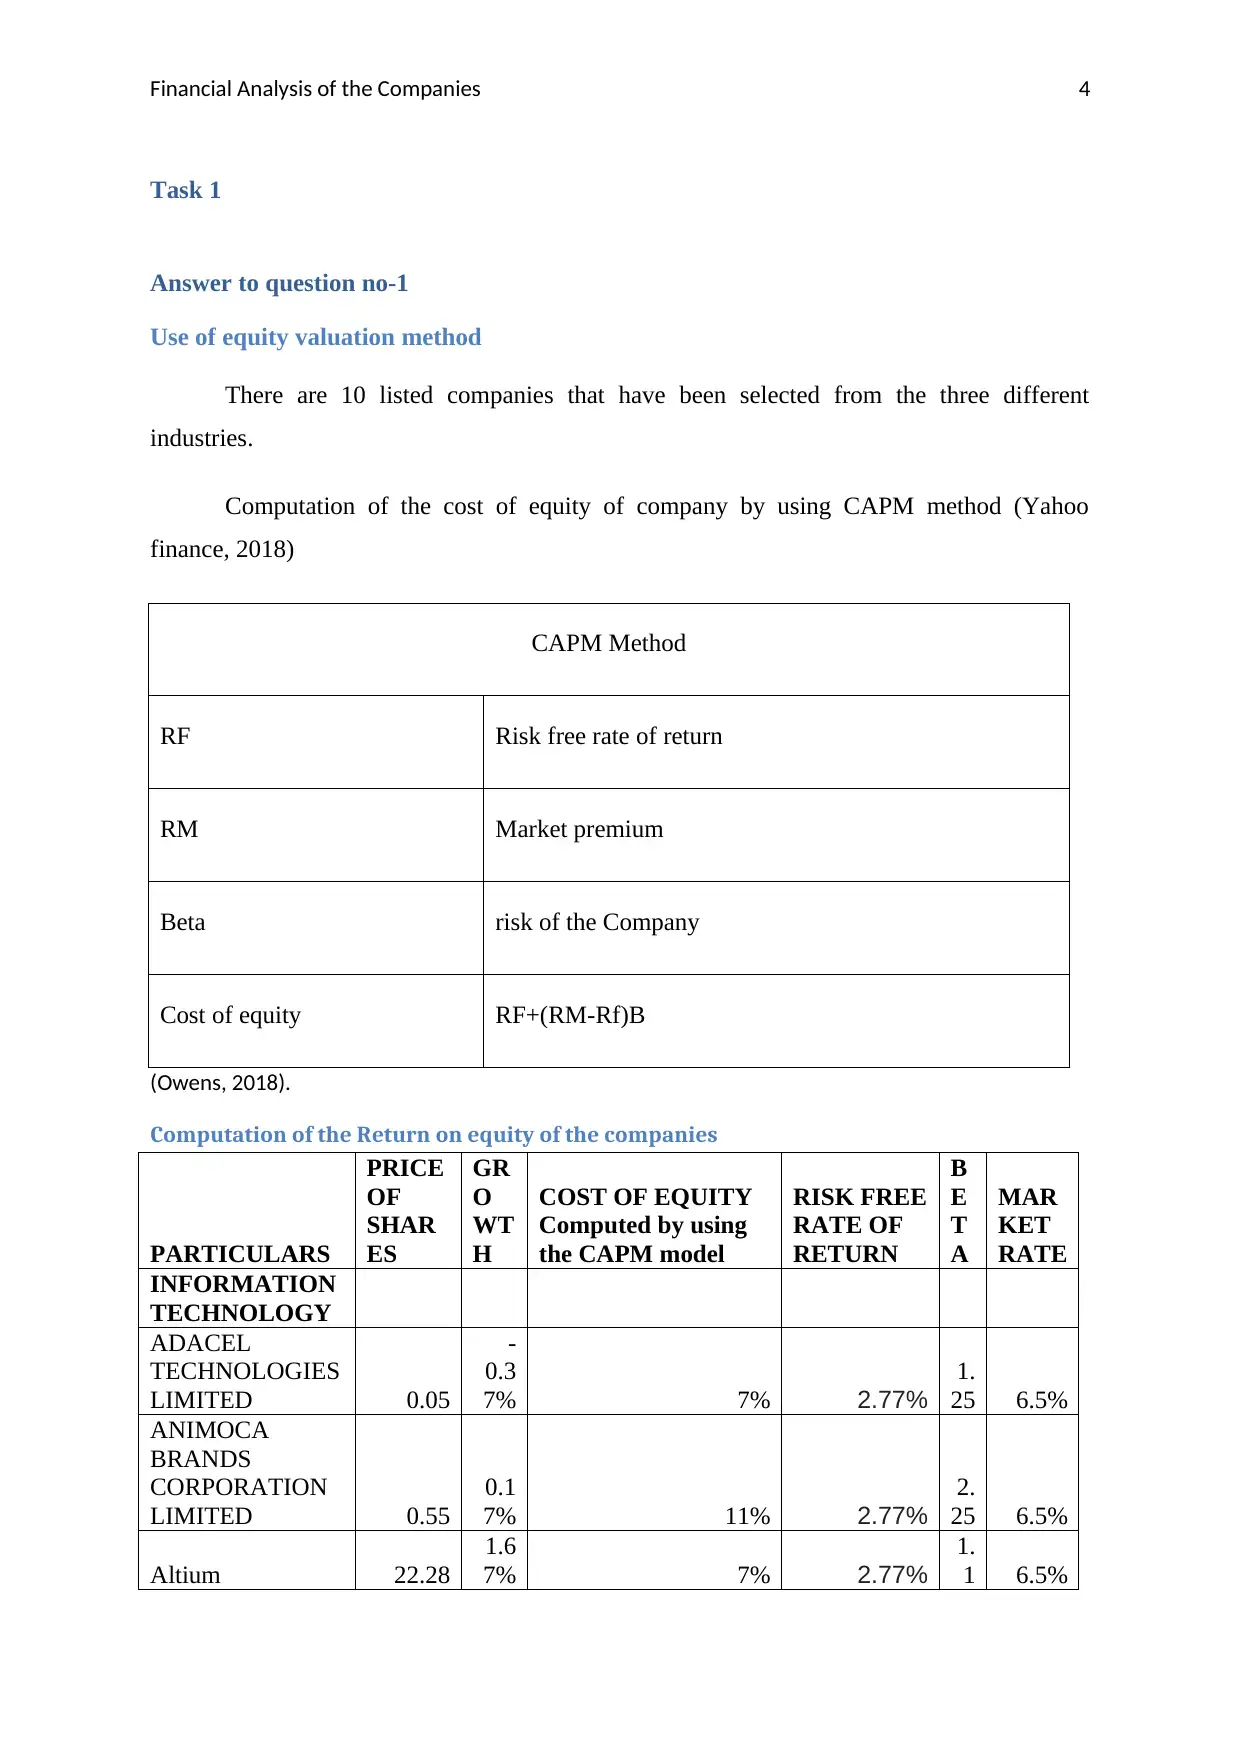
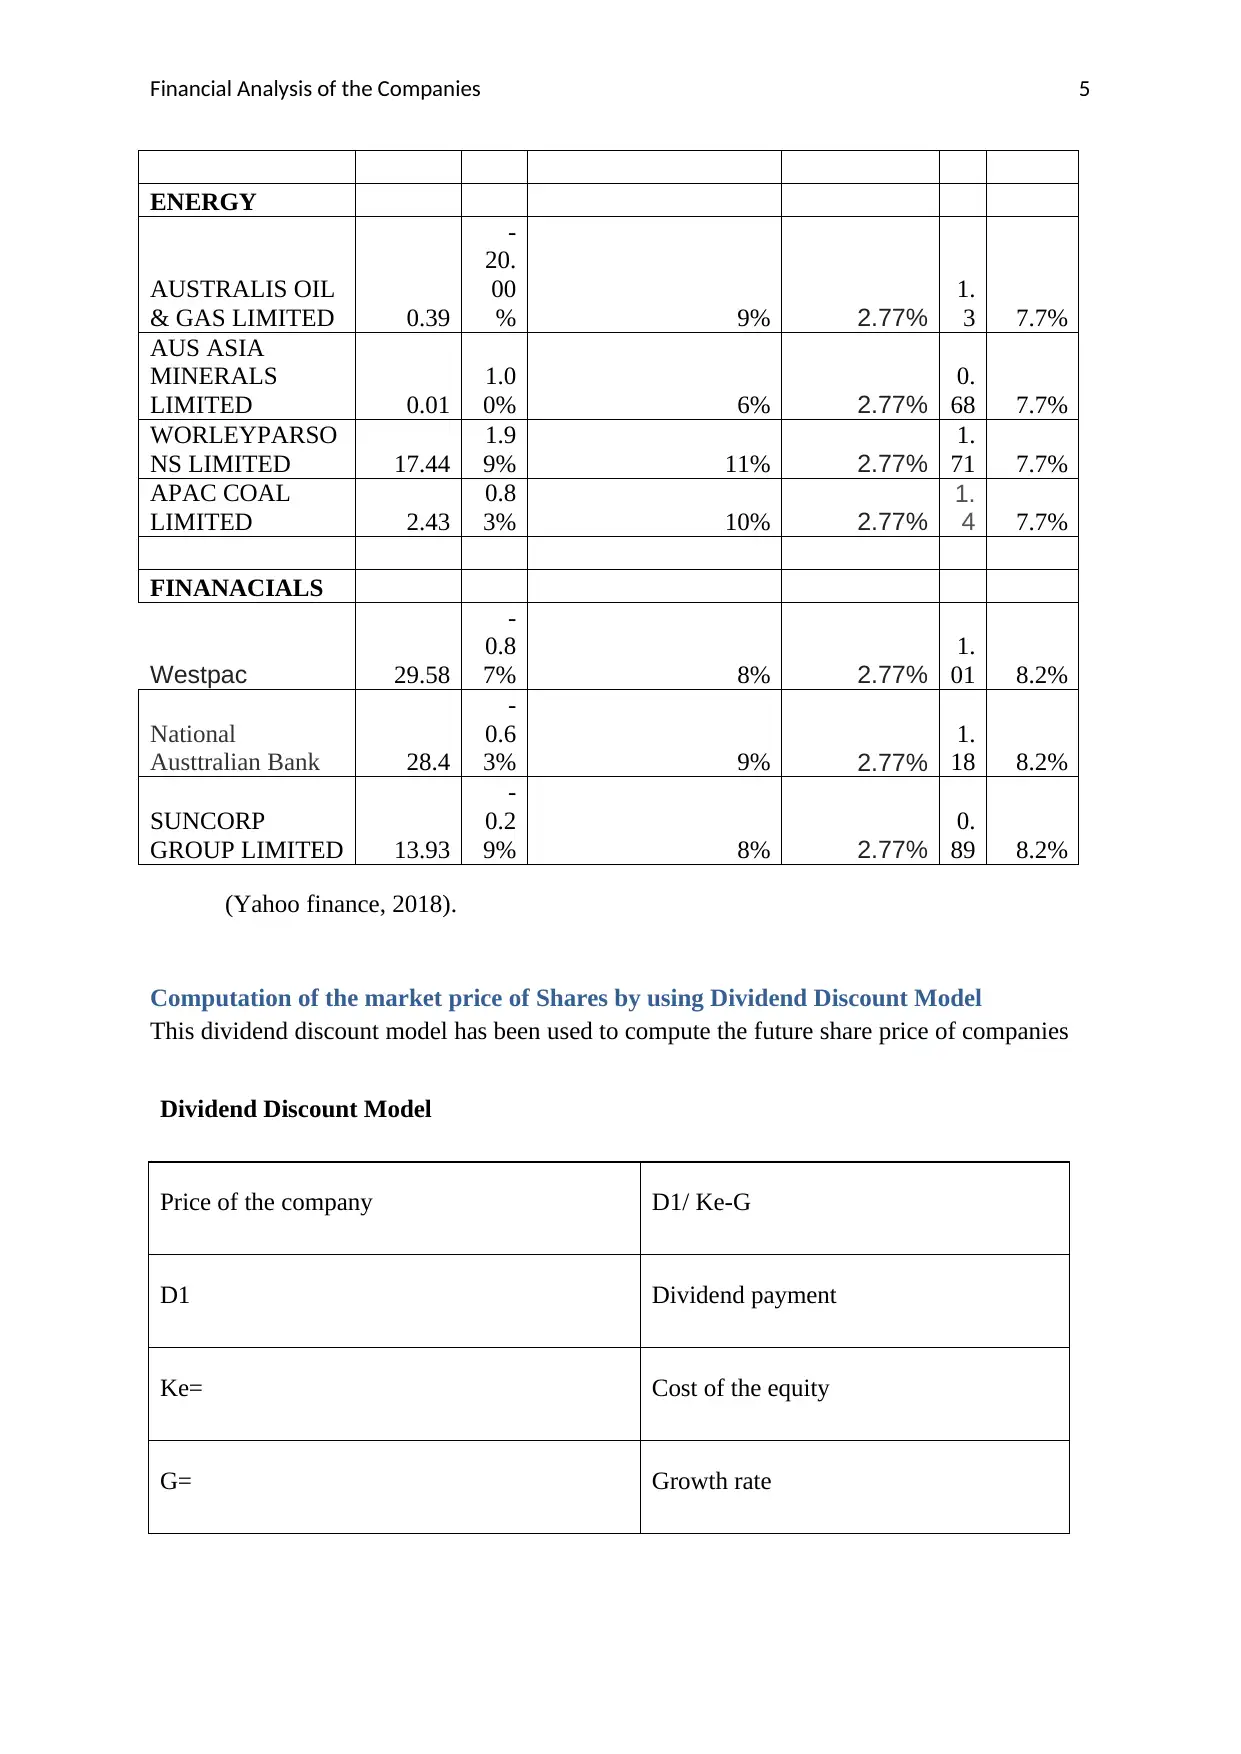
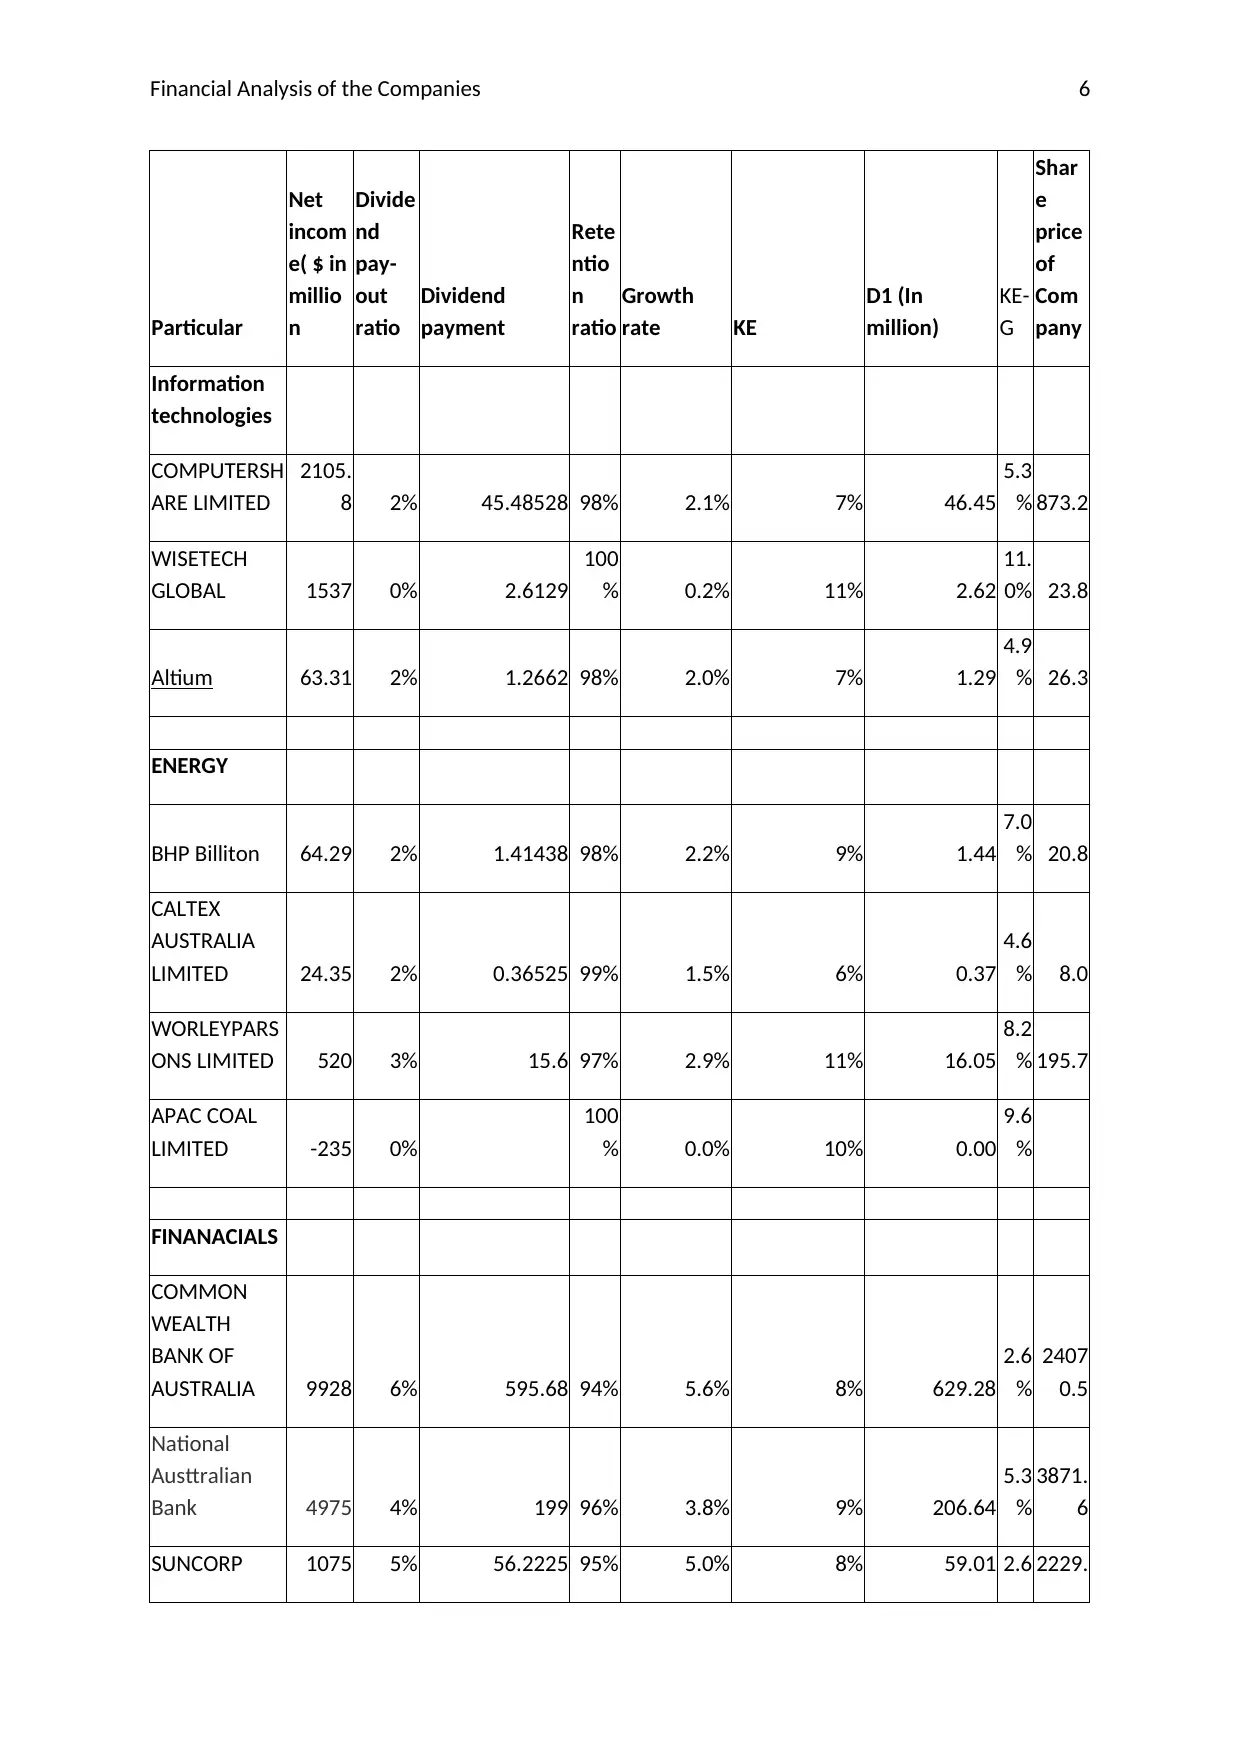
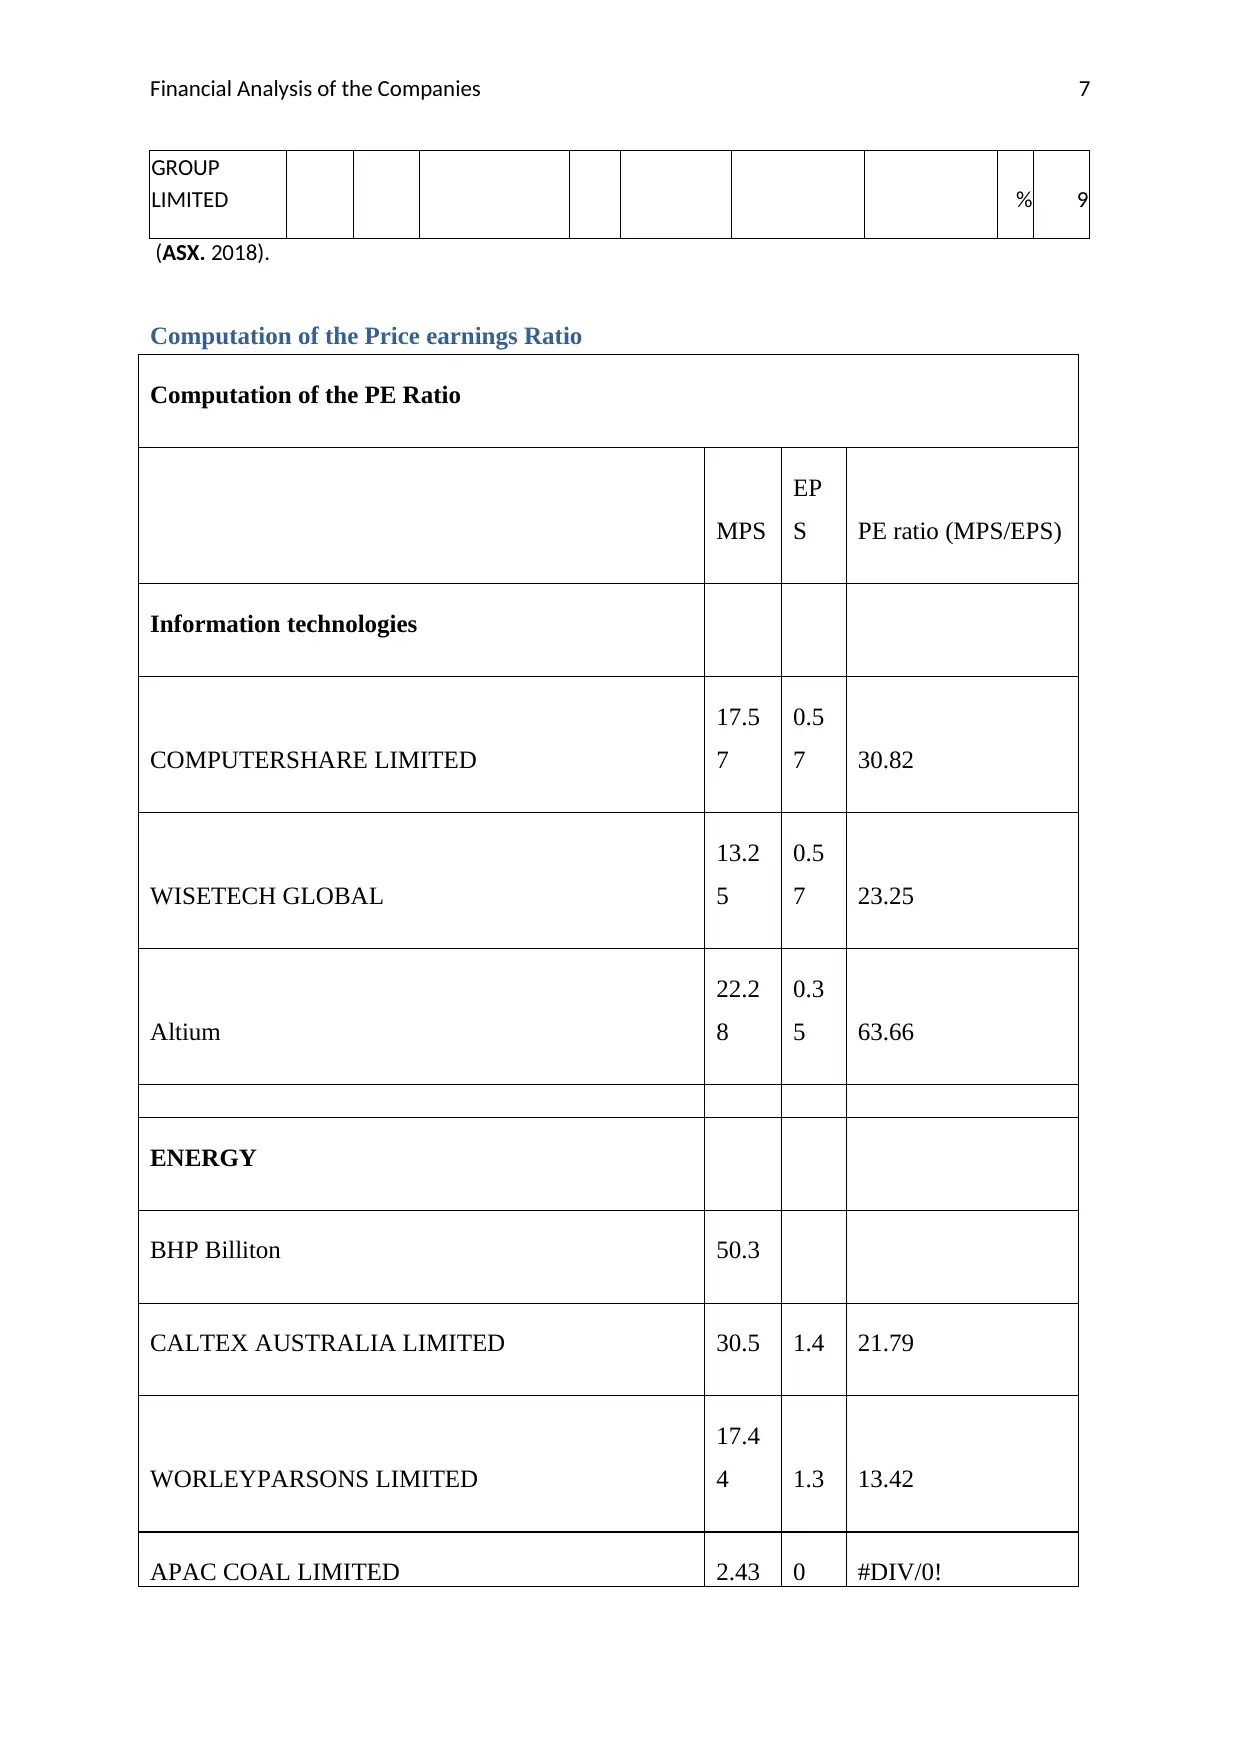
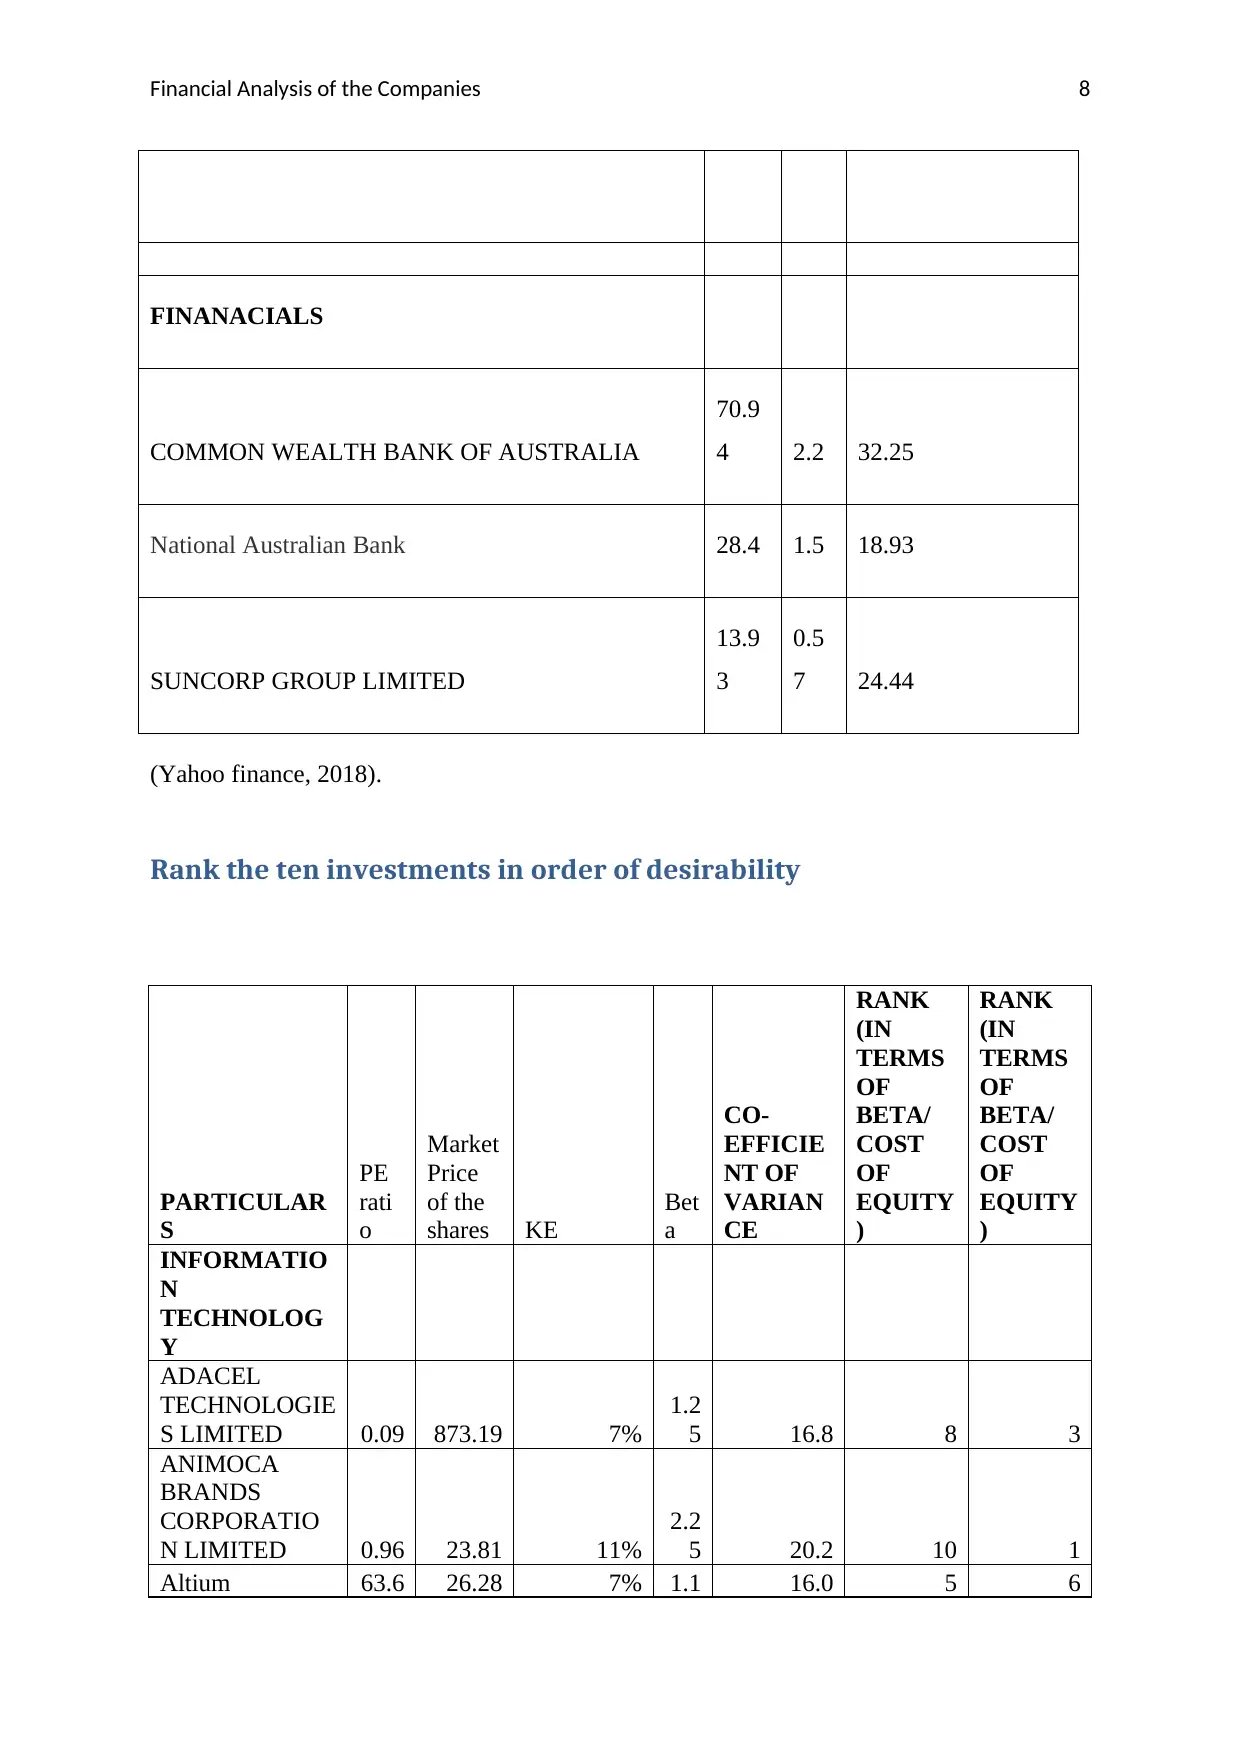
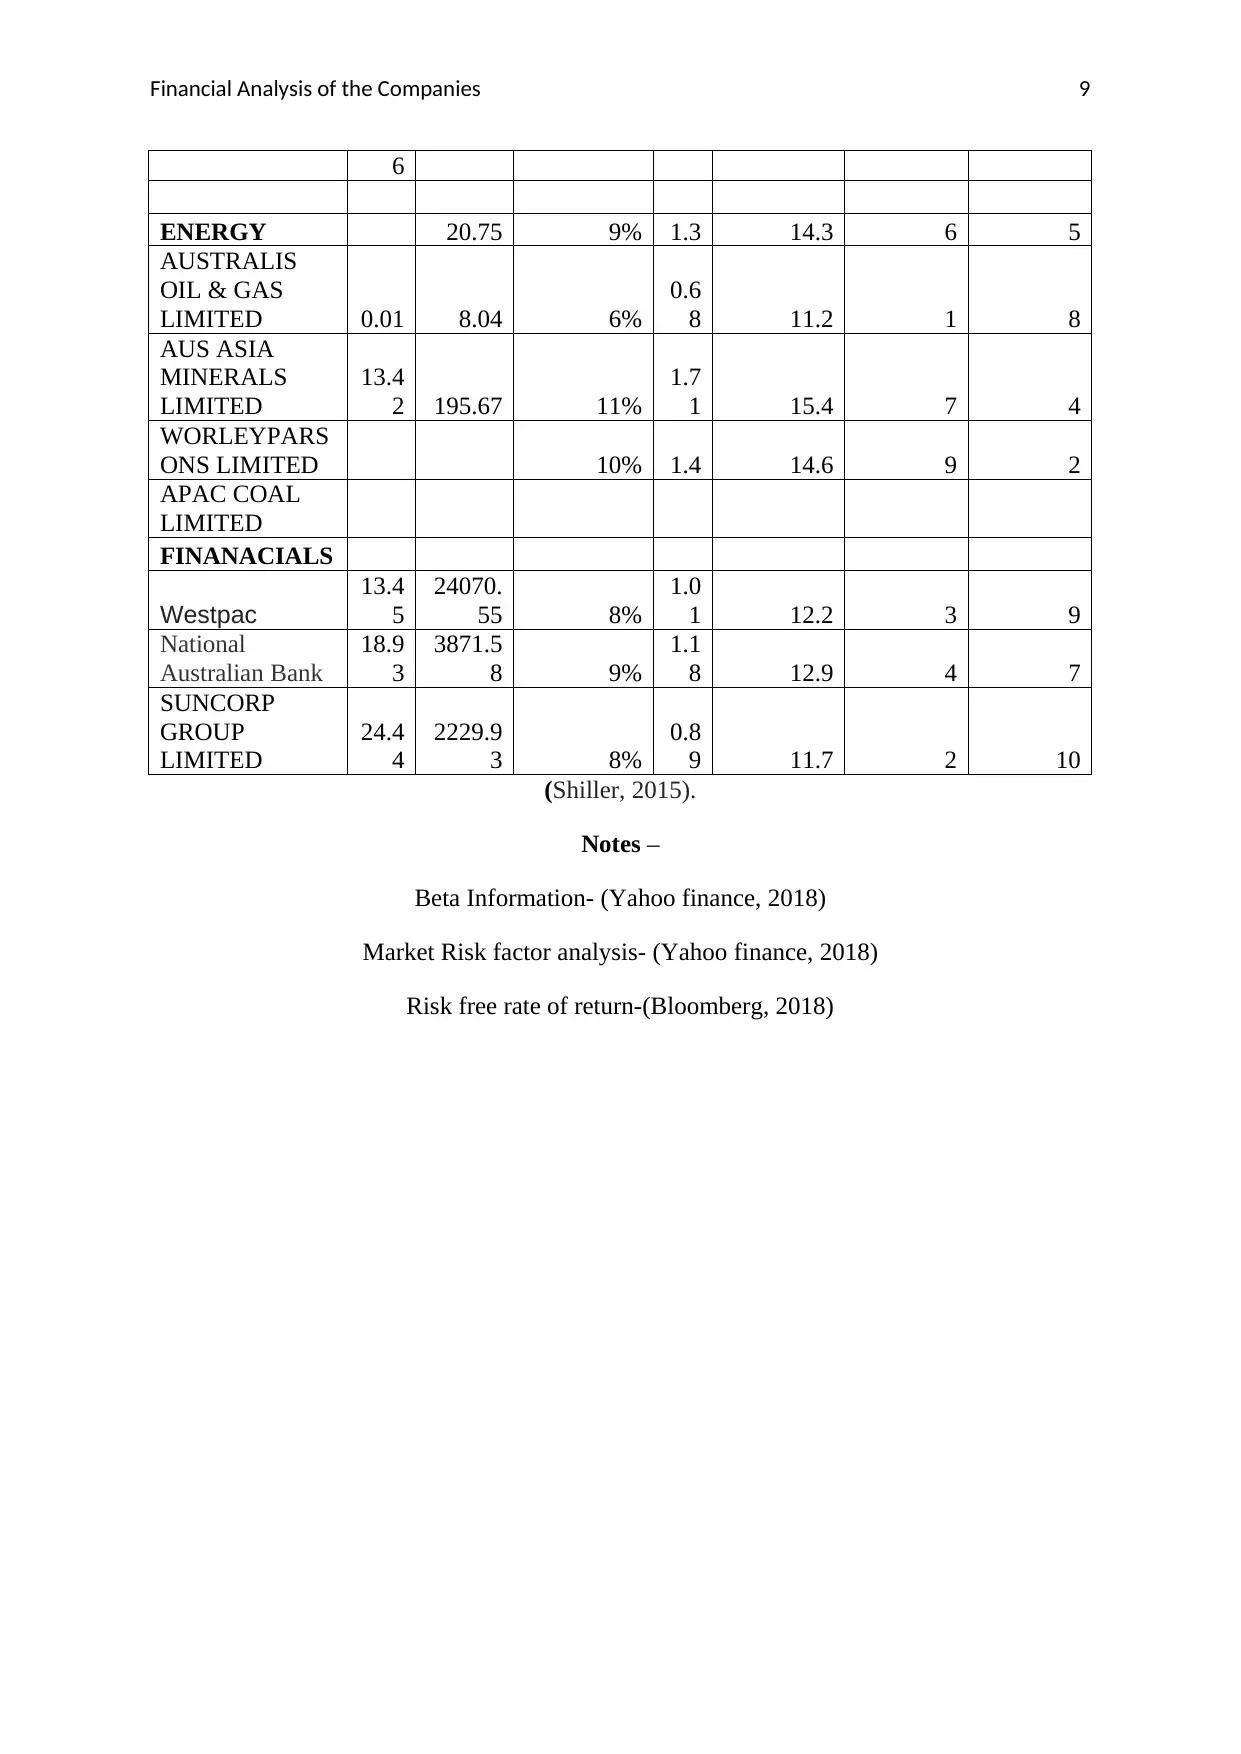
This report presents a financial analysis of ten companies across three sectors, evaluating their performance using methods like CAPM, dividend discount model, and price-earnings ratio. The analysis includes the computation of the cost of equity, return on equity, and market prices of shares. The report ranks the investments based on desirability, considering factors like beta and cost of equity, and provides a rationale for the selection of a specific investment option. Furthermore, it explores Warren Buffet's approach to share valuation, summarizing his investment strategies and comparing his methods with the valuation methodologies used in the report. The report concludes with a comparison of Warren Buffet's approach and the share valuation methodology, highlighting key factors such as profitability, financial leverage, and the nature of the organization. The report uses both relative valuation and intrinsic valuation methods to provide a comprehensive financial assessment.
Document Page
Running Head: Valuation method and investment decision
0
Valuation method and investment decision
tabler-icon-diamond-filled.svg

Paraphrase This Document

Need a fresh take? Get an instant paraphrase of this document with our AI Paraphraser
Document Page
Financial Analysis of the Companies 1
Executive Summary
With the increasing number of the companies in the market, investors have to analysis
financial performance risk factor and return offered by the companies to investors. Investor
needs to use different valuation methods such as ratio analysis, share price analysis, and
dividend discount model to value the shares of the companies. It is observed that Dividend
discount model and Price earnings are the main methods which are used by the investors to
determine the future sustainability and share price of company.
Document Page
Financial Analysis of the Companies 2
Table of Contents
Executive Summary...............................................................................................................................1
Introduction...........................................................................................................................................3
Task 1....................................................................................................................................................4
Answer to question no-1........................................................................................................................4
Use of equity valuation method.........................................................................................................4
Computation of the Return on equity of the companies...............................................................4
Computation of the market price of Shares by using Dividend Discount Model...................................5
Computation of the Price earnings Ratio...............................................................................................7
Rank the ten investments in order of desirability..................................................................................8
Which investment of the ten would you select................................................................................10
Why the investment option selected................................................................................................10
Task-2..................................................................................................................................................10
Research and summaries some interesting facts about Warren Buffet.................................................10
Task 3..................................................................................................................................................13
Compare Warren Buffet’s approach to share valuation and the share valuation methodology............13
Share valuation Methodology..........................................................................................................14
Conclusion...........................................................................................................................................14
References...........................................................................................................................................15
Appendix.............................................................................................................................................19
Document Page
Financial Analysis of the Companies 3
Introduction
Investors are the persons who invest capital in business. It is observed that investment
decision for investing capital in particular stocks depends upon the several factors such as
risk associated, beta, Stock return and opportunities available in market. In this report, 10
companies have been selected from the three different business sectors to identify which
value of stocks will offer good return as compared to others. After that in the end, Warren
Buffet valuation method is used to compare the share value and offered return available on
the invested capital. In the end, comparison between the valuation methods and Warren
Buffet logical share valuation method has been used.
tabler-icon-diamond-filled.svg

Paraphrase This Document

Need a fresh take? Get an instant paraphrase of this document with our AI Paraphraser
Document Page
Financial Analysis of the Companies 4
Task 1
Answer to question no-1
Use of equity valuation method
There are 10 listed companies that have been selected from the three different
industries.
Computation of the cost of equity of company by using CAPM method (Yahoo
finance, 2018)
CAPM Method
RF Risk free rate of return
RM Market premium
Beta risk of the Company
Cost of equity RF+(RM-Rf)B
(Owens, 2018).
Computation of the Return on equity of the companies
PARTICULARS
PRICE
OF
SHAR
ES
GR
O
WT
H
COST OF EQUITY
Computed by using
the CAPM model
RISK FREE
RATE OF
RETURN
B
E
T
A
MAR
KET
RATE
INFORMATION
TECHNOLOGY
ADACEL
TECHNOLOGIES
LIMITED 0.05
-
0.3
7% 7% 2.77%
1.
25 6.5%
ANIMOCA
BRANDS
CORPORATION
LIMITED 0.55
0.1
7% 11% 2.77%
2.
25 6.5%
Altium 22.28
1.6
7% 7% 2.77%
1.
1 6.5%
Document Page
Financial Analysis of the Companies 5
ENERGY
AUSTRALIS OIL
& GAS LIMITED 0.39
-
20.
00
% 9% 2.77%
1.
3 7.7%
AUS ASIA
MINERALS
LIMITED 0.01
1.0
0% 6% 2.77%
0.
68 7.7%
WORLEYPARSO
NS LIMITED 17.44
1.9
9% 11% 2.77%
1.
71 7.7%
APAC COAL
LIMITED 2.43
0.8
3% 10% 2.77%
1.
4 7.7%
FINANACIALS
Westpac 29.58
-
0.8
7% 8% 2.77%
1.
01 8.2%
National
Austtralian Bank 28.4
-
0.6
3% 9% 2.77%
1.
18 8.2%
SUNCORP
GROUP LIMITED 13.93
-
0.2
9% 8% 2.77%
0.
89 8.2%
(Yahoo finance, 2018).
Computation of the market price of Shares by using Dividend Discount Model
This dividend discount model has been used to compute the future share price of companies
Dividend Discount Model
Price of the company D1/ Ke-G
D1 Dividend payment
Ke= Cost of the equity
G= Growth rate
Document Page
Financial Analysis of the Companies 6
Particular
Net
incom
e( $ in
millio
n
Divide
nd
pay-
out
ratio
Dividend
payment
Rete
ntio
n
ratio
Growth
rate KE
D1 (In
million)
KE-
G
Shar
e
price
of
Com
pany
Information
technologies
COMPUTERSH
ARE LIMITED
2105.
8 2% 45.48528 98% 2.1% 7% 46.45
5.3
% 873.2
WISETECH
GLOBAL 1537 0% 2.6129
100
% 0.2% 11% 2.62
11.
0% 23.8
Altium 63.31 2% 1.2662 98% 2.0% 7% 1.29
4.9
% 26.3
ENERGY
BHP Billiton 64.29 2% 1.41438 98% 2.2% 9% 1.44
7.0
% 20.8
CALTEX
AUSTRALIA
LIMITED 24.35 2% 0.36525 99% 1.5% 6% 0.37
4.6
% 8.0
WORLEYPARS
ONS LIMITED 520 3% 15.6 97% 2.9% 11% 16.05
8.2
% 195.7
APAC COAL
LIMITED -235 0%
100
% 0.0% 10% 0.00
9.6
%
FINANACIALS
COMMON
WEALTH
BANK OF
AUSTRALIA 9928 6% 595.68 94% 5.6% 8% 629.28
2.6
%
2407
0.5
National
Austtralian
Bank 4975 4% 199 96% 3.8% 9% 206.64
5.3
%
3871.
6
SUNCORP 1075 5% 56.2225 95% 5.0% 8% 59.01 2.6 2229.
tabler-icon-diamond-filled.svg

Paraphrase This Document

Need a fresh take? Get an instant paraphrase of this document with our AI Paraphraser
Document Page
Financial Analysis of the Companies 7
GROUP
LIMITED % 9
(ASX. 2018).
Computation of the Price earnings Ratio
Computation of the PE Ratio
MPS
EP
S PE ratio (MPS/EPS)
Information technologies
COMPUTERSHARE LIMITED
17.5
7
0.5
7 30.82
WISETECH GLOBAL
13.2
5
0.5
7 23.25
Altium
22.2
8
0.3
5 63.66
ENERGY
BHP Billiton 50.3
CALTEX AUSTRALIA LIMITED 30.5 1.4 21.79
WORLEYPARSONS LIMITED
17.4
4 1.3 13.42
APAC COAL LIMITED 2.43 0 #DIV/0!
Document Page
Financial Analysis of the Companies 8
FINANACIALS
COMMON WEALTH BANK OF AUSTRALIA
70.9
4 2.2 32.25
National Australian Bank 28.4 1.5 18.93
SUNCORP GROUP LIMITED
13.9
3
0.5
7 24.44
(Yahoo finance, 2018).
Rank the ten investments in order of desirability
PARTICULAR
S
PE
rati
o
Market
Price
of the
shares KE
Bet
a
CO-
EFFICIE
NT OF
VARIAN
CE
RANK
(IN
TERMS
OF
BETA/
COST
OF
EQUITY
)
RANK
(IN
TERMS
OF
BETA/
COST
OF
EQUITY
)
INFORMATIO
N
TECHNOLOG
Y
ADACEL
TECHNOLOGIE
S LIMITED 0.09 873.19 7%
1.2
5 16.8 8 3
ANIMOCA
BRANDS
CORPORATIO
N LIMITED 0.96 23.81 11%
2.2
5 20.2 10 1
Altium 63.6 26.28 7% 1.1 16.0 5 6
Document Page
Financial Analysis of the Companies 9
6
ENERGY 20.75 9% 1.3 14.3 6 5
AUSTRALIS
OIL & GAS
LIMITED 0.01 8.04 6%
0.6
8 11.2 1 8
AUS ASIA
MINERALS
LIMITED
13.4
2 195.67 11%
1.7
1 15.4 7 4
WORLEYPARS
ONS LIMITED 10% 1.4 14.6 9 2
APAC COAL
LIMITED
FINANACIALS
Westpac
13.4
5
24070.
55 8%
1.0
1 12.2 3 9
National
Australian Bank
18.9
3
3871.5
8 9%
1.1
8 12.9 4 7
SUNCORP
GROUP
LIMITED
24.4
4
2229.9
3 8%
0.8
9 11.7 2 10
(Shiller, 2015).
Notes
Beta Information- (Yahoo finance, 2018)
Market Risk factor analysis- (Yahoo finance, 2018)
Risk free rate of return-(Bloomberg, 2018)
tabler-icon-diamond-filled.svg

Paraphrase This Document

Need a fresh take? Get an instant paraphrase of this document with our AI Paraphraser
Document Page
Financial Analysis of the Companies 10
Which investment of the ten would you select
After evaluating risk, return, growth rate and dividend payment, it could be inferred that if
investors invest their capital In Australian Oil and Gas Company then they will have good
amount of return (Beatson, & Chen, 2018). This investment option will give higher return
and less risk (Please see the attached excel file (Shiller, 2015).
Why the investment option selected
There are several reasons of selecting this investment option such as risk, return and
future market price of Australian Oil and Gas Company. Furthermore, the cost of capital of
company is also very low i.e. 6% which shows positive outlook for the increased return on
capital employed (Diba, & Grossman, 2018).
Task-2
Research and summaries some interesting facts about Warren Buffet
It is considered that Warren Buffet is the biggest investors who endeavoured towards
investing capital in several stocks on the basis of several factors such as profitability, return
on capital employed, risk associated with the investment and market outlook. He before
investing capital in particular stocks analysis several factors which helps him to identify
whether the stock will give good amount of return on investment or not. He has been the
biggest investors and has been appointed as CEO of Bershire Hathway (Barbu, D’Amico, &
De Blasis, 2017).
He takes investment decisions on the basis of several factors such as profitability,
return on capital employed, and risk associated with the investment and market outlook
(Christofi, 2017).
Document Page
Financial Analysis of the Companies 11
There are several notes which Warren Buffet has considered before investing capital
in different companies (Shiller, & Beltratti, 2015).
In case of Information technology (Warren buffet)
INFORMATION TECHNOLOGY
ADACEL TECHNOLOGIES LIMITED
ANIMOCA BRANDS CORPORATION LIMITED
Altium
He analysis that the profitability of the Adacel Technologies Limited has been showing
average 12% net profit on sales since last five years. The share price of company is also
stable and growth rate is also reflecting the positive outlook for the investment purpose
(Campbell, & Shiller, 2018).
In case of Animoca Brands Corporation Limited, company has been showing the good
amount of increment in the share price which reflects that company has growth with the
drastic rate since last five years. Investors should invest their capital in long run (Rapach, &
Wohar, 2015).
In relation to Altium Company, Warren Buffet has shown that return on capital employed of
the company has increased due to its low amount of cost of capital. Investors will easily
create value if they will invest their capital in this company. 10 years (Timmermann, 2016).
chevron_up_icon
1 out of 21
circle_padding
hide_on_mobile
zoom_out_icon
[object Object]