Financial Analysis Report: Valuation and Investment Strategies

Verified

Added on  2021/06/15

|26
|4103
|34
Report
AI Summary
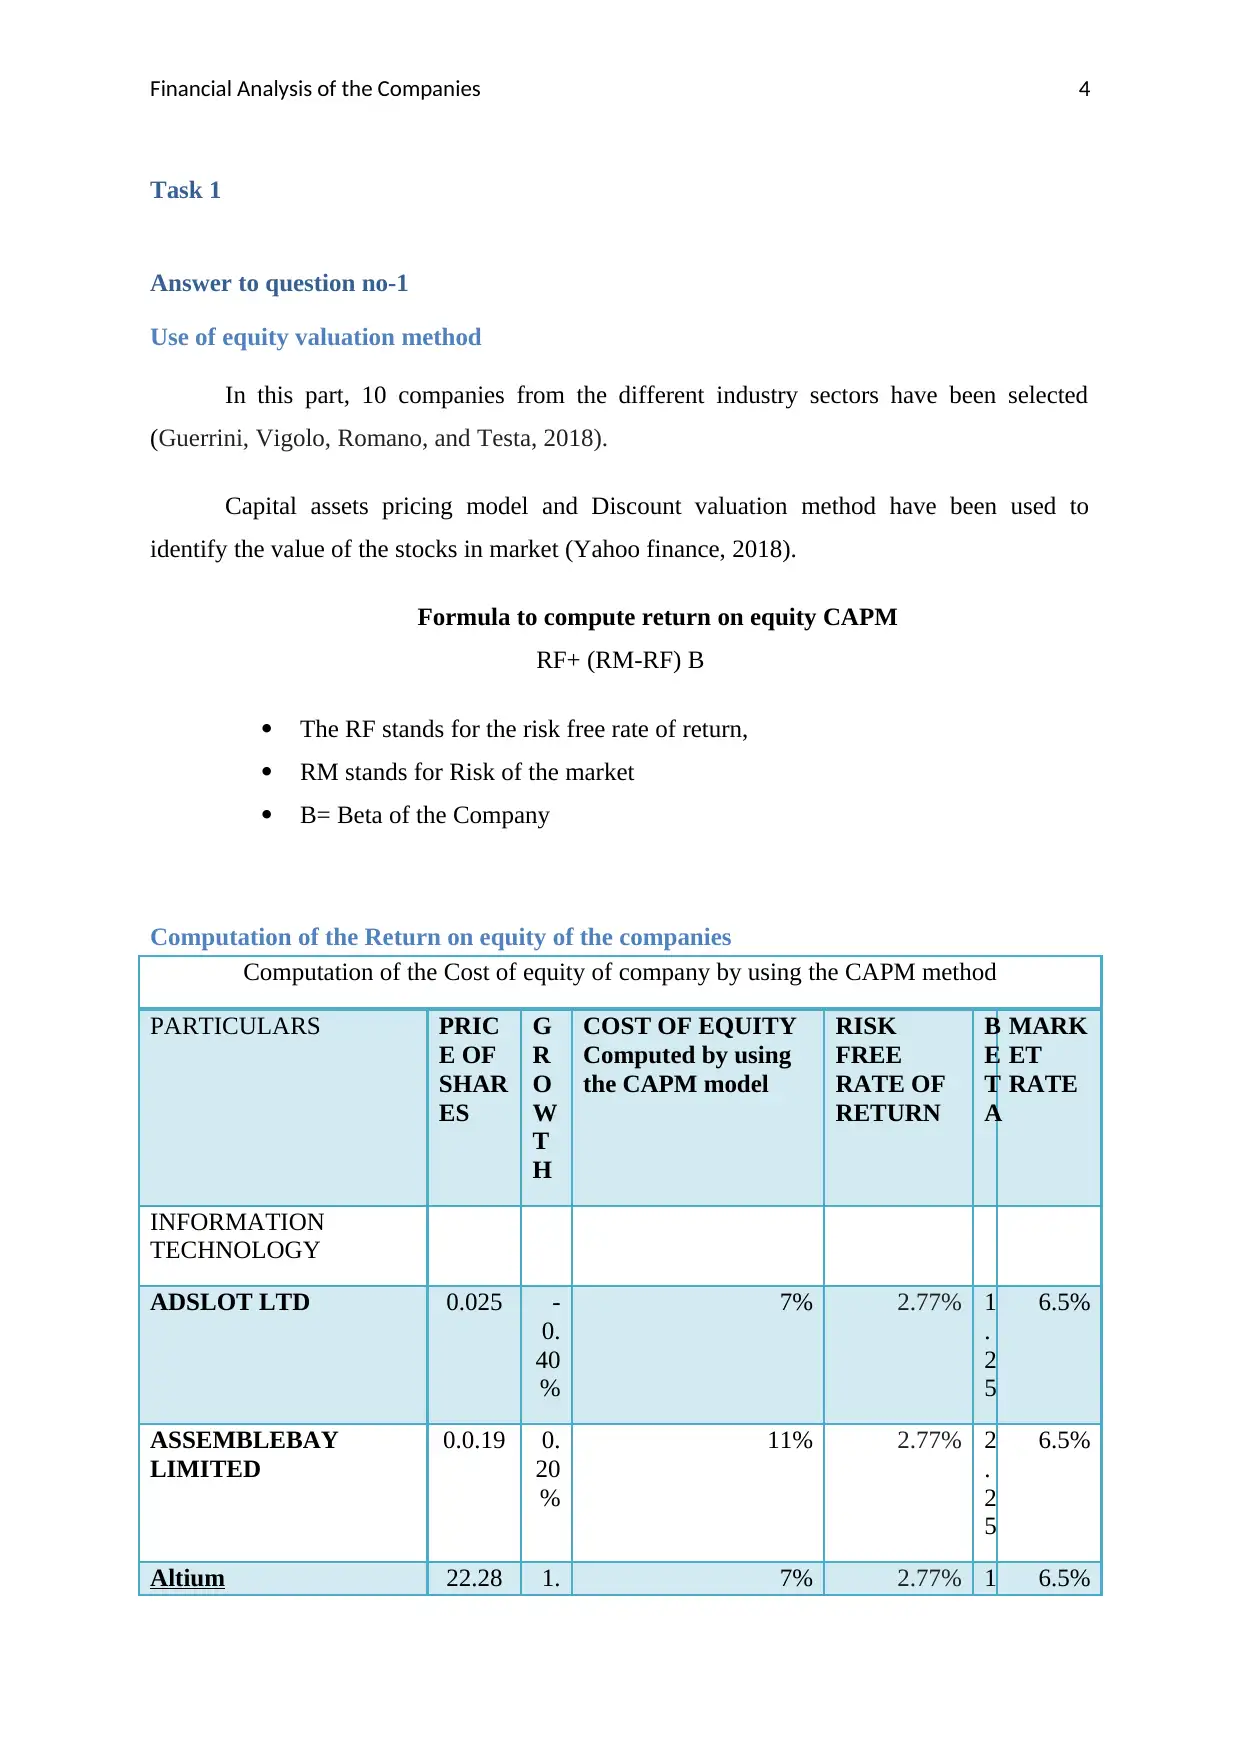
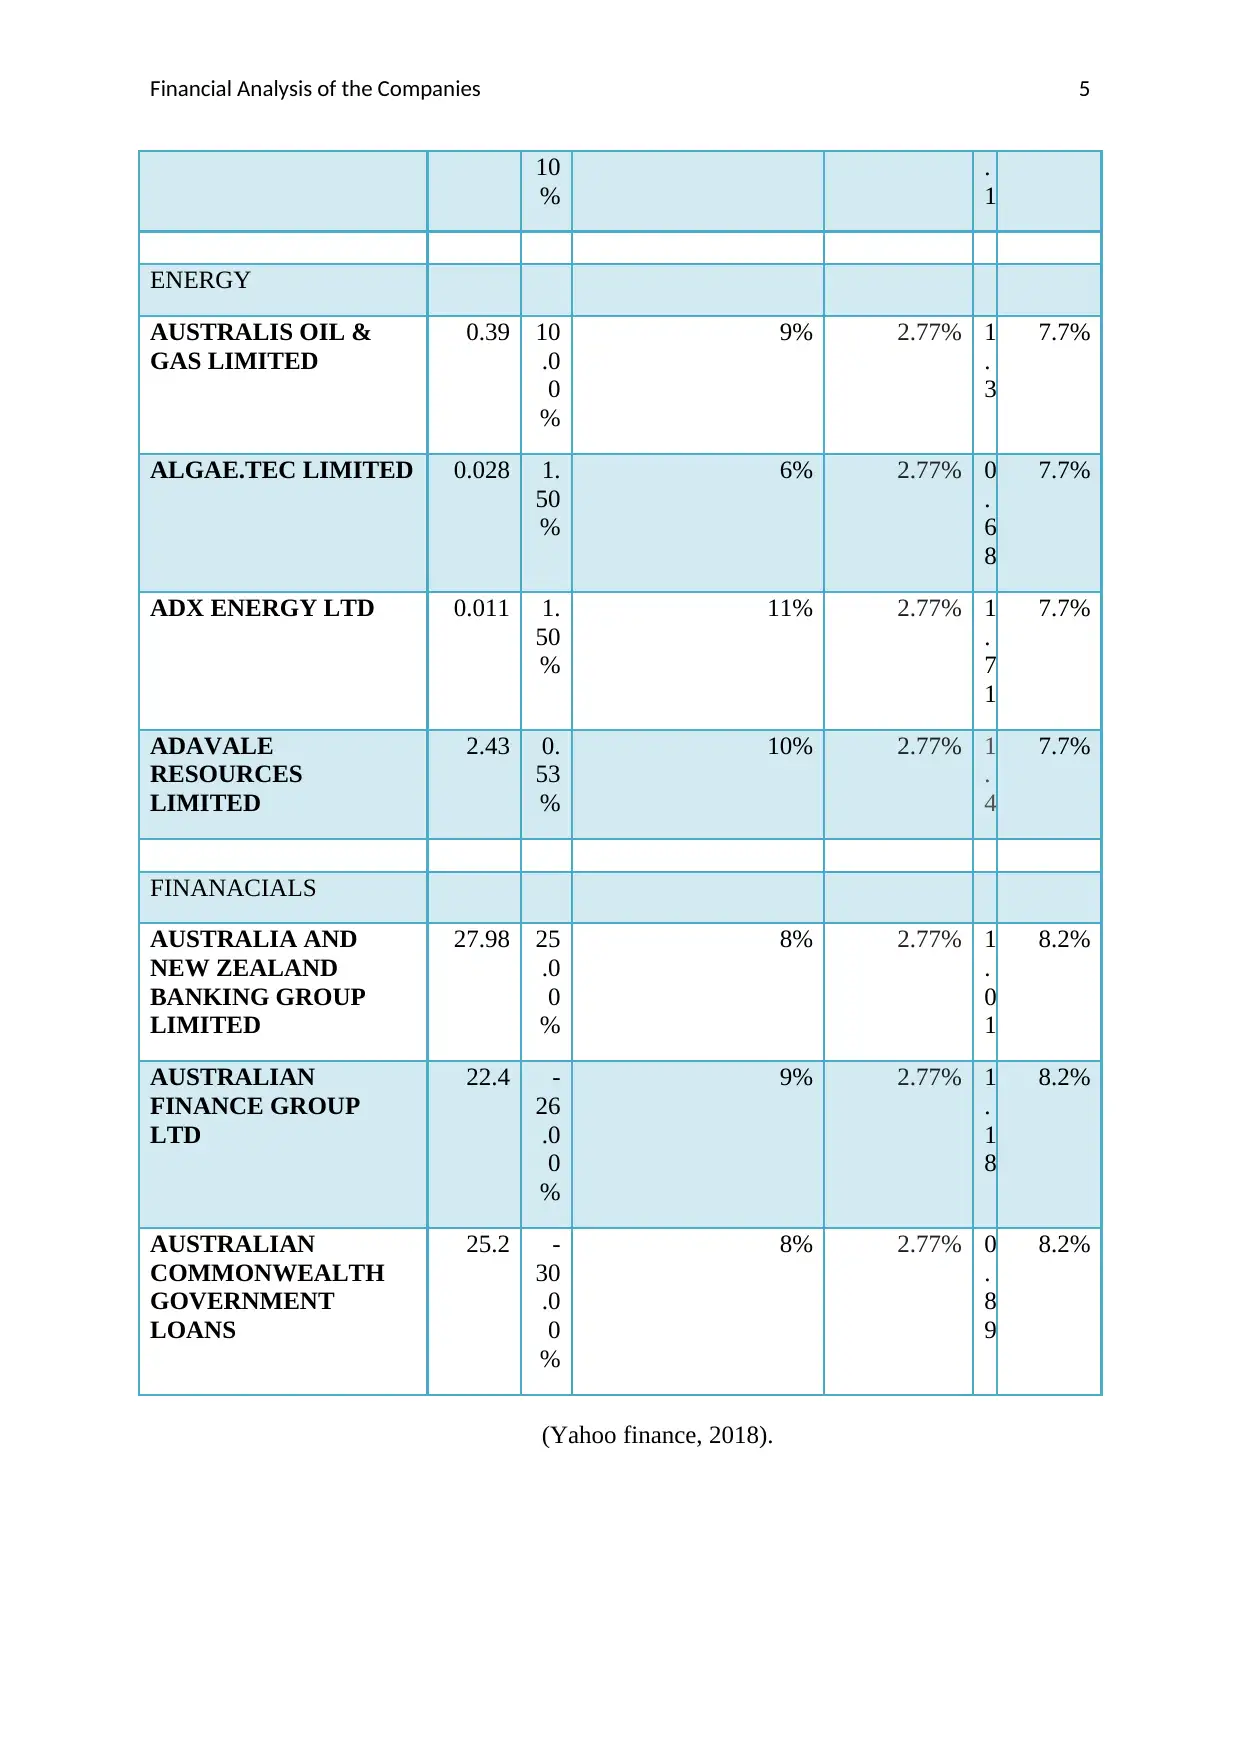
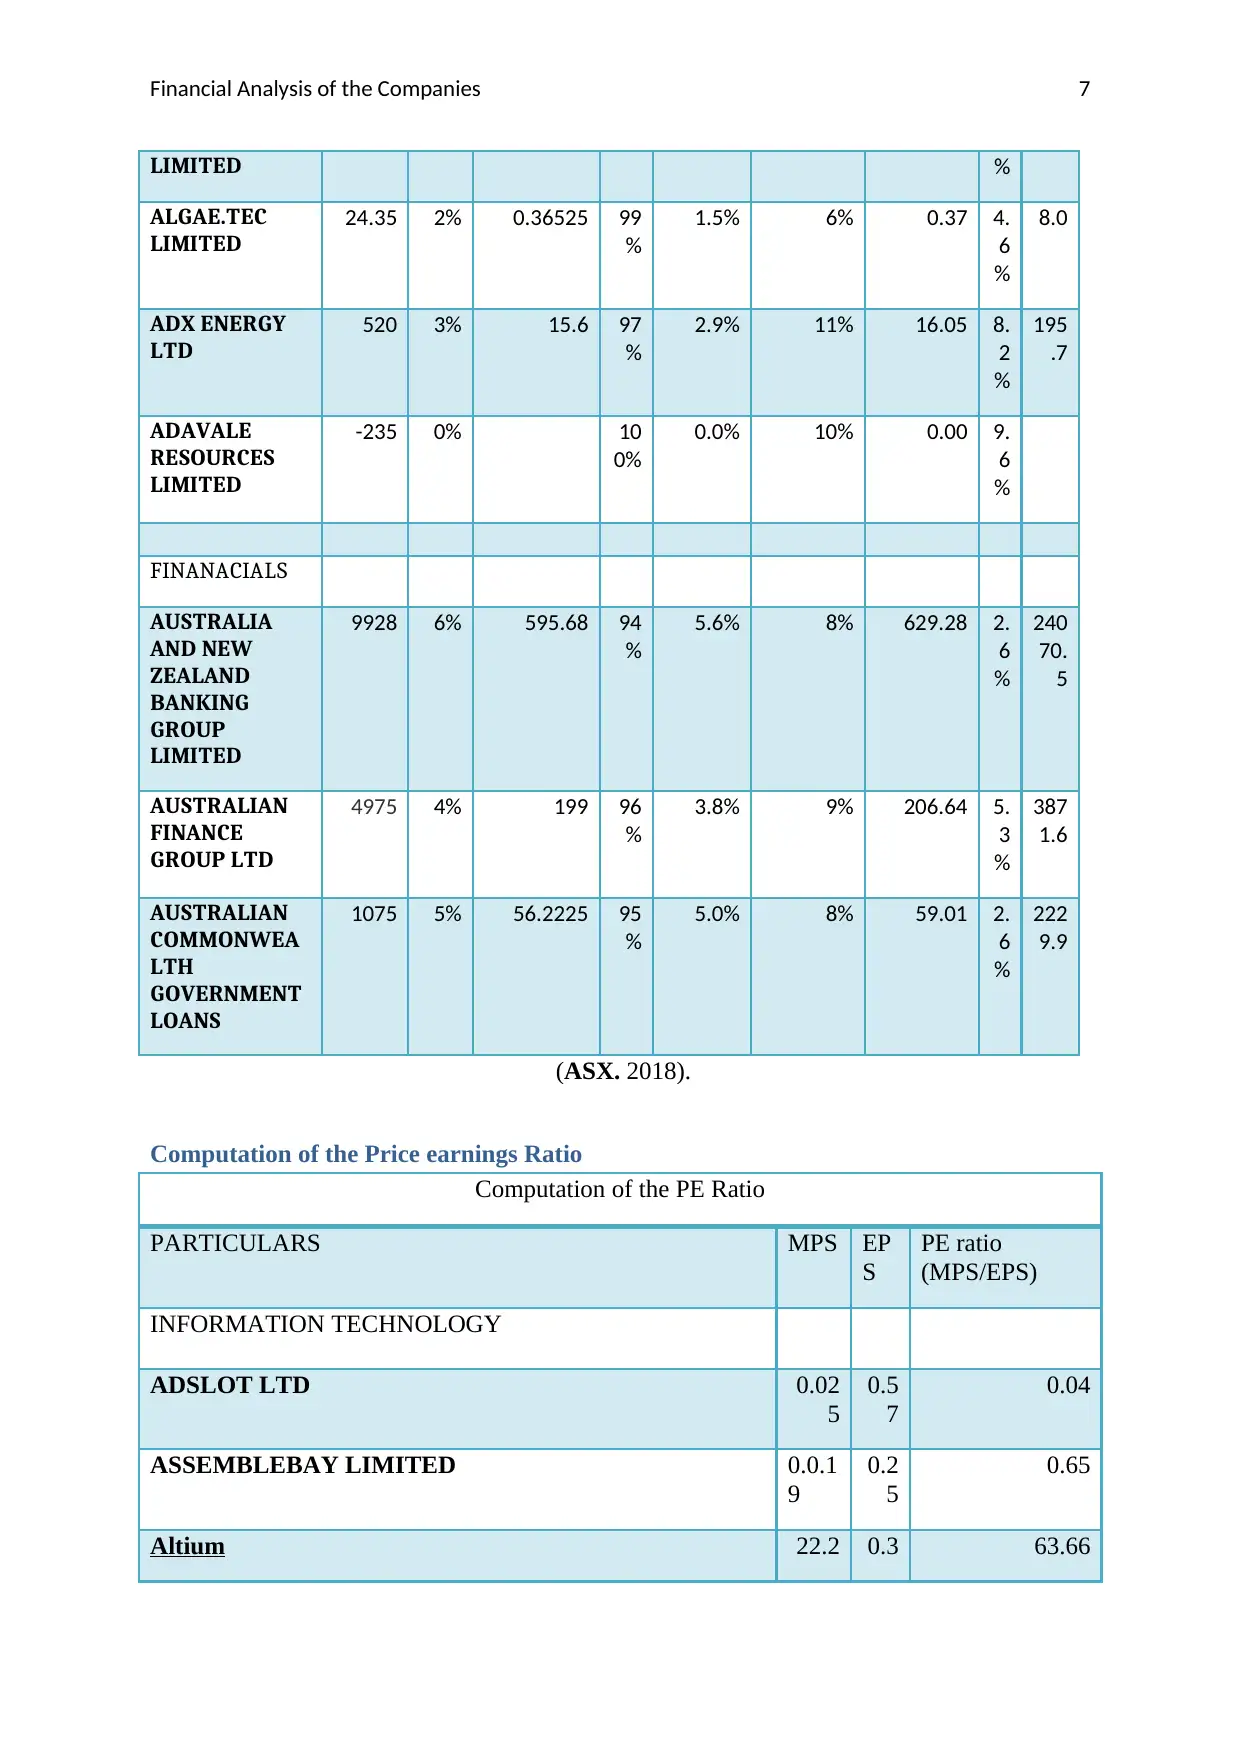
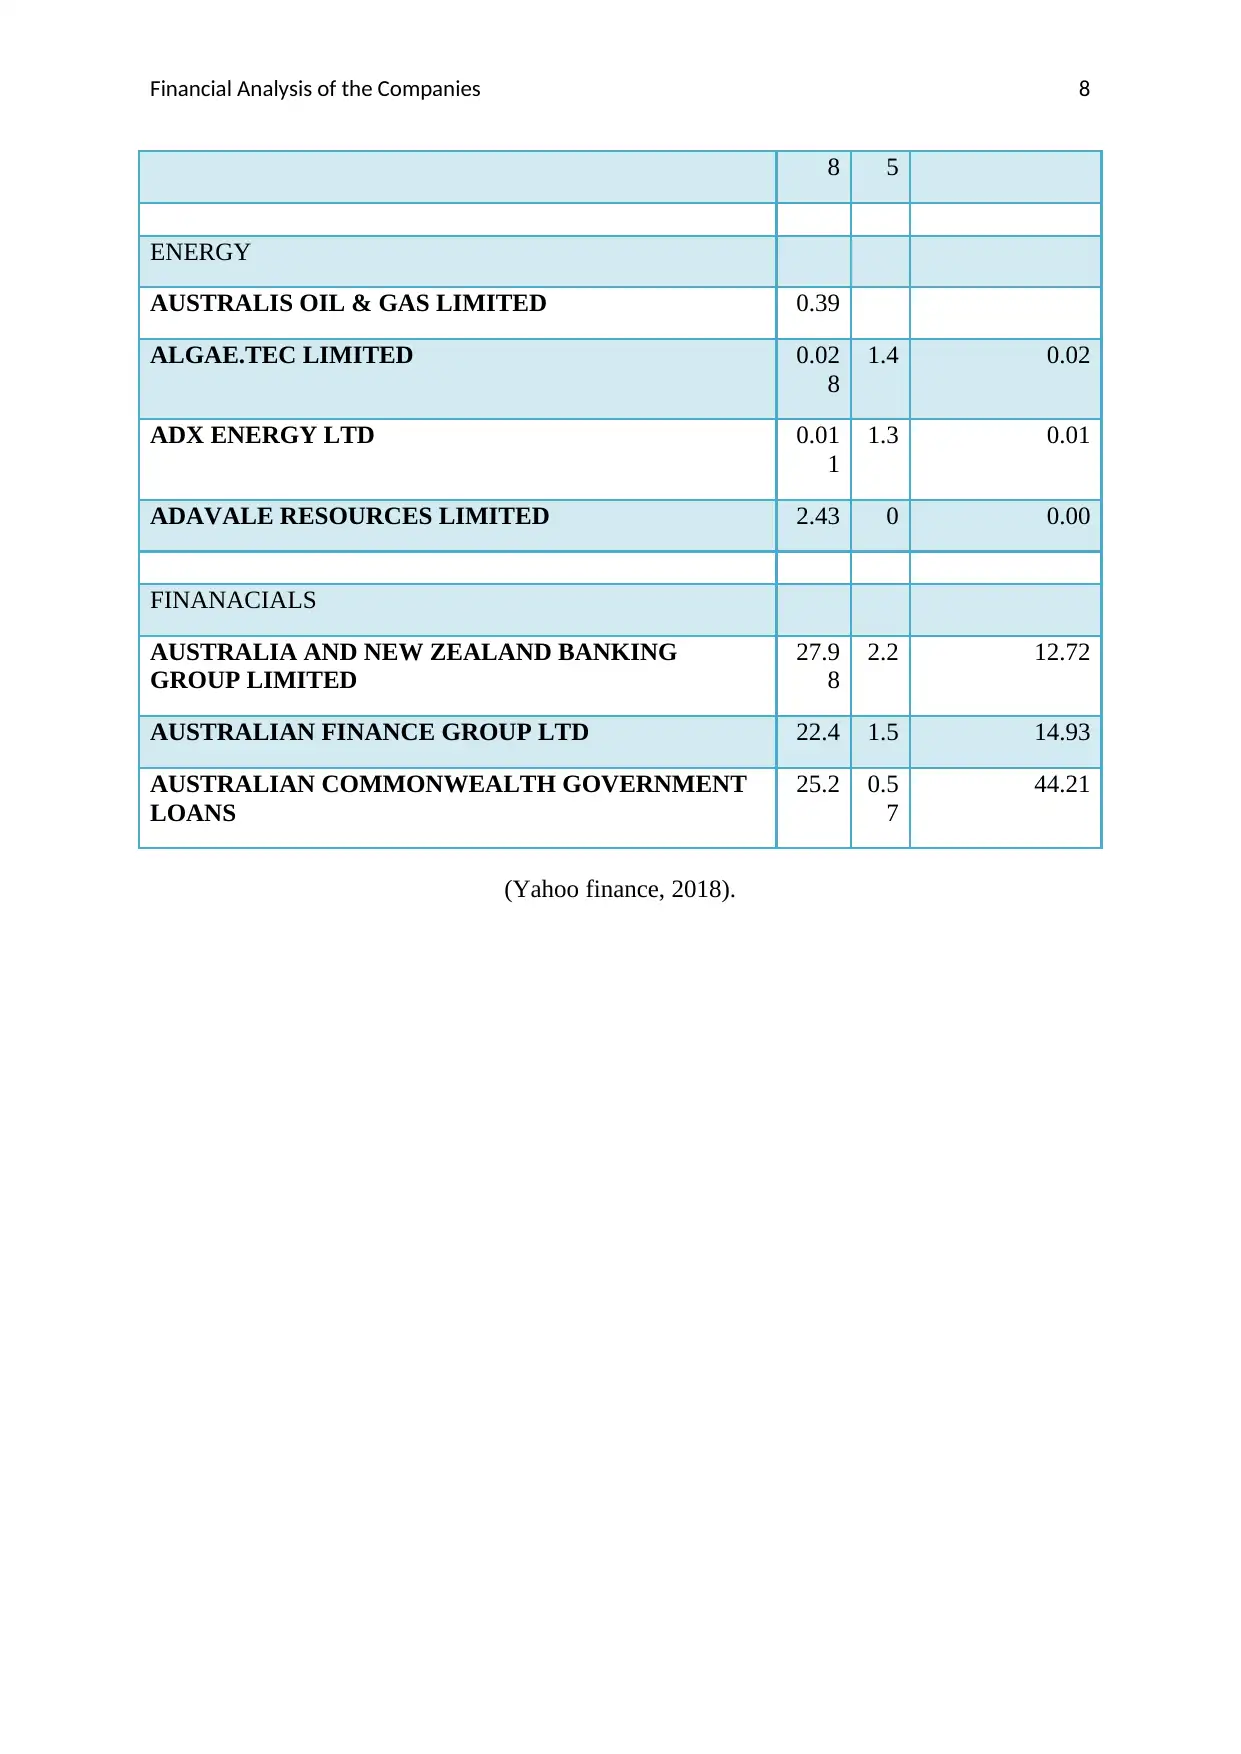
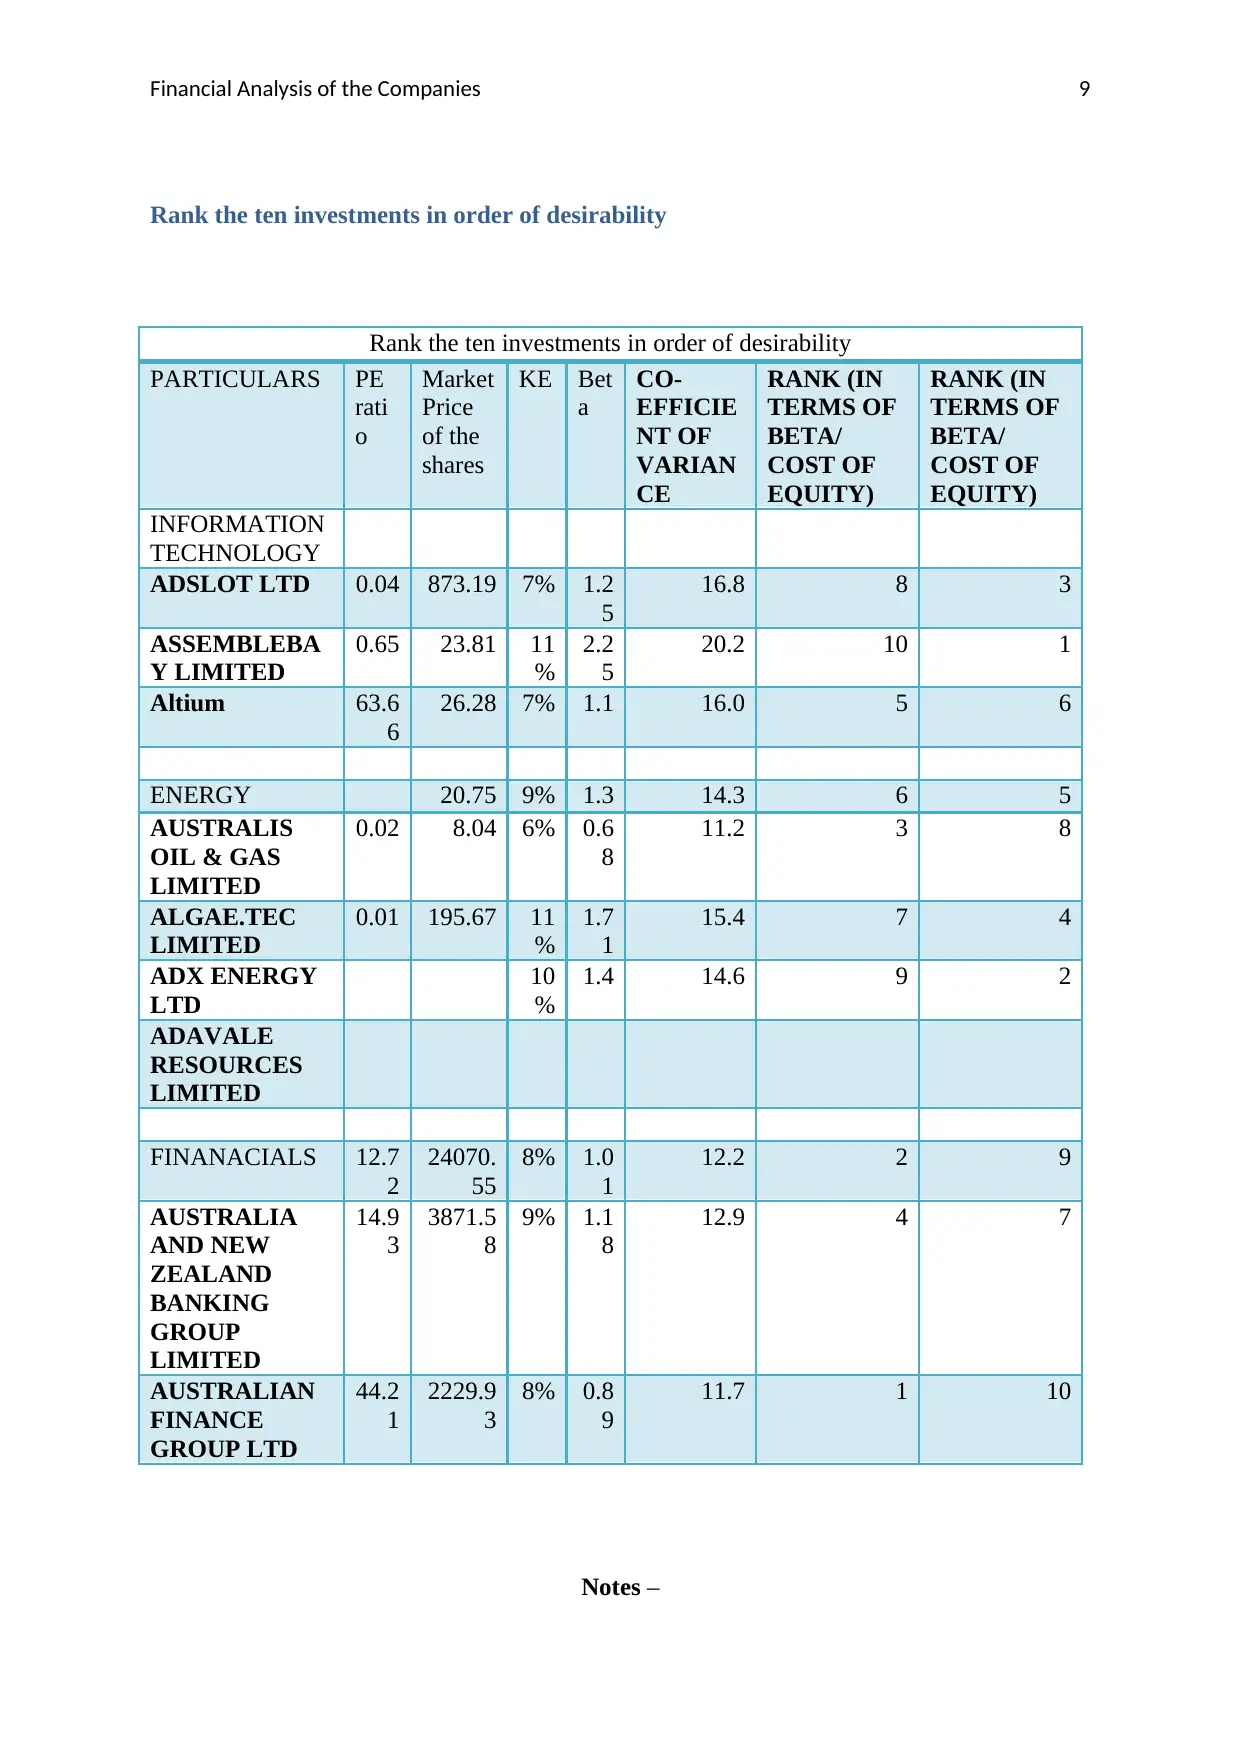
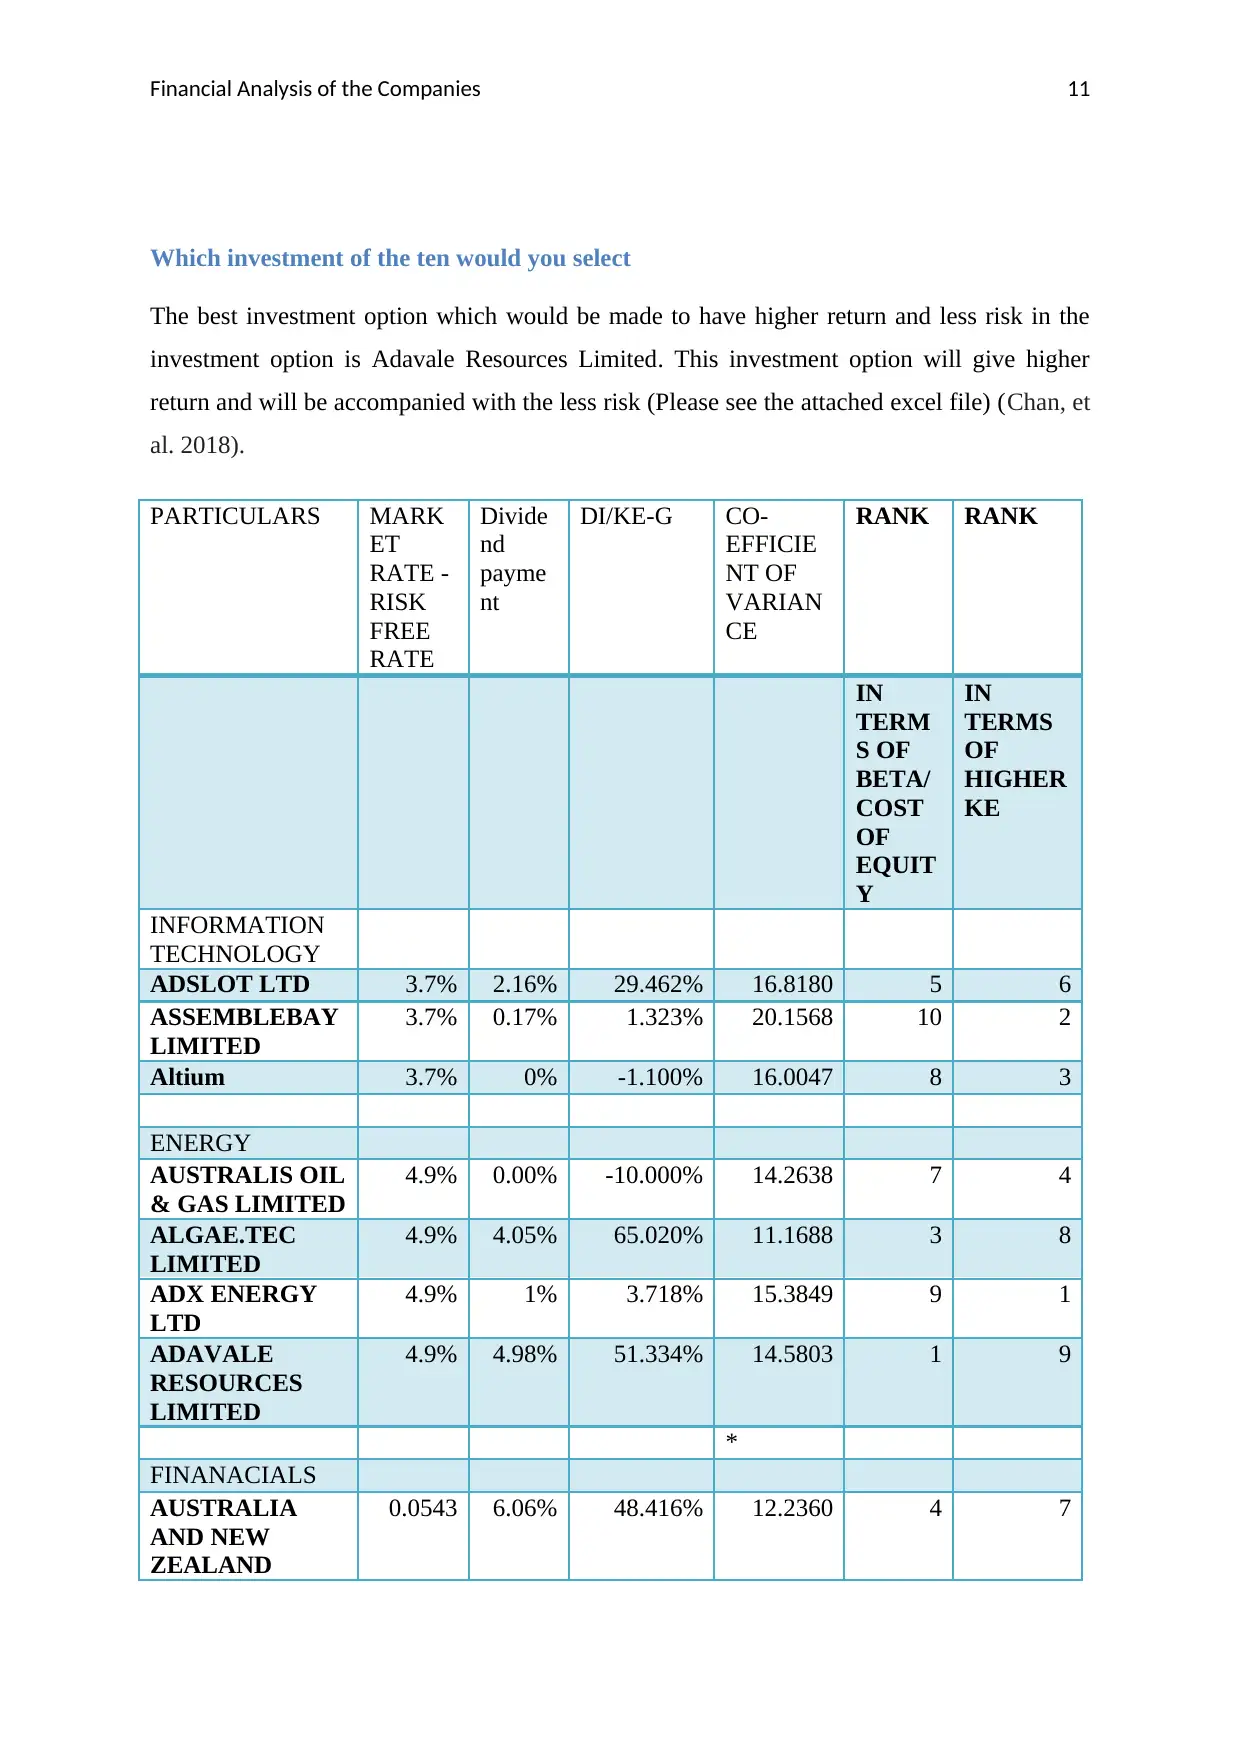
This report provides a comprehensive financial analysis of ten companies across various sectors, including information technology, energy, and financials. It delves into equity valuation methods, utilizing the Capital Asset Pricing Model (CAPM), Dividend Discount Model, and Price-Earnings (P/E) ratio to assess the companies' share prices and investment potential. The analysis includes the computation of Return on Equity (ROE), market prices, and P/E ratios for each company. Furthermore, the report ranks the investments based on desirability, considering factors like beta and cost of equity, and recommends the most promising investment option. The report also researches and summarizes key aspects of Warren Buffett's investment approach, comparing his valuation methods with the methodologies employed in the analysis. It highlights Buffett's focus on profitability, financial leverage, and intrinsic value. The report concludes by summarizing the findings and emphasizing the importance of a thorough financial analysis for making informed investment decisions. The report provides a detailed comparison of valuation techniques to help investors make informed decisions.
Document Page
Running Head: Valuation method and investment decision
0
Valuation method and investment decision
tabler-icon-diamond-filled.svg

Paraphrase This Document

Need a fresh take? Get an instant paraphrase of this document with our AI Paraphraser
Document Page
Financial Analysis of the Companies 1
Executive Summary
This report emphasises upon the share valuation methods and investment decisions of
the investors which are undertaken to create value on the investment. It is observed that there
are several investment methods which are used to identify the potential value creation stakes
in market. The Warren Buffet considers several factors such as profitability, return on capital
employed, financial leverage and market share of company before investing in the particular
stocks. In this report, all the internal and external factors need to be analyzed before investing
capital in the business. There are several companies and the valuation methods have been
used to evaluate whether the investors should invest their capital in these companies or not.
Document Page
Financial Analysis of the Companies 2
Table of Contents
Executive Summary...................................................................................................................1
Introduction................................................................................................................................3
Task 1.........................................................................................................................................4
Answer to question no-1.............................................................................................................4
Use of equity valuation method..............................................................................................4
Computation of the Return on equity of the companies.....................................................4
Computation of the market price of Shares by using Dividend Discount Model......................5
Computation of the Price earnings Ratio...................................................................................6
Rank the ten investments in order of desirability.......................................................................6
Which investment of the ten would you select.....................................................................15
Why the investment option selected.....................................................................................15
Task-2.......................................................................................................................................15
Research and summaries some interesting facts about Warren Buffet....................................15
Task 3.......................................................................................................................................16
Compare Warren Buffet’s approach to share valuation and the share valuation methodology
..................................................................................................................................................16
Share valuation Methodology...............................................................................................17
Conclusion................................................................................................................................17
References................................................................................................................................18
Appendix..................................................................................................................................20
Document Page
Financial Analysis of the Companies 3
Introduction
With the increasing ramified economic changes, investors are the person who invests
their capital in company with a view to create value on the investment.
There are several factors which need to be considered by investors before investing capital in
particular stocks such as return, risk and opportunities available in market. All companies
have been selected from different business sectors such as information technology, energy
sector and financial market sectors. After that, in the end, Warren buffet valuation methods
have been compared with other valuation methods (Andalib, Tavakolan, & Gatmiri, (2018).
All the companies have been selected from the information technologies business
sector, energy sector and financial market sector. In the end, comparisons between the
Warrant buffet valuation theory and dividend discount model and PE ratio has been done
(Zuzik, et al. 2018).
tabler-icon-diamond-filled.svg

Paraphrase This Document

Need a fresh take? Get an instant paraphrase of this document with our AI Paraphraser
Document Page
Financial Analysis of the Companies 4
Task 1
Answer to question no-1
Use of equity valuation method
In this part, 10 companies from the different industry sectors have been selected
(Guerrini, Vigolo, Romano, and Testa, 2018).
Capital assets pricing model and Discount valuation method have been used to
identify the value of the stocks in market (Yahoo finance, 2018).
Formula to compute return on equity CAPM
RF+ (RM-RF) B
The RF stands for the risk free rate of return,
RM stands for Risk of the market
B= Beta of the Company
Computation of the Return on equity of the companies
Computation of the Cost of equity of company by using the CAPM method
PARTICULARS PRIC
E OF
SHAR
ES
G
R
O
W
T
H
COST OF EQUITY
Computed by using
the CAPM model
RISK
FREE
RATE OF
RETURN
B
E
T
A
MARK
ET
RATE
INFORMATION
TECHNOLOGY
ADSLOT LTD 0.025 -
0.
40
%
7% 2.77% 1
.
2
5
6.5%
ASSEMBLEBAY
LIMITED
0.0.19 0.
20
%
11% 2.77% 2
.
2
5
6.5%
Altium 22.28 1. 7% 2.77% 1 6.5%
Document Page
Financial Analysis of the Companies 5
10
%
.
1
ENERGY
AUSTRALIS OIL &
GAS LIMITED
0.39 10
.0
0
%
9% 2.77% 1
.
3
7.7%
ALGAE.TEC LIMITED 0.028 1.
50
%
6% 2.77% 0
.
6
8
7.7%
ADX ENERGY LTD 0.011 1.
50
%
11% 2.77% 1
.
7
1
7.7%
ADAVALE
RESOURCES
LIMITED
2.43 0.
53
%
10% 2.77% 1
.
4
7.7%
FINANACIALS
AUSTRALIA AND
NEW ZEALAND
BANKING GROUP
LIMITED
27.98 25
.0
0
%
8% 2.77% 1
.
0
1
8.2%
AUSTRALIAN
FINANCE GROUP
LTD
22.4 -
26
.0
0
%
9% 2.77% 1
.
1
8
8.2%
AUSTRALIAN
COMMONWEALTH
GOVERNMENT
LOANS
25.2 -
30
.0
0
%
8% 2.77% 0
.
8
9
8.2%
(Yahoo finance, 2018).
Document Page
Financial Analysis of the Companies 6
Computation of the market price of Shares by using Dividend Discount Model
This method is used to compute the share price of Companies by using the growth,
last year price and retained earnings (Beatson, & Chen, 2018).
Price of the company D1/ Ke-G
D1 Dividend payment
Ke= Cost of the equity
G= Growth rate
Particular Net
incom
e( $ in
millio
n
Divi
den
d
pay
-out
rati
o
Dividend
payment
Re
te
nti
on
rat
io
Growth
rate
KE D1 (In
million)
K
E
-
G
Sh
are
pri
ce
of
Co
mp
an
y
INFORMATION
TECHNOLOGY
ADSLOT LTD 2105.8 2% 45.48528 98
%
2.1% 7% 46.45 5.
3
%
873
.2
ASSEMBLEBAY
LIMITED
1537 0% 2.6129 10
0%
0.2% 11% 2.62 1
1.
0
%
23.
8
Altium 63.31 2% 1.2662 98
%
2.0% 7% 1.29 4.
9
%
26.
3
ENERGY
AUSTRALIS
OIL & GAS
64.29 2% 1.41438 98
%
2.2% 9% 1.44 7.
0
20.
8
tabler-icon-diamond-filled.svg

Paraphrase This Document

Need a fresh take? Get an instant paraphrase of this document with our AI Paraphraser
Document Page
Financial Analysis of the Companies 7
LIMITED %
ALGAE.TEC
LIMITED
24.35 2% 0.36525 99
%
1.5% 6% 0.37 4.
6
%
8.0
ADX ENERGY
LTD
520 3% 15.6 97
%
2.9% 11% 16.05 8.
2
%
195
.7
ADAVALE
RESOURCES
LIMITED
-235 0% 10
0%
0.0% 10% 0.00 9.
6
%
FINANACIALS
AUSTRALIA
AND NEW
ZEALAND
BANKING
GROUP
LIMITED
9928 6% 595.68 94
%
5.6% 8% 629.28 2.
6
%
240
70.
5
AUSTRALIAN
FINANCE
GROUP LTD
4975 4% 199 96
%
3.8% 9% 206.64 5.
3
%
387
1.6
AUSTRALIAN
COMMONWEA
LTH
GOVERNMENT
LOANS
1075 5% 56.2225 95
%
5.0% 8% 59.01 2.
6
%
222
9.9
(ASX. 2018).
Computation of the Price earnings Ratio
Computation of the PE Ratio
PARTICULARS MPS EP
S
PE ratio
(MPS/EPS)
INFORMATION TECHNOLOGY
ADSLOT LTD 0.02
5
0.5
7
0.04
ASSEMBLEBAY LIMITED 0.0.1
9
0.2
5
0.65
Altium 22.2 0.3 63.66
Document Page
Financial Analysis of the Companies 8
8 5
ENERGY
AUSTRALIS OIL & GAS LIMITED 0.39
ALGAE.TEC LIMITED 0.02
8
1.4 0.02
ADX ENERGY LTD 0.01
1
1.3 0.01
ADAVALE RESOURCES LIMITED 2.43 0 0.00
FINANACIALS
AUSTRALIA AND NEW ZEALAND BANKING
GROUP LIMITED
27.9
8
2.2 12.72
AUSTRALIAN FINANCE GROUP LTD 22.4 1.5 14.93
AUSTRALIAN COMMONWEALTH GOVERNMENT
LOANS
25.2 0.5
7
44.21
(Yahoo finance, 2018).
Document Page
Financial Analysis of the Companies 9
Rank the ten investments in order of desirability
PARTICULARS PE
rati
o
Market
Price
of the
shares
KE Bet
a
CO-
EFFICIE
NT OF
VARIAN
CE
RANK (IN
TERMS OF
BETA/
COST OF
EQUITY)
RANK (IN
TERMS OF
BETA/
COST OF
EQUITY)
INFORMATION
TECHNOLOGY
ADSLOT LTD 0.04 873.19 7% 1.2
5
16.8 8 3
ASSEMBLEBA
Y LIMITED
0.65 23.81 11
%
2.2
5
20.2 10 1
Altium 63.6
6
26.28 7% 1.1 16.0 5 6
ENERGY 20.75 9% 1.3 14.3 6 5
AUSTRALIS
OIL & GAS
LIMITED
0.02 8.04 6% 0.6
8
11.2 3 8
ALGAE.TEC
LIMITED
0.01 195.67 11
%
1.7
1
15.4 7 4
ADX ENERGY
LTD
10
%
1.4 14.6 9 2
ADAVALE
RESOURCES
LIMITED
FINANACIALS 12.7
2
24070.
55
8% 1.0
1
12.2 2 9
AUSTRALIA
AND NEW
ZEALAND
BANKING
GROUP
LIMITED
14.9
3
3871.5
8
9% 1.1
8
12.9 4 7
AUSTRALIAN
FINANCE
GROUP LTD
44.2
1
2229.9
3
8% 0.8
9
11.7 1 10
Notes
tabler-icon-diamond-filled.svg

Paraphrase This Document

Need a fresh take? Get an instant paraphrase of this document with our AI Paraphraser
Document Page
Financial Analysis of the Companies 10
Beta- (Yahoo finance, 2018).
Market risk factor- (Yahoo finance, 2018)
RF-(Bloomberg, 2018)
Document Page
Financial Analysis of the Companies 11
Which investment of the ten would you select
The best investment option which would be made to have higher return and less risk in the
investment option is Adavale Resources Limited. This investment option will give higher
return and will be accompanied with the less risk (Please see the attached excel file) (Chan, et
al. 2018).
PARTICULARS MARK
ET
RATE -
RISK
FREE
RATE
Divide
nd
payme
nt
DI/KE-G CO-
EFFICIE
NT OF
VARIAN
CE
RANK RANK
IN
TERM
S OF
BETA/
COST
OF
EQUIT
Y
IN
TERMS
OF
HIGHER
KE
INFORMATION
TECHNOLOGY
ADSLOT LTD 3.7% 2.16% 29.462% 16.8180 5 6
ASSEMBLEBAY
LIMITED
3.7% 0.17% 1.323% 20.1568 10 2
Altium 3.7% 0% -1.100% 16.0047 8 3
ENERGY
AUSTRALIS OIL
& GAS LIMITED
4.9% 0.00% -10.000% 14.2638 7 4
ALGAE.TEC
LIMITED
4.9% 4.05% 65.020% 11.1688 3 8
ADX ENERGY
LTD
4.9% 1% 3.718% 15.3849 9 1
ADAVALE
RESOURCES
LIMITED
4.9% 4.98% 51.334% 14.5803 1 9
*
FINANACIALS
AUSTRALIA
AND NEW
ZEALAND
0.0543 6.06% 48.416% 12.2360 4 7
chevron_up_icon
1 out of 26
circle_padding
hide_on_mobile
zoom_out_icon
[object Object]