Financial Variance Report and Debtors Ageing Analysis

Verified

Added on  2020/04/21

|7
|417
|51
Report
AI Summary
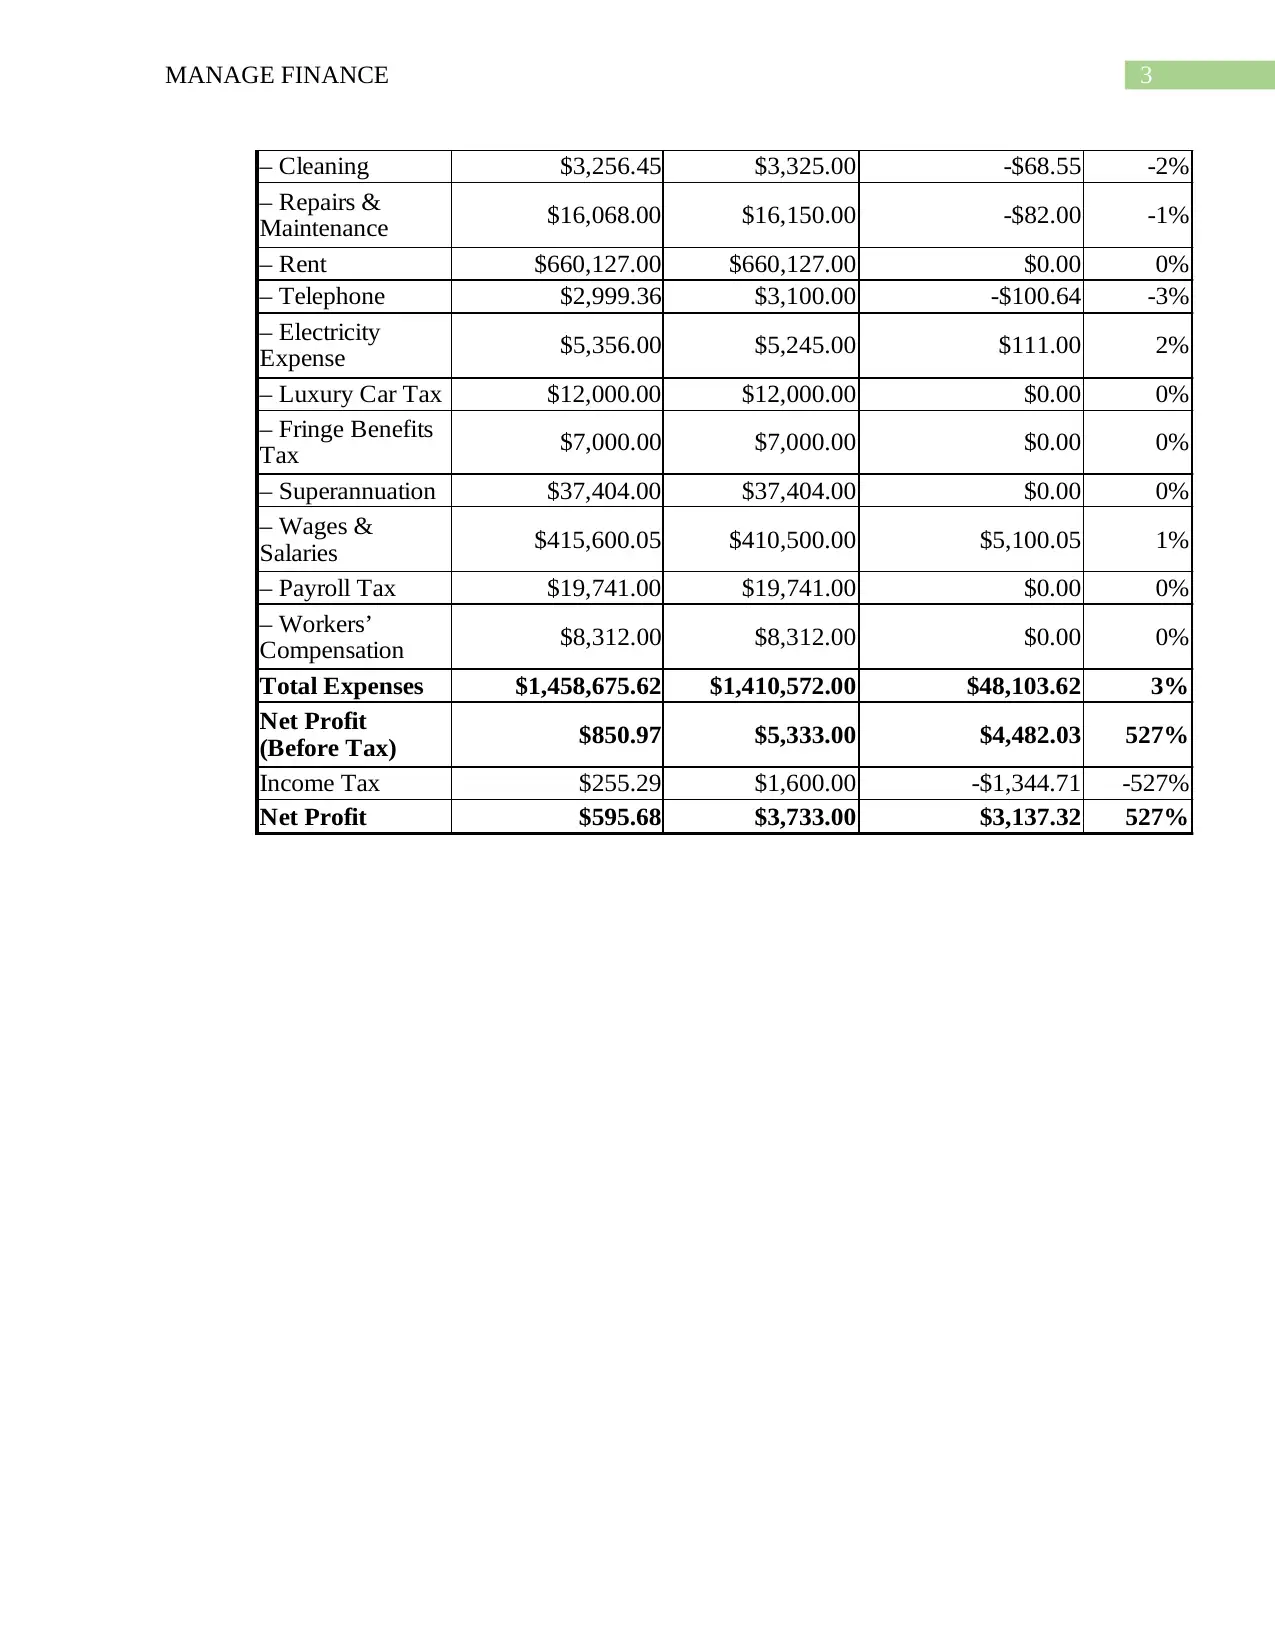
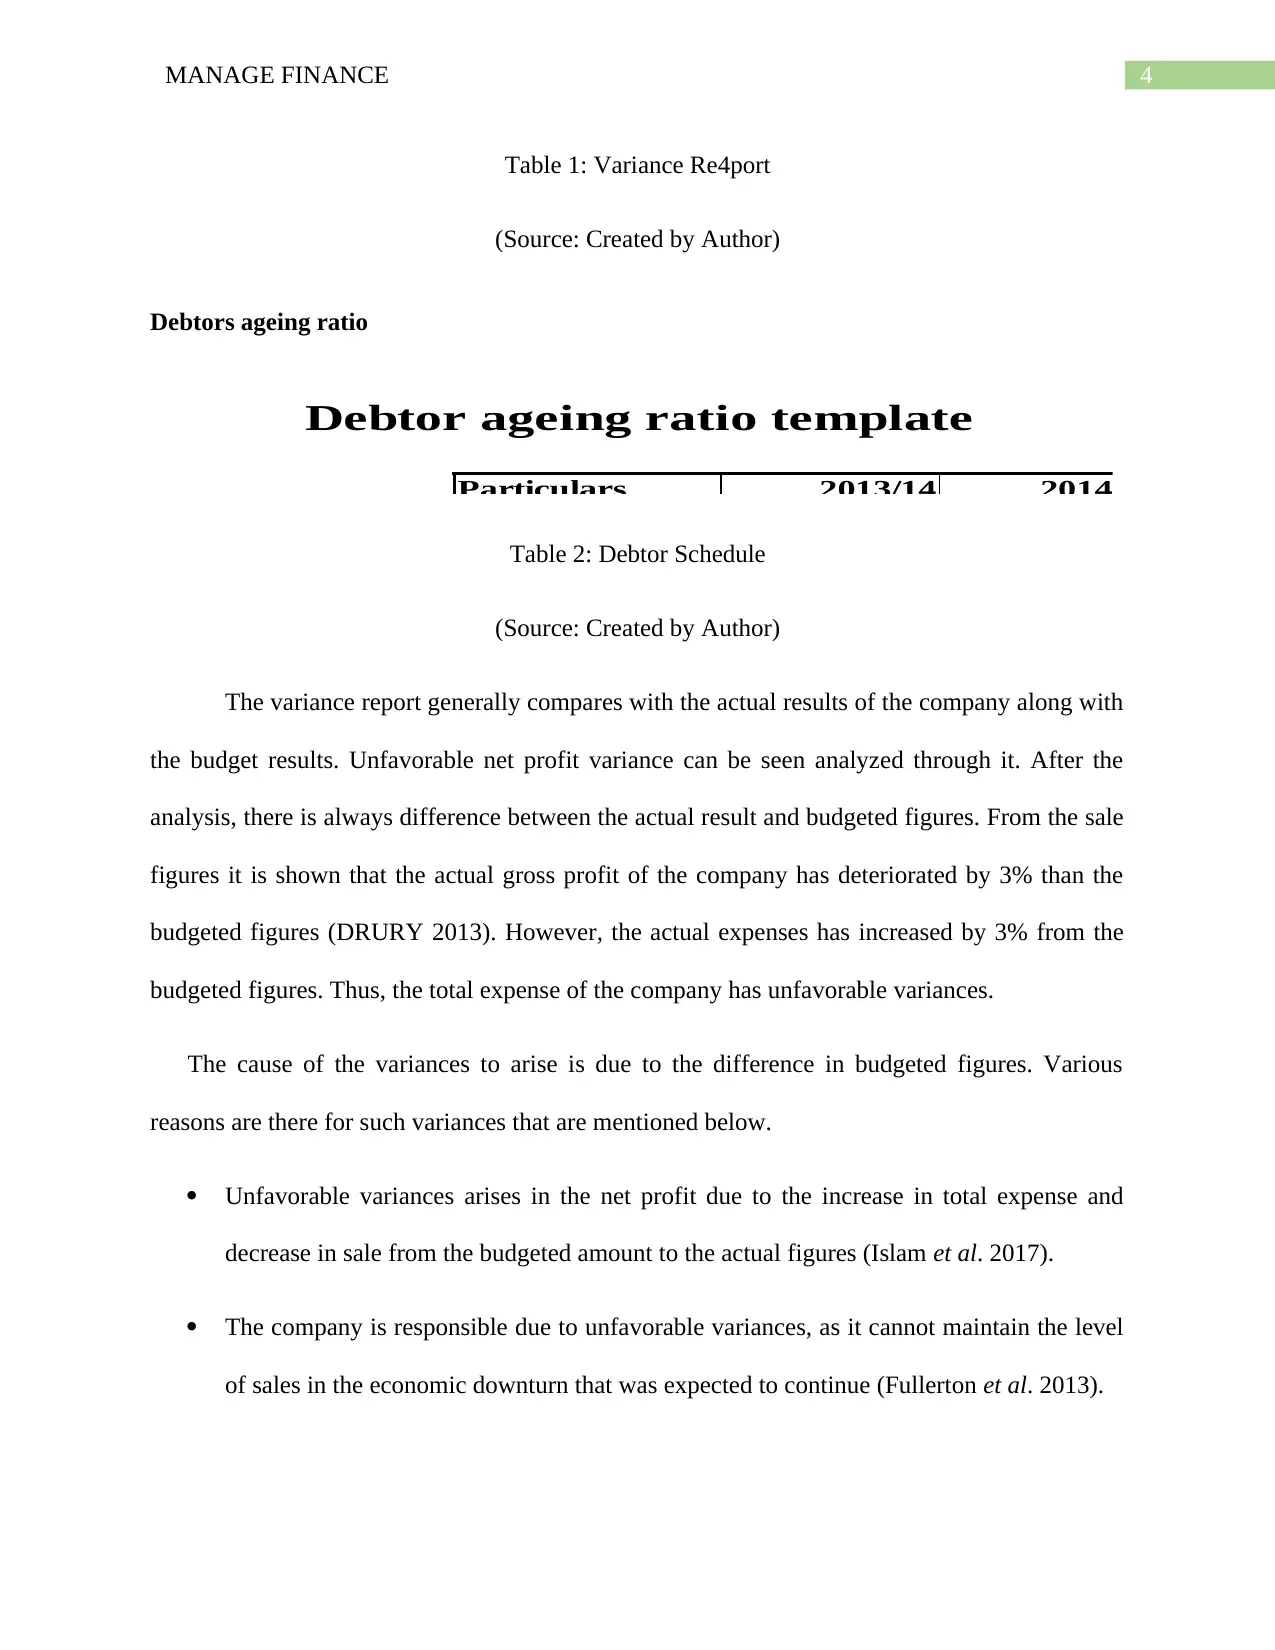
This report provides an analysis of a financial variance report, focusing on the comparison between budgeted and actual figures. It highlights unfavorable variances in net profit, primarily due to increased expenses and decreased sales. The report examines the causes of these variances, including the impact of an economic downturn on sales and increased costs of goods sold. It also analyzes the debtors ageing ratio and its implications. The report references relevant literature to support its findings, providing a comprehensive overview of financial performance and variance analysis. The report also provides a table of variance report and debtor schedule. The report highlights the importance of financial analysis in understanding the company's performance and making informed decisions.
tabler-icon-diamond-filled.svg

Contribute Materials

Your contribution can guide someone’s learning journey. Share your documents today.
Document Page
Running head: MANAGE FINANCE
Manage Finance
Name of the Student:
Name of the University:
Authors Note:
tabler-icon-diamond-filled.svg

Secure Best Marks with AI Grader

Need help grading? Try our AI Grader for instant feedback on your assignments.
Document Page
1MANAGE FINANCE
Table of Contents
Budget Variance..............................................................................................................................2
Debtors ageing ratio.........................................................................................................................3
Reference.........................................................................................................................................4
Document Page
2MANAGE FINANCE
Budget Variance
Document Page
3MANAGE FINANCE
– Cleaning $3,256.45 $3,325.00 -$68.55 -2%
$16,068.00 $16,150.00 -$82.00 -1%
– Rent $660,127.00 $660,127.00 $0.00 0%
– Telephone $2,999.36 $3,100.00 -$100.64 -3%
$5,356.00 $5,245.00 $111.00 2%
– Luxury Car Tax $12,000.00 $12,000.00 $0.00 0%
$7,000.00 $7,000.00 $0.00 0%
– Superannuation $37,404.00 $37,404.00 $0.00 0%
$415,600.05 $410,500.00 $5,100.05 1%
– Payroll Tax $19,741.00 $19,741.00 $0.00 0%
$8,312.00 $8,312.00 $0.00 0%
Total Expenses $1,458,675.62 $1,410,572.00 $48,103.62 3%
$850.97 $5,333.00 $4,482.03 527%
Income Tax $255.29 $1,600.00 -$1,344.71 -527%
Net Profit $595.68 $3,733.00 $3,137.32 527%
Repairs &
Maintenance
Electricity
Expense
Fringe Benefits
Tax
Wages &
Salaries
Workers’
Compensation
Net Profit
(Before Tax)
tabler-icon-diamond-filled.svg

Secure Best Marks with AI Grader

Need help grading? Try our AI Grader for instant feedback on your assignments.
Document Page
4MANAGE FINANCE
Table 1: Variance Re4port
(Source: Created by Author)
Debtors ageing ratio
Debtor ageing ratio template
Particulars 2013/14 2014/15
Table 2: Debtor Schedule
(Source: Created by Author)
The variance report generally compares with the actual results of the company along with
the budget results. Unfavorable net profit variance can be seen analyzed through it. After the
analysis, there is always difference between the actual result and budgeted figures. From the sale
figures it is shown that the actual gross profit of the company has deteriorated by 3% than the
budgeted figures (DRURY 2013). However, the actual expenses has increased by 3% from the
budgeted figures. Thus, the total expense of the company has unfavorable variances.
The cause of the variances to arise is due to the difference in budgeted figures. Various
reasons are there for such variances that are mentioned below.
Unfavorable variances arises in the net profit due to the increase in total expense and
decrease in sale from the budgeted amount to the actual figures (Islam et al. 2017).
The company is responsible due to unfavorable variances, as it cannot maintain the level
of sales in the economic downturn that was expected to continue (Fullerton et al. 2013).
Document Page
5MANAGE FINANCE
The gross profit of the company also faces the same as sales of the company has declined
by 1%. And at the same time the costs of the goods sold has also increased by 2%.
Interest expenses has also increased by 33%.
Document Page
6MANAGE FINANCE
Reference
DRURY, C.M., 2013. Management and cost accounting. Springer.
Fullerton, R.R., Kennedy, F.A. and Widener, S.K., 2013. Management accounting and control
practices in a lean manufacturing environment. Accounting, Organizations and Society, 38(1),
pp.50-71.
Islam, K., CH, A.R., Bilal, A.R. and Ilyas, M.U.H.A.M.M.A.D., 2017. Accounting Information
Systems: Traditions and Future Directions (By Using AIS in Traditional Organizations). The
Journal of Internet Banking and Commerce, 22(2), pp.1-13.
chevron_up_icon
1 out of 7
circle_padding
hide_on_mobile
zoom_out_icon
logo.png

Your All-in-One AI-Powered Toolkit for Academic Success.

Available 24*7 on WhatsApp / Email

[object Object]