FINC20018 Managerial Finance: Fortescue Metals Group Report

Verified

Added on  2022/08/19

|7
|563
|12
Report
AI Summary
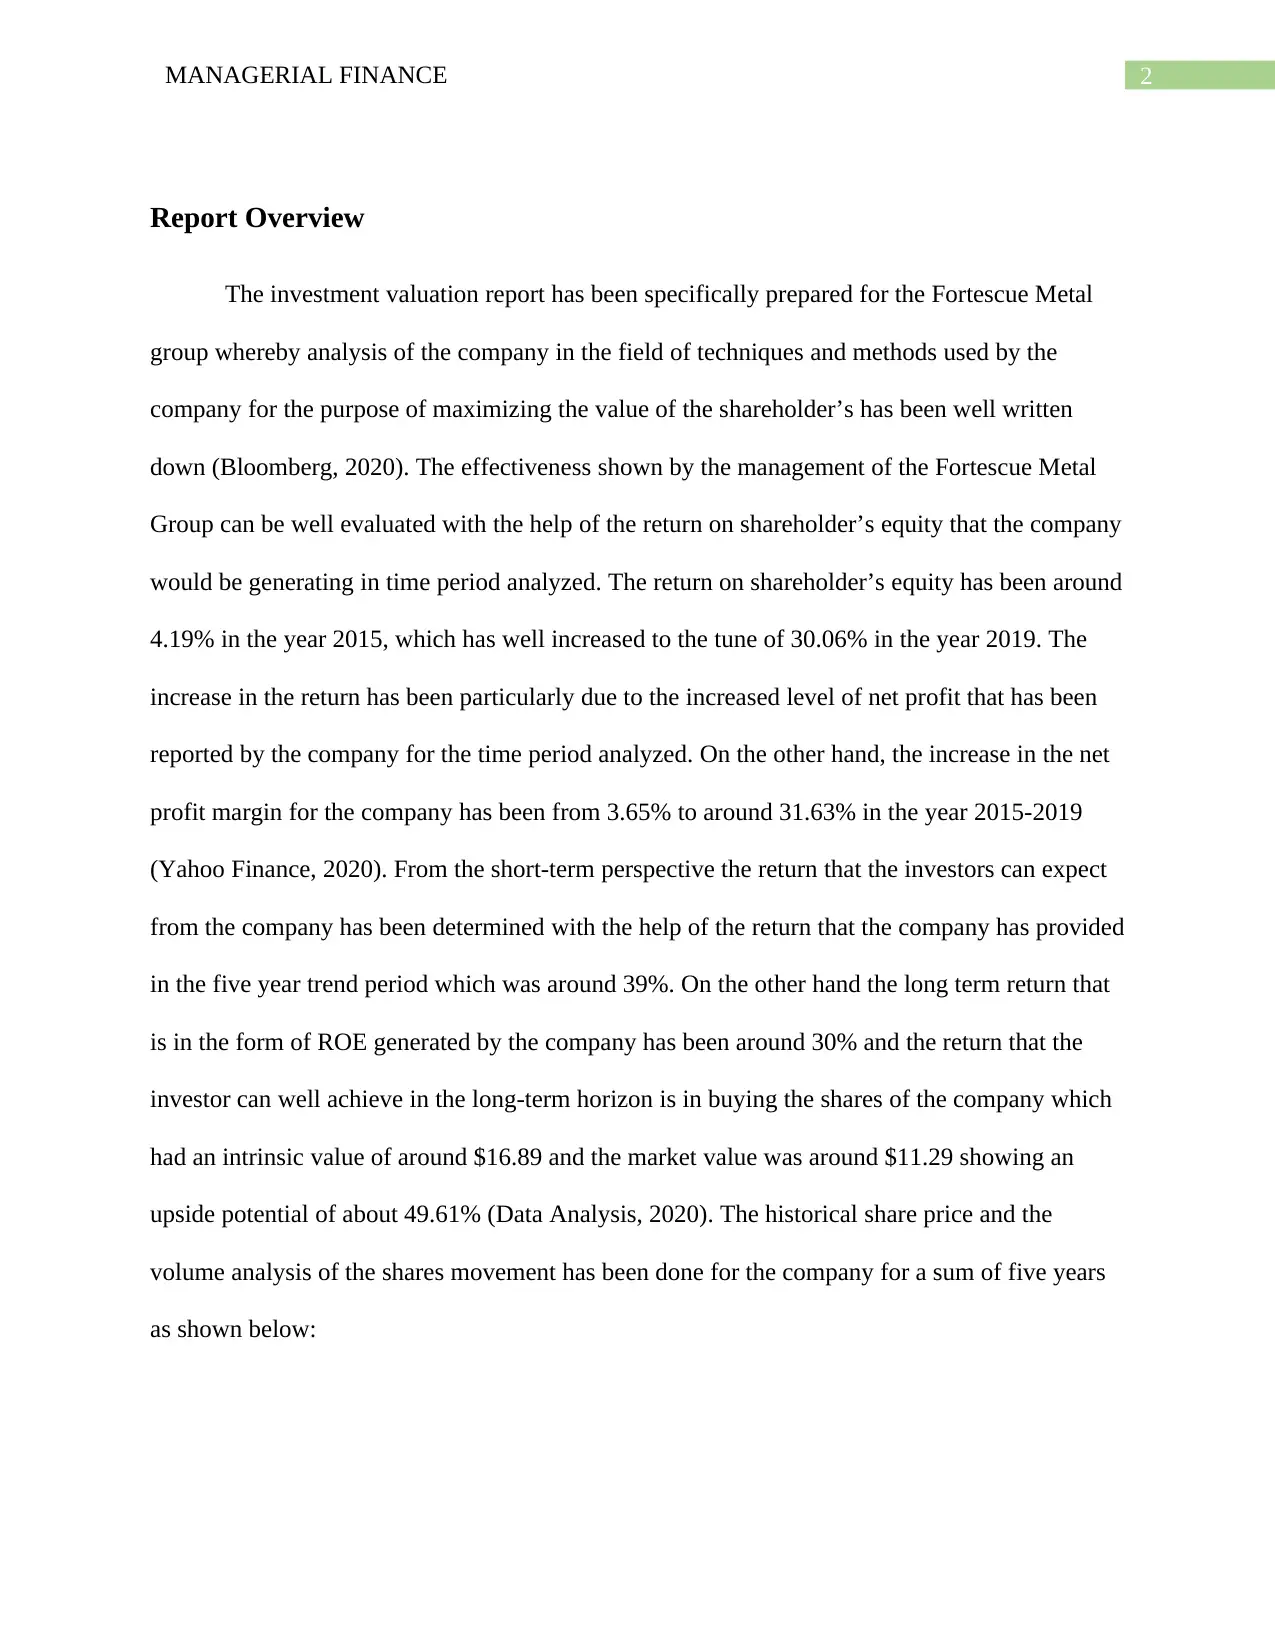
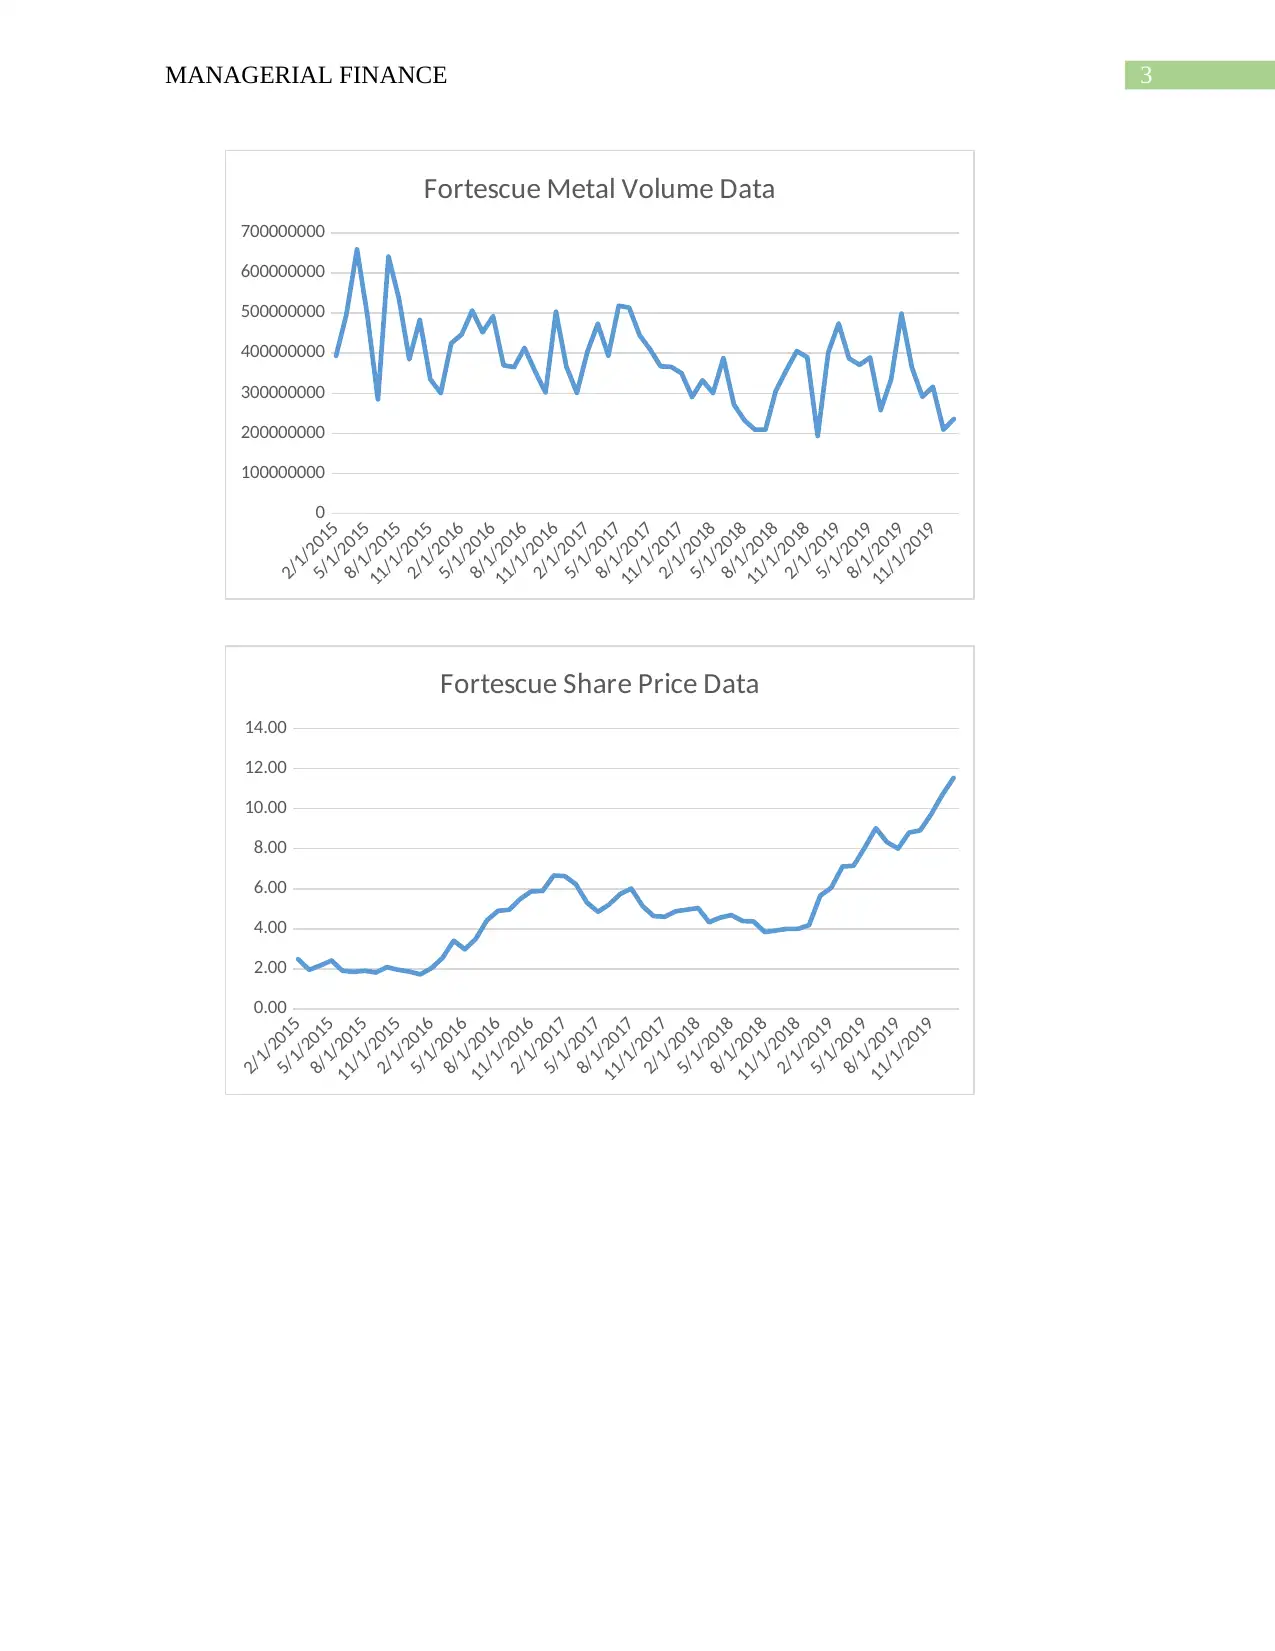
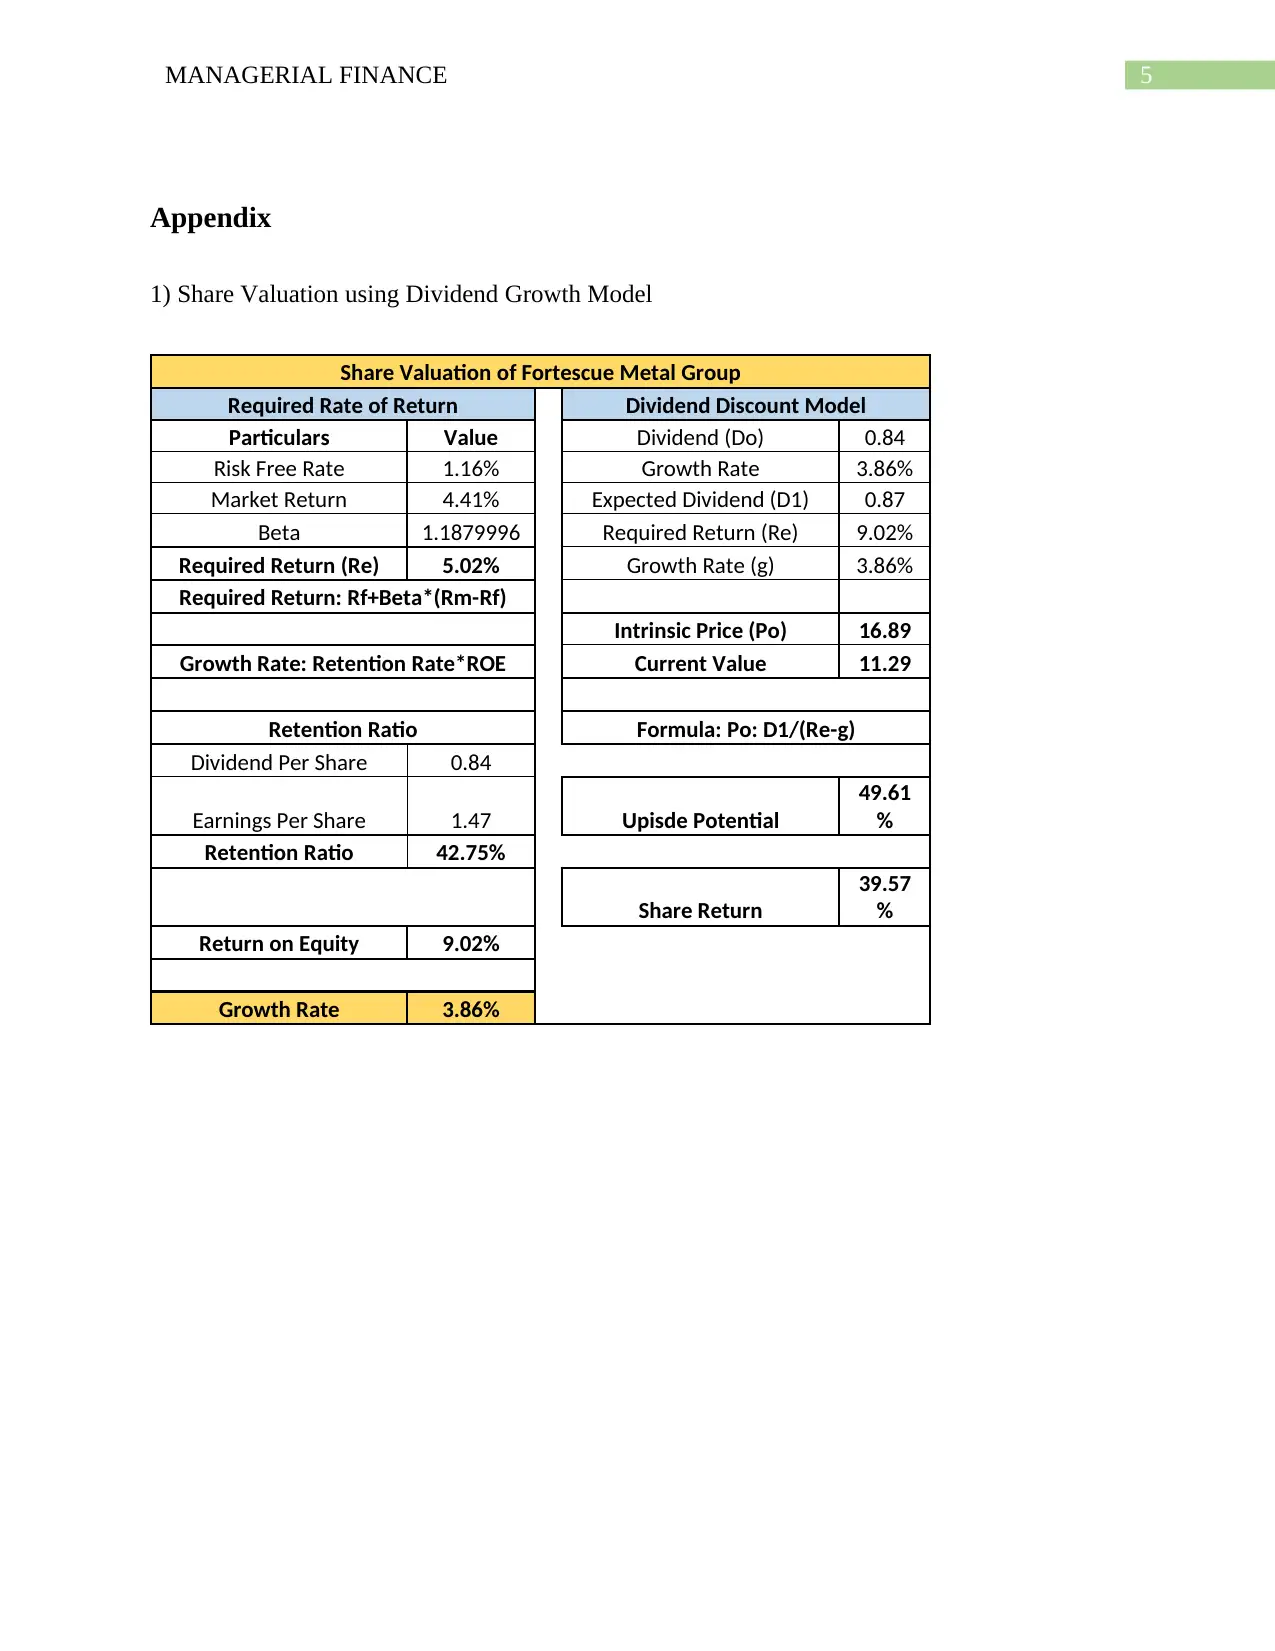
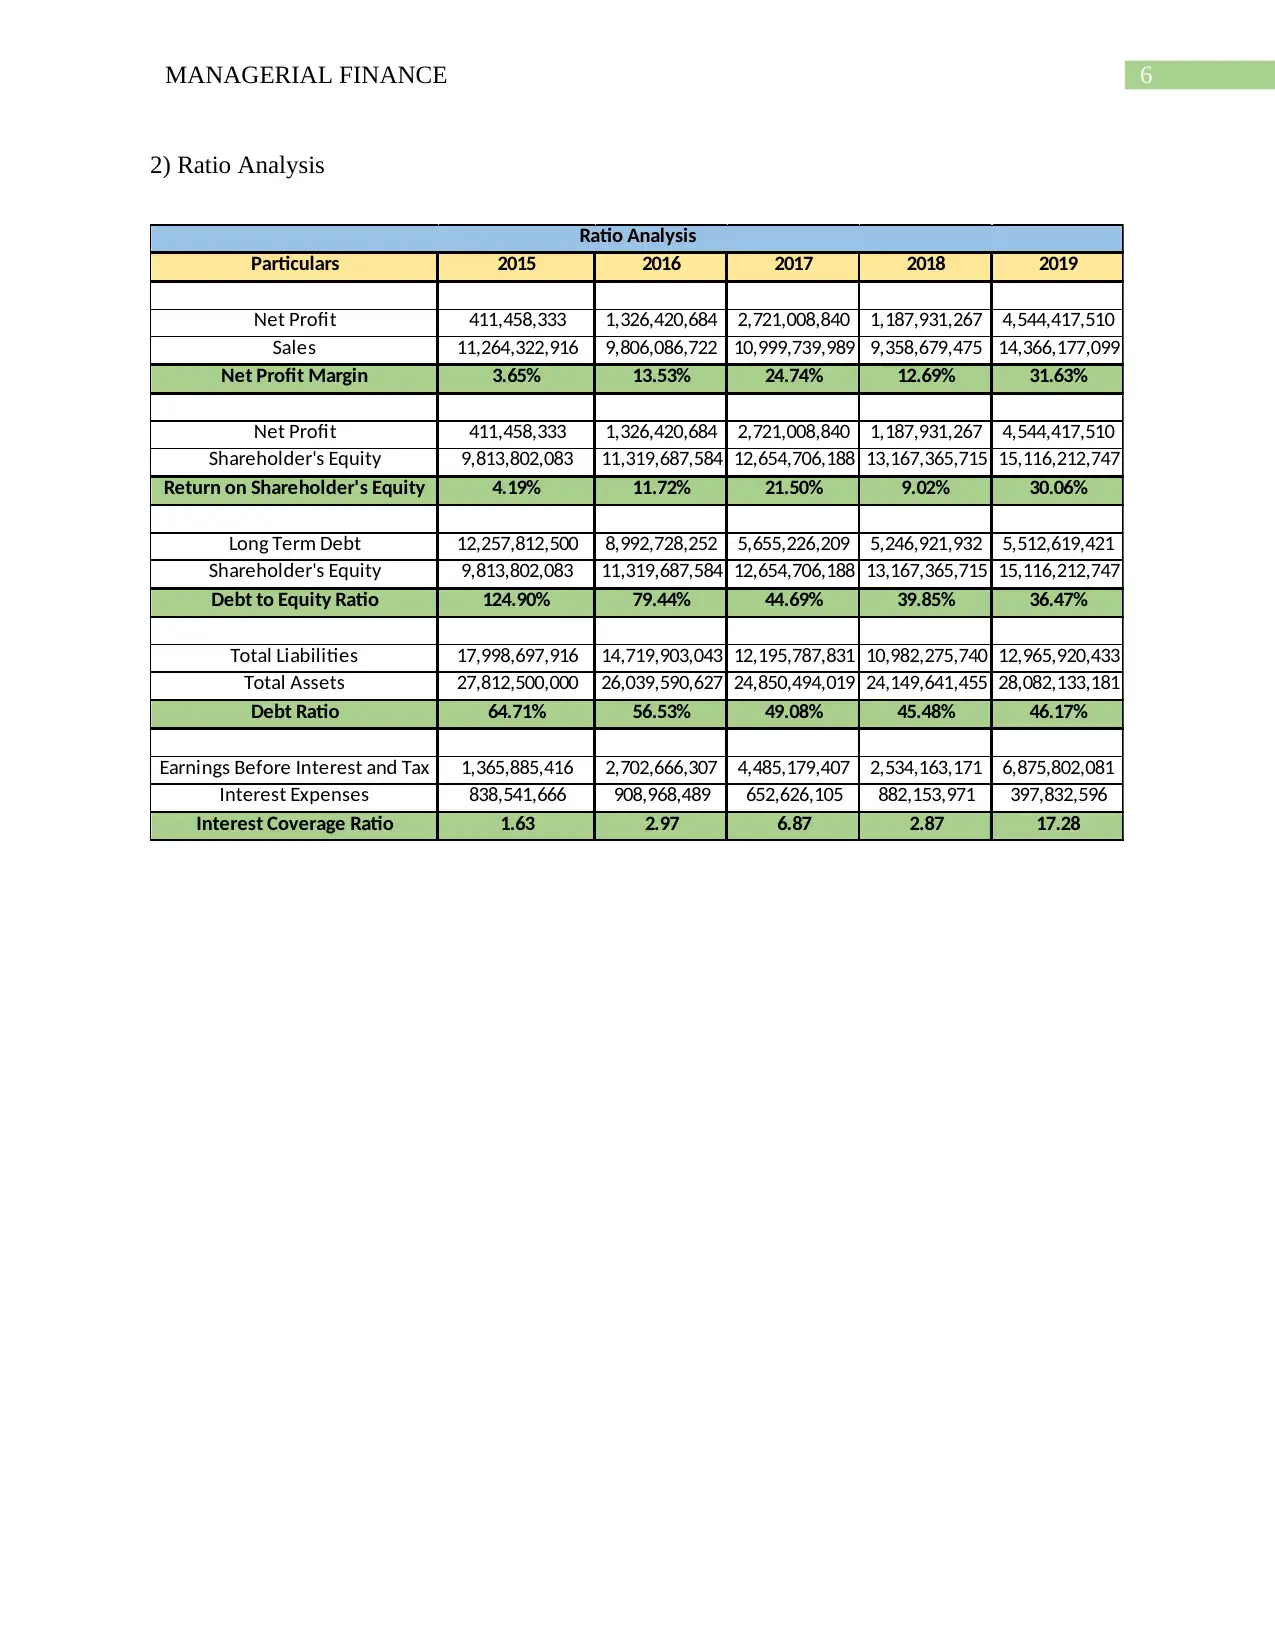
This report provides a managerial finance analysis of Fortescue Metals Group, examining its financial performance and strategies for maximizing shareholder value. The report assesses the company's return on shareholder's equity, highlighting its increase from 4.19% in 2015 to 30.06% in 2019, and the rise in net profit margin from 3.65% to 31.63% during the same period. The report also evaluates the company's short-term and long-term returns, including a five-year trend analysis and an intrinsic value assessment using the dividend growth model. Furthermore, it includes ratio analysis and share valuation, providing insights into the company's potential upside and investment opportunities. The report is based on data from Bloomberg, Yahoo Finance, and other data analysis sources.
Document Page
Running head: MANAGERIAL FINANCE
Managerial Finance
Name of the Student:
Name of the University:
Author’s Note:
tabler-icon-diamond-filled.svg

Paraphrase This Document

Need a fresh take? Get an instant paraphrase of this document with our AI Paraphraser
Document Page
1MANAGERIAL FINANCE
Table of Contents
Report Overview..............................................................................................................................2
References........................................................................................................................................4
Appendix..........................................................................................................................................5
Document Page
2MANAGERIAL FINANCE
Report Overview
The investment valuation report has been specifically prepared for the Fortescue Metal
group whereby analysis of the company in the field of techniques and methods used by the
company for the purpose of maximizing the value of the shareholder’s has been well written
down (Bloomberg, 2020). The effectiveness shown by the management of the Fortescue Metal
Group can be well evaluated with the help of the return on shareholder’s equity that the company
would be generating in time period analyzed. The return on shareholder’s equity has been around
4.19% in the year 2015, which has well increased to the tune of 30.06% in the year 2019. The
increase in the return has been particularly due to the increased level of net profit that has been
reported by the company for the time period analyzed. On the other hand, the increase in the net
profit margin for the company has been from 3.65% to around 31.63% in the year 2015-2019
(Yahoo Finance, 2020). From the short-term perspective the return that the investors can expect
from the company has been determined with the help of the return that the company has provided
in the five year trend period which was around 39%. On the other hand the long term return that
is in the form of ROE generated by the company has been around 30% and the return that the
investor can well achieve in the long-term horizon is in buying the shares of the company which
had an intrinsic value of around $16.89 and the market value was around $11.29 showing an
upside potential of about 49.61% (Data Analysis, 2020). The historical share price and the
volume analysis of the shares movement has been done for the company for a sum of five years
as shown below:
Document Page
3MANAGERIAL FINANCE
2/1/2015
5/1/2015
8/1/2015
11/1/2015
2/1/2016
5/1/2016
8/1/2016
11/1/2016
2/1/2017
5/1/2017
8/1/2017
11/1/2017
2/1/2018
5/1/2018
8/1/2018
11/1/2018
2/1/2019
5/1/2019
8/1/2019
11/1/2019
0
100000000
200000000
300000000
400000000
500000000
600000000
700000000
Fortescue Metal Volume Data
2/1/2015
5/1/2015
8/1/2015
11/1/2015
2/1/2016
5/1/2016
8/1/2016
11/1/2016
2/1/2017
5/1/2017
8/1/2017
11/1/2017
2/1/2018
5/1/2018
8/1/2018
11/1/2018
2/1/2019
5/1/2019
8/1/2019
11/1/2019
0.00
2.00
4.00
6.00
8.00
10.00
12.00
14.00
Fortescue Share Price Data
tabler-icon-diamond-filled.svg

Paraphrase This Document

Need a fresh take? Get an instant paraphrase of this document with our AI Paraphraser
Document Page
4MANAGERIAL FINANCE
References
Bloomberg (2020). Retrieved 30 January 2020, from https://www.bloomberg.com/markets/rates-
bonds/government-bonds/australia
Data Analysis. (2020). Retrieved 30 January 2020, from https://datanalysis-morningstar-com-
au.eu1.proxy.openathens.net/af/company/dividendhistory?ASXCode=FMG&xtm-
licensee=datpremium
Yahoo Finance. (2020). Retrieved 30 January 2020, from
https://au.finance.yahoo.com/quote/FMG.AX/history?p=FMG.AX&.tsrc=fin-srch
Document Page
5MANAGERIAL FINANCE
Appendix
1) Share Valuation using Dividend Growth Model
Share Valuation of Fortescue Metal Group
Required Rate of Return Dividend Discount Model
Particulars Value Dividend (Do) 0.84
Risk Free Rate 1.16% Growth Rate 3.86%
Market Return 4.41% Expected Dividend (D1) 0.87
Beta 1.1879996 Required Return (Re) 9.02%
Required Return (Re) 5.02% Growth Rate (g) 3.86%
Required Return: Rf+Beta*(Rm-Rf)
Intrinsic Price (Po) 16.89
Growth Rate: Retention Rate*ROE Current Value 11.29
Retention Ratio Formula: Po: D1/(Re-g)
Dividend Per Share 0.84
Earnings Per Share 1.47 Upisde Potential
49.61
%
Retention Ratio 42.75%
Share Return
39.57
%
Return on Equity 9.02%
Growth Rate 3.86%
Document Page
6MANAGERIAL FINANCE
2) Ratio Analysis
Particulars 2015 2016 2017 2018 2019
Net Profit 411,458,333 1,326,420,684 2,721,008,840 1,187,931,267 4,544,417,510
Sales 11,264,322,916 9,806,086,722 10,999,739,989 9,358,679,475 14,366,177,099
Net Profit Margin 3.65% 13.53% 24.74% 12.69% 31.63%
Net Profit 411,458,333 1,326,420,684 2,721,008,840 1,187,931,267 4,544,417,510
Shareholder's Equity 9,813,802,083 11,319,687,584 12,654,706,188 13,167,365,715 15,116,212,747
Return on Shareholder's Equity 4.19% 11.72% 21.50% 9.02% 30.06%
Long Term Debt 12,257,812,500 8,992,728,252 5,655,226,209 5,246,921,932 5,512,619,421
Shareholder's Equity 9,813,802,083 11,319,687,584 12,654,706,188 13,167,365,715 15,116,212,747
Debt to Equity Ratio 124.90% 79.44% 44.69% 39.85% 36.47%
Total Liabilities 17,998,697,916 14,719,903,043 12,195,787,831 10,982,275,740 12,965,920,433
Total Assets 27,812,500,000 26,039,590,627 24,850,494,019 24,149,641,455 28,082,133,181
Debt Ratio 64.71% 56.53% 49.08% 45.48% 46.17%
Earnings Before Interest and Tax 1,365,885,416 2,702,666,307 4,485,179,407 2,534,163,171 6,875,802,081
Interest Expenses 838,541,666 908,968,489 652,626,105 882,153,971 397,832,596
Interest Coverage Ratio 1.63 2.97 6.87 2.87 17.28
Ratio Analysis
chevron_up_icon
1 out of 7
circle_padding
hide_on_mobile
zoom_out_icon
[object Object]