FINC20018 Managerial Finance Assignment: Financial Statement Analysis
VerifiedAdded on 2023/06/10
|14
|2677
|498
Report
AI Summary
This managerial finance report provides a comprehensive analysis of various business organizations, highlighting their advantages and disadvantages. It includes a detailed financial evaluation of Wesfarmers, examining its stock performance, dividend policy, and ethical considerations. The report also covers the preparation and interpretation of financial statements like the balance sheet and income statement, along with an analysis of net working capital and liquidity levels. Furthermore, profitability ratios such as net margin, operating margin, return on assets, and return on equity are calculated and interpreted for Allen Corporation. Finally, the report includes calculations for future cash flows and time value of money scenarios, demonstrating the impact of interest rates on investment growth. Desklib offers a wealth of similar solved assignments and past papers for students.
Running Head: Managerial Finance
1
Project Report: Managerial Finance
1
Project Report: Managerial Finance
Paraphrase This Document
Need a fresh take? Get an instant paraphrase of this document with our AI Paraphraser
Managerial Finance
2
Contents
Question 1.........................................................................................................................3
Question 2.........................................................................................................................3
Question 3.........................................................................................................................5
Question 4.........................................................................................................................6
Question 5.........................................................................................................................6
Question 6.........................................................................................................................6
Question 7.........................................................................................................................6
Question 8.........................................................................................................................7
References.........................................................................................................................8
Appendix.........................................................................................................................10
Managerial Finance
3
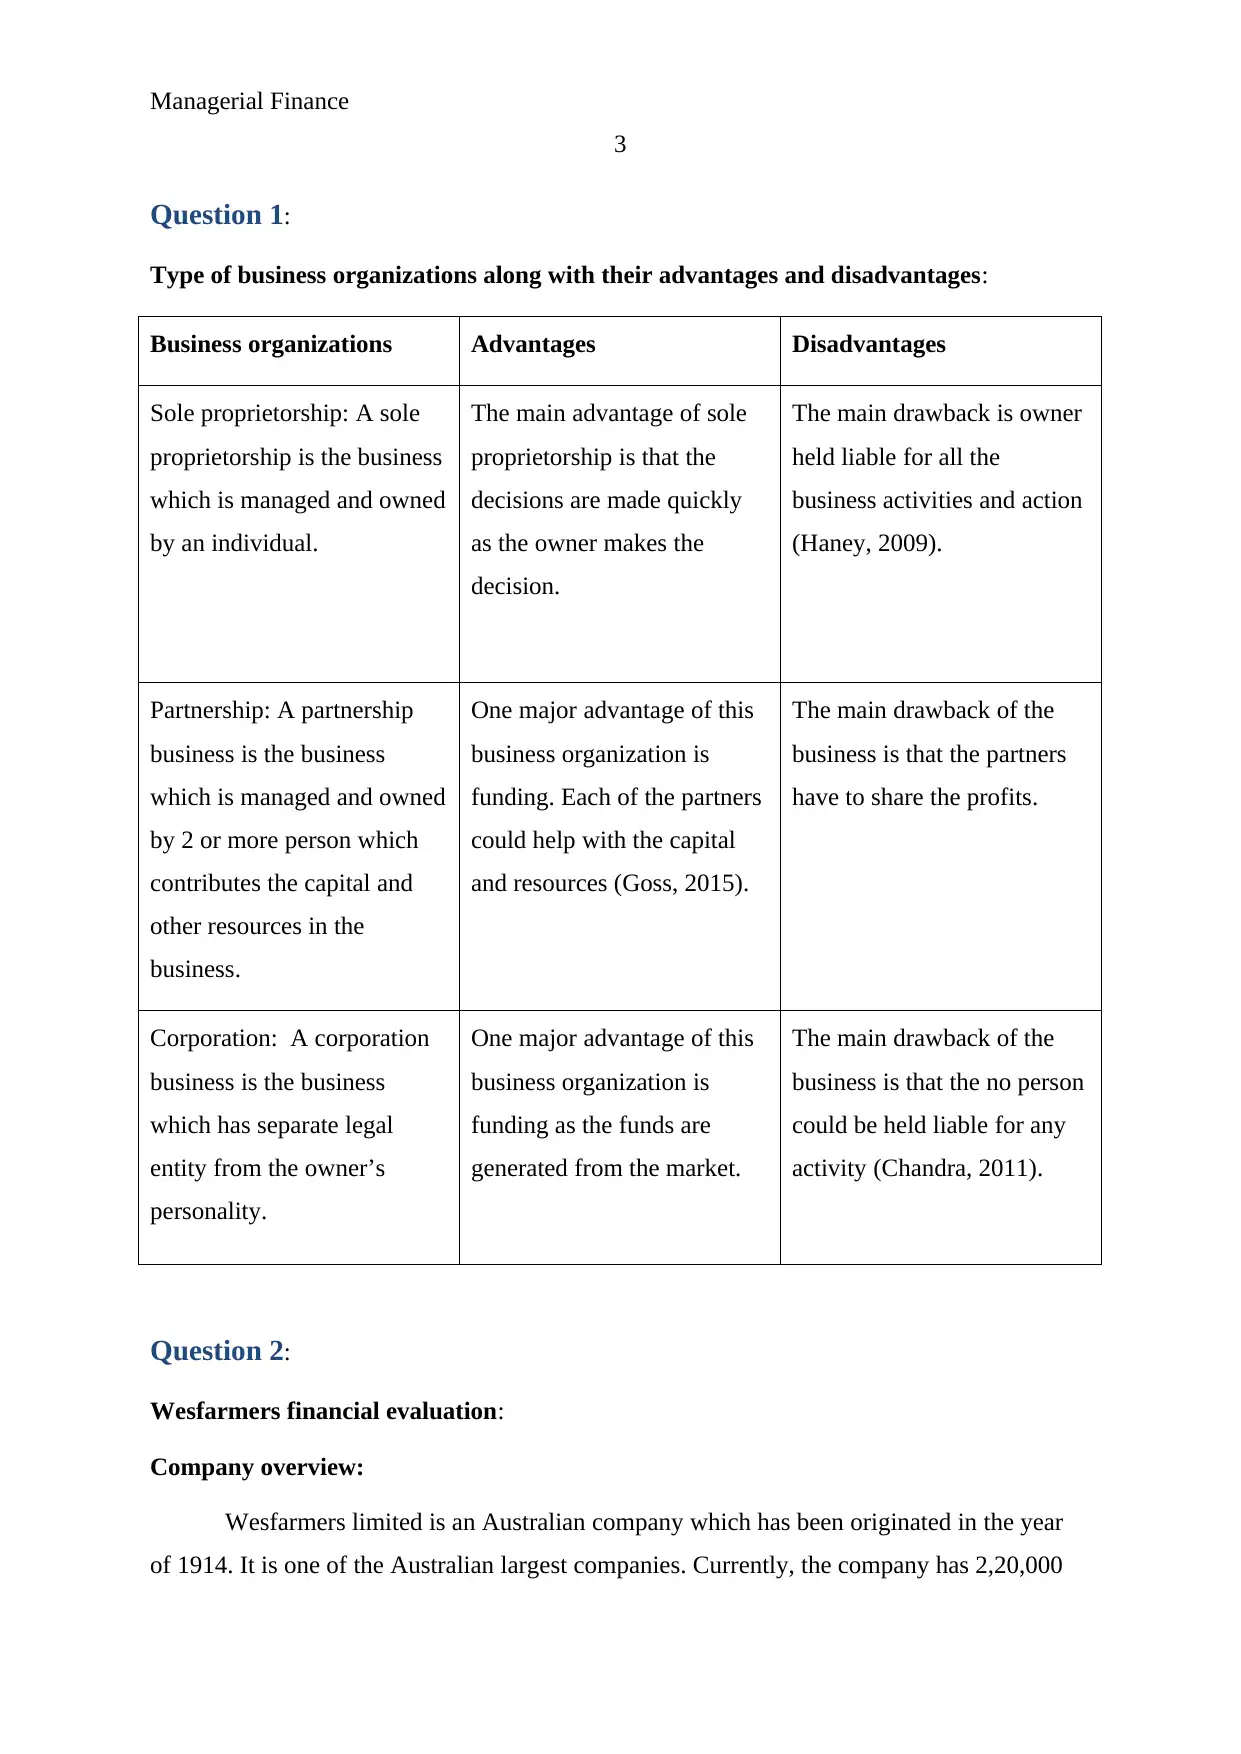
Question 1:
Type of business organizations along with their advantages and disadvantages:
Business organizations Advantages Disadvantages
Sole proprietorship: A sole
proprietorship is the business
which is managed and owned
by an individual.
The main advantage of sole
proprietorship is that the
decisions are made quickly
as the owner makes the
decision.
The main drawback is owner
held liable for all the
business activities and action
(Haney, 2009).
Partnership: A partnership
business is the business
which is managed and owned
by 2 or more person which
contributes the capital and
other resources in the
business.
One major advantage of this
business organization is
funding. Each of the partners
could help with the capital
and resources (Goss, 2015).
The main drawback of the
business is that the partners
have to share the profits.
Corporation: A corporation
business is the business
which has separate legal
entity from the owner’s
personality.
One major advantage of this
business organization is
funding as the funds are
generated from the market.
The main drawback of the
business is that the no person
could be held liable for any
activity (Chandra, 2011).
Question 2:
Wesfarmers financial evaluation:
Company overview:
Wesfarmers limited is an Australian company which has been originated in the year
of 1914. It is one of the Australian largest companies. Currently, the company has 2,20,000
3
Question 1:
Type of business organizations along with their advantages and disadvantages:
Business organizations Advantages Disadvantages
Sole proprietorship: A sole
proprietorship is the business
which is managed and owned
by an individual.
The main advantage of sole
proprietorship is that the
decisions are made quickly
as the owner makes the
decision.
The main drawback is owner
held liable for all the
business activities and action
(Haney, 2009).
Partnership: A partnership
business is the business
which is managed and owned
by 2 or more person which
contributes the capital and
other resources in the
business.
One major advantage of this
business organization is
funding. Each of the partners
could help with the capital
and resources (Goss, 2015).
The main drawback of the
business is that the partners
have to share the profits.
Corporation: A corporation
business is the business
which has separate legal
entity from the owner’s
personality.
One major advantage of this
business organization is
funding as the funds are
generated from the market.
The main drawback of the
business is that the no person
could be held liable for any
activity (Chandra, 2011).
Question 2:
Wesfarmers financial evaluation:
Company overview:
Wesfarmers limited is an Australian company which has been originated in the year
of 1914. It is one of the Australian largest companies. Currently, the company has 2,20,000
⊘ This is a preview!⊘
Do you want full access?
Subscribe today to unlock all pages.
Trusted by 1+ million students worldwide
Managerial Finance
4
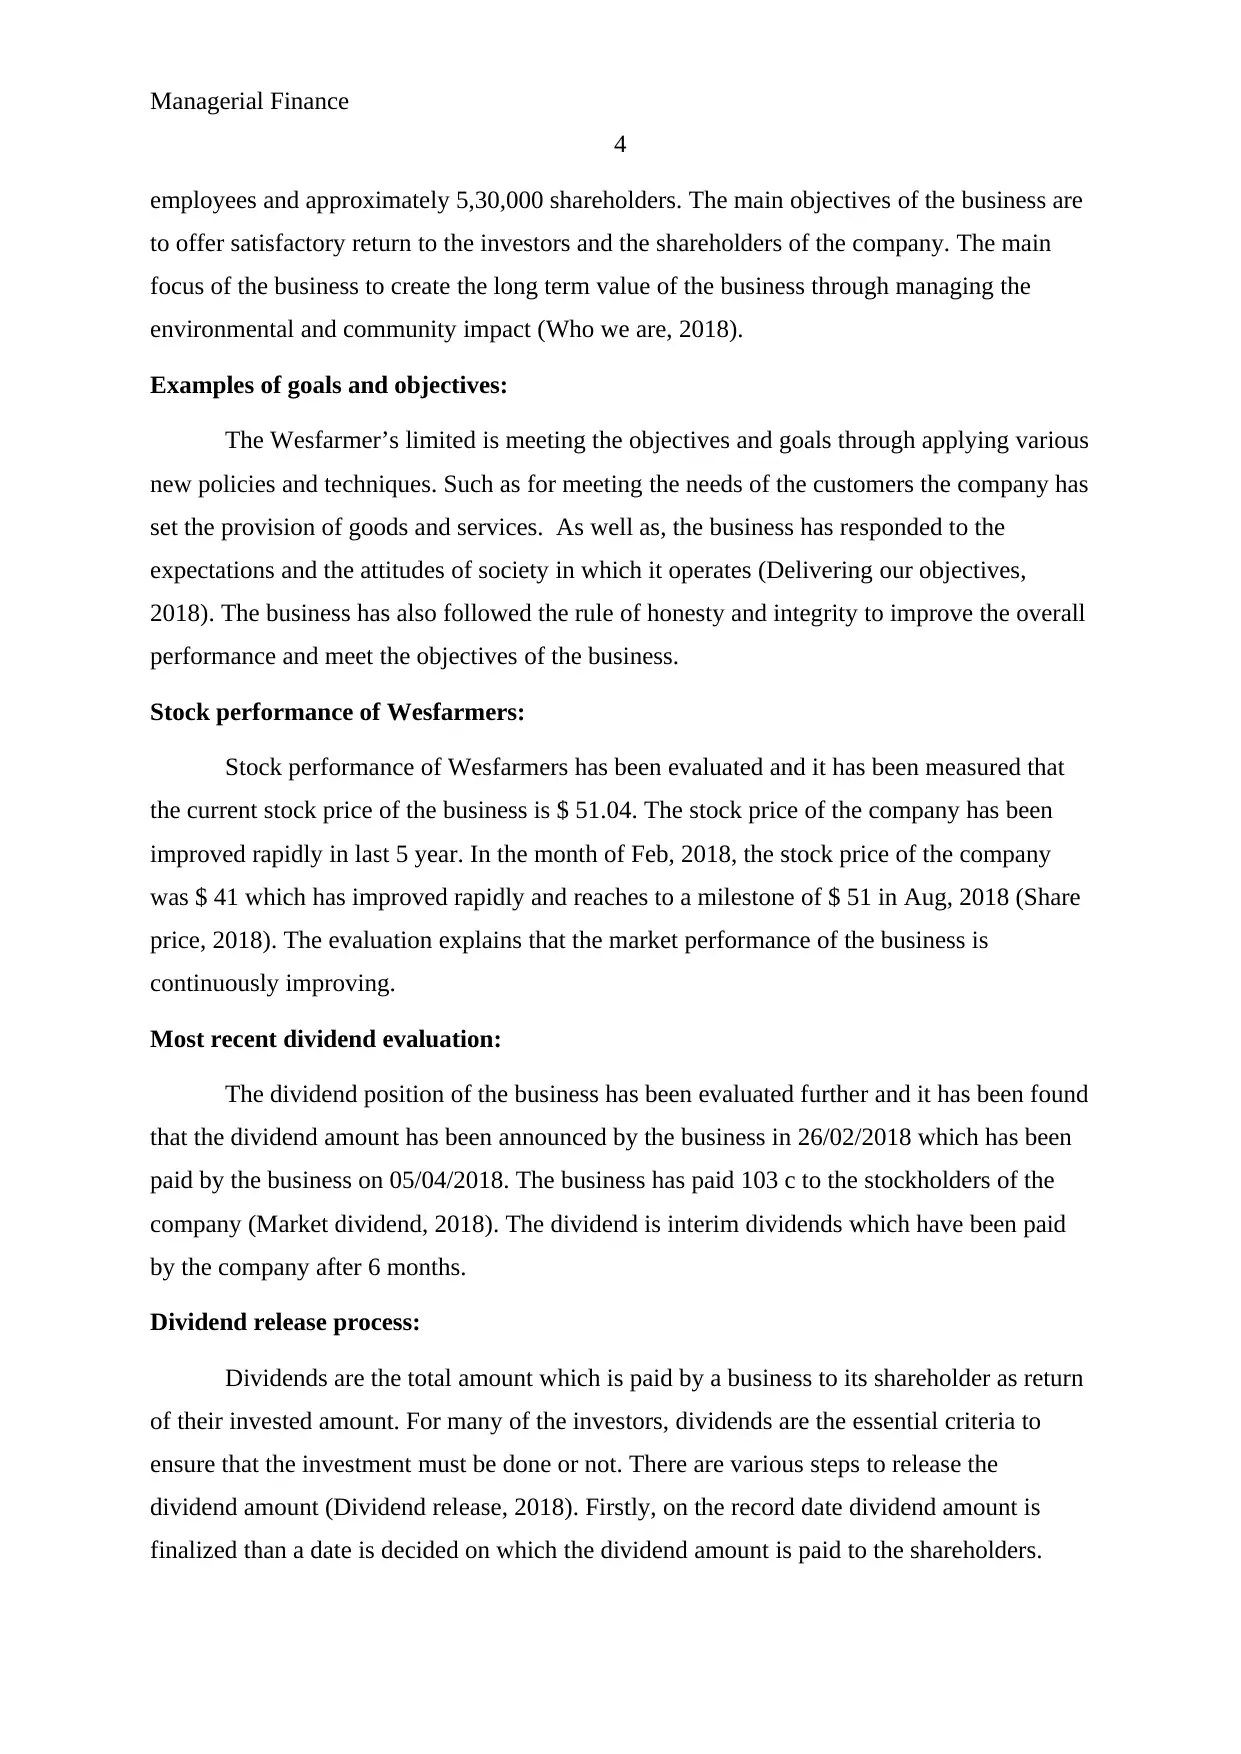
employees and approximately 5,30,000 shareholders. The main objectives of the business are
to offer satisfactory return to the investors and the shareholders of the company. The main
focus of the business to create the long term value of the business through managing the
environmental and community impact (Who we are, 2018).
Examples of goals and objectives:
The Wesfarmer’s limited is meeting the objectives and goals through applying various
new policies and techniques. Such as for meeting the needs of the customers the company has
set the provision of goods and services. As well as, the business has responded to the
expectations and the attitudes of society in which it operates (Delivering our objectives,
2018). The business has also followed the rule of honesty and integrity to improve the overall
performance and meet the objectives of the business.
Stock performance of Wesfarmers:
Stock performance of Wesfarmers has been evaluated and it has been measured that
the current stock price of the business is $ 51.04. The stock price of the company has been
improved rapidly in last 5 year. In the month of Feb, 2018, the stock price of the company
was $ 41 which has improved rapidly and reaches to a milestone of $ 51 in Aug, 2018 (Share
price, 2018). The evaluation explains that the market performance of the business is
continuously improving.
Most recent dividend evaluation:
The dividend position of the business has been evaluated further and it has been found
that the dividend amount has been announced by the business in 26/02/2018 which has been
paid by the business on 05/04/2018. The business has paid 103 c to the stockholders of the
company (Market dividend, 2018). The dividend is interim dividends which have been paid
by the company after 6 months.
Dividend release process:
Dividends are the total amount which is paid by a business to its shareholder as return
of their invested amount. For many of the investors, dividends are the essential criteria to
ensure that the investment must be done or not. There are various steps to release the
dividend amount (Dividend release, 2018). Firstly, on the record date dividend amount is
finalized than a date is decided on which the dividend amount is paid to the shareholders.
4
employees and approximately 5,30,000 shareholders. The main objectives of the business are
to offer satisfactory return to the investors and the shareholders of the company. The main
focus of the business to create the long term value of the business through managing the
environmental and community impact (Who we are, 2018).
Examples of goals and objectives:
The Wesfarmer’s limited is meeting the objectives and goals through applying various
new policies and techniques. Such as for meeting the needs of the customers the company has
set the provision of goods and services. As well as, the business has responded to the
expectations and the attitudes of society in which it operates (Delivering our objectives,
2018). The business has also followed the rule of honesty and integrity to improve the overall
performance and meet the objectives of the business.
Stock performance of Wesfarmers:
Stock performance of Wesfarmers has been evaluated and it has been measured that
the current stock price of the business is $ 51.04. The stock price of the company has been
improved rapidly in last 5 year. In the month of Feb, 2018, the stock price of the company
was $ 41 which has improved rapidly and reaches to a milestone of $ 51 in Aug, 2018 (Share
price, 2018). The evaluation explains that the market performance of the business is
continuously improving.
Most recent dividend evaluation:
The dividend position of the business has been evaluated further and it has been found
that the dividend amount has been announced by the business in 26/02/2018 which has been
paid by the business on 05/04/2018. The business has paid 103 c to the stockholders of the
company (Market dividend, 2018). The dividend is interim dividends which have been paid
by the company after 6 months.
Dividend release process:
Dividends are the total amount which is paid by a business to its shareholder as return
of their invested amount. For many of the investors, dividends are the essential criteria to
ensure that the investment must be done or not. There are various steps to release the
dividend amount (Dividend release, 2018). Firstly, on the record date dividend amount is
finalized than a date is decided on which the dividend amount is paid to the shareholders.
Paraphrase This Document
Need a fresh take? Get an instant paraphrase of this document with our AI Paraphraser
Managerial Finance
5
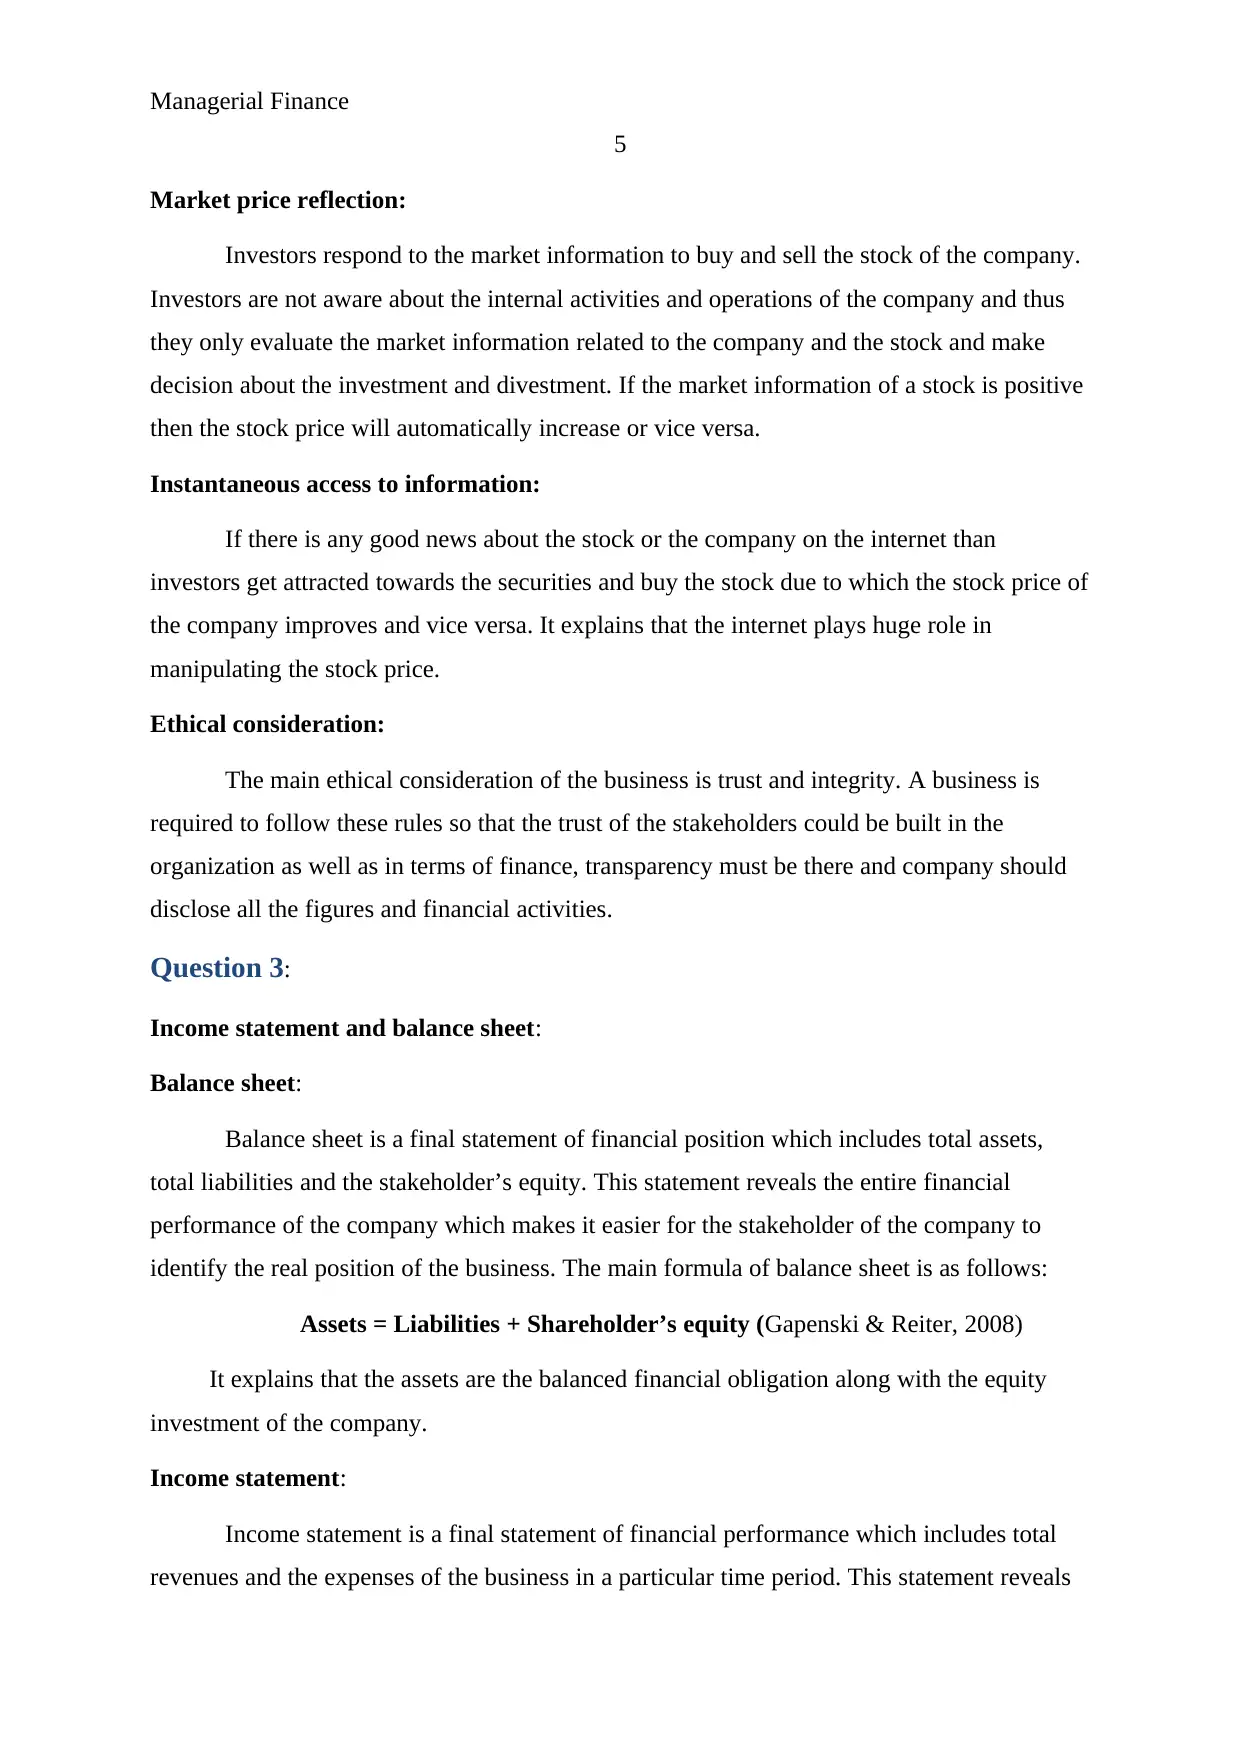
Market price reflection:
Investors respond to the market information to buy and sell the stock of the company.
Investors are not aware about the internal activities and operations of the company and thus
they only evaluate the market information related to the company and the stock and make
decision about the investment and divestment. If the market information of a stock is positive
then the stock price will automatically increase or vice versa.
Instantaneous access to information:
If there is any good news about the stock or the company on the internet than
investors get attracted towards the securities and buy the stock due to which the stock price of
the company improves and vice versa. It explains that the internet plays huge role in
manipulating the stock price.
Ethical consideration:
The main ethical consideration of the business is trust and integrity. A business is
required to follow these rules so that the trust of the stakeholders could be built in the
organization as well as in terms of finance, transparency must be there and company should
disclose all the figures and financial activities.
Question 3:
Income statement and balance sheet:
Balance sheet:
Balance sheet is a final statement of financial position which includes total assets,
total liabilities and the stakeholder’s equity. This statement reveals the entire financial
performance of the company which makes it easier for the stakeholder of the company to
identify the real position of the business. The main formula of balance sheet is as follows:
Assets = Liabilities + Shareholder’s equity (Gapenski & Reiter, 2008)
It explains that the assets are the balanced financial obligation along with the equity
investment of the company.
Income statement:
Income statement is a final statement of financial performance which includes total
revenues and the expenses of the business in a particular time period. This statement reveals
5
Market price reflection:
Investors respond to the market information to buy and sell the stock of the company.
Investors are not aware about the internal activities and operations of the company and thus
they only evaluate the market information related to the company and the stock and make
decision about the investment and divestment. If the market information of a stock is positive
then the stock price will automatically increase or vice versa.
Instantaneous access to information:
If there is any good news about the stock or the company on the internet than
investors get attracted towards the securities and buy the stock due to which the stock price of
the company improves and vice versa. It explains that the internet plays huge role in
manipulating the stock price.
Ethical consideration:
The main ethical consideration of the business is trust and integrity. A business is
required to follow these rules so that the trust of the stakeholders could be built in the
organization as well as in terms of finance, transparency must be there and company should
disclose all the figures and financial activities.
Question 3:
Income statement and balance sheet:
Balance sheet:
Balance sheet is a final statement of financial position which includes total assets,
total liabilities and the stakeholder’s equity. This statement reveals the entire financial
performance of the company which makes it easier for the stakeholder of the company to
identify the real position of the business. The main formula of balance sheet is as follows:
Assets = Liabilities + Shareholder’s equity (Gapenski & Reiter, 2008)
It explains that the assets are the balanced financial obligation along with the equity
investment of the company.
Income statement:
Income statement is a final statement of financial performance which includes total
revenues and the expenses of the business in a particular time period. This statement reveals
Managerial Finance
6
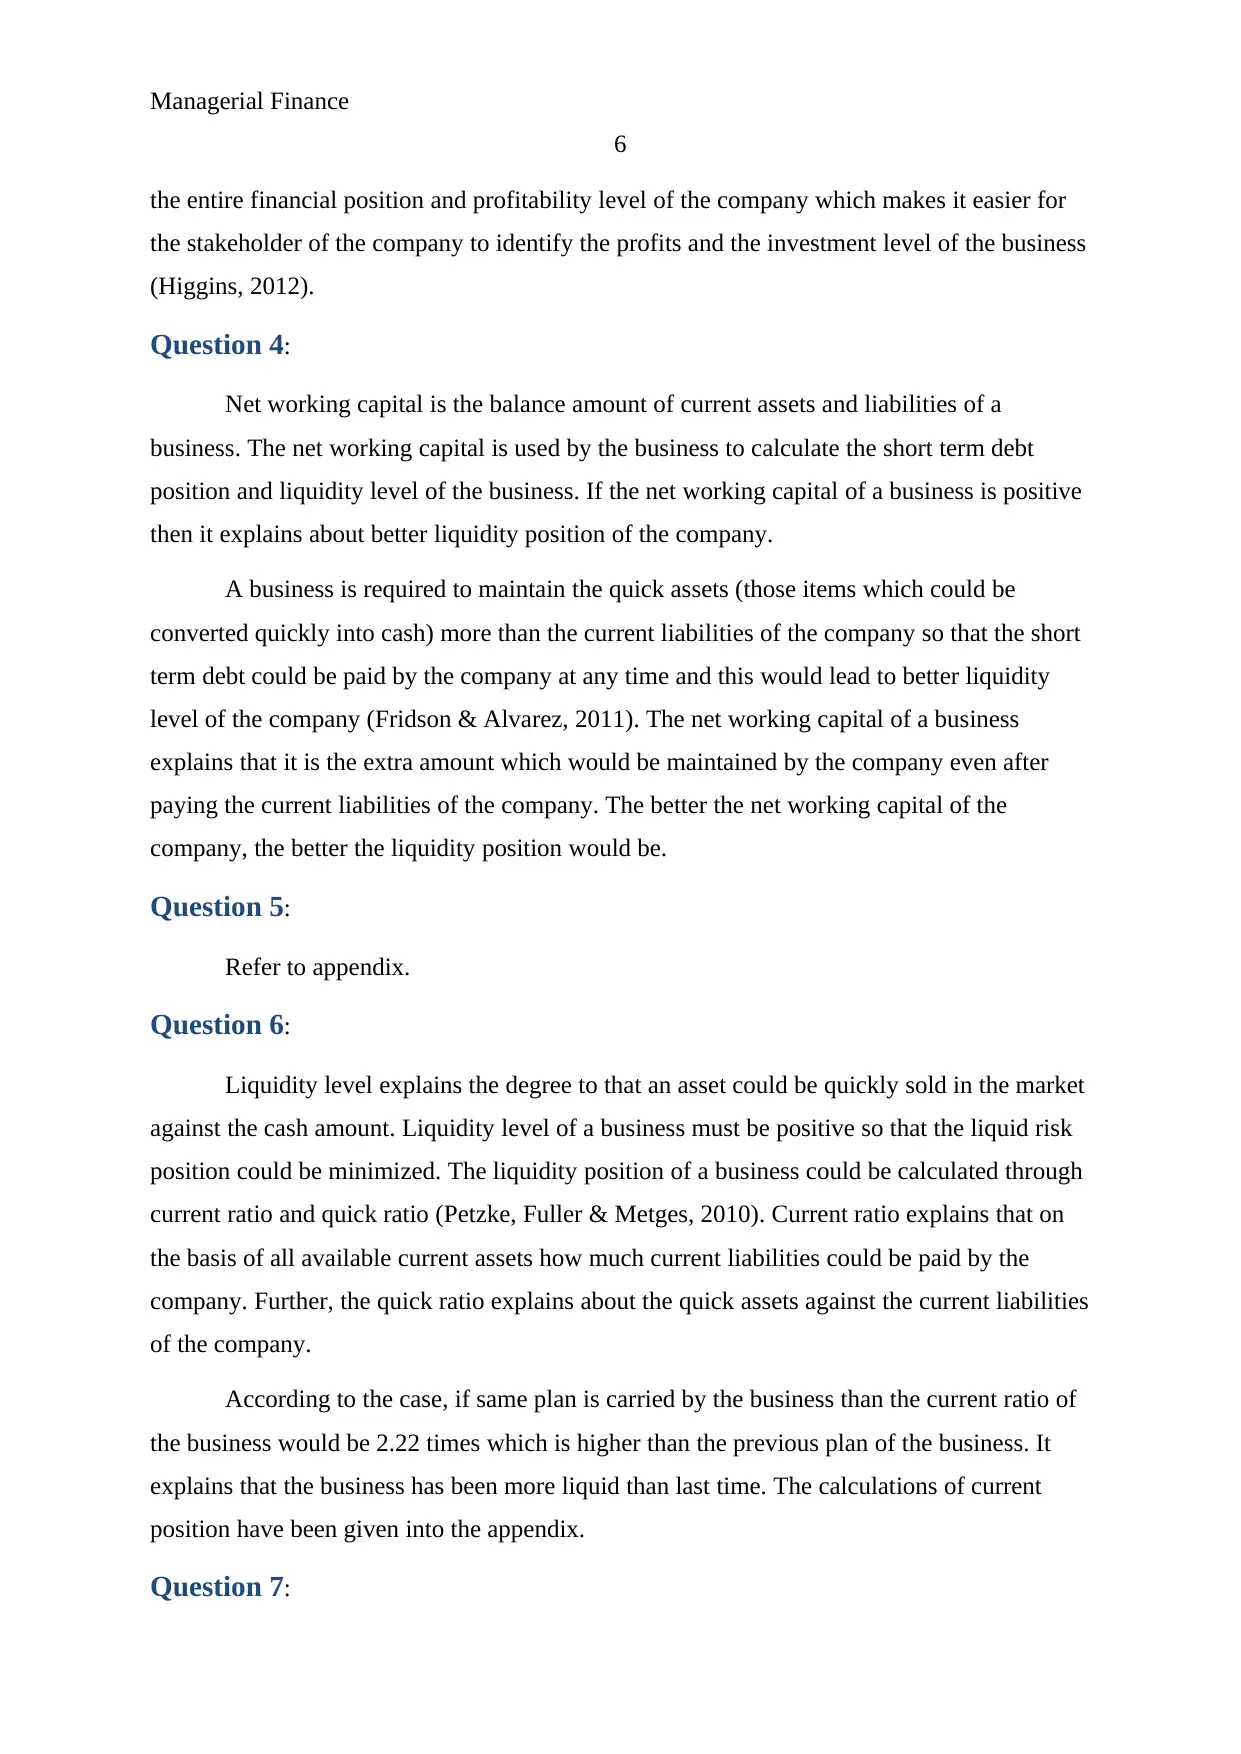
the entire financial position and profitability level of the company which makes it easier for
the stakeholder of the company to identify the profits and the investment level of the business
(Higgins, 2012).
Question 4:
Net working capital is the balance amount of current assets and liabilities of a
business. The net working capital is used by the business to calculate the short term debt
position and liquidity level of the business. If the net working capital of a business is positive
then it explains about better liquidity position of the company.
A business is required to maintain the quick assets (those items which could be
converted quickly into cash) more than the current liabilities of the company so that the short
term debt could be paid by the company at any time and this would lead to better liquidity
level of the company (Fridson & Alvarez, 2011). The net working capital of a business
explains that it is the extra amount which would be maintained by the company even after
paying the current liabilities of the company. The better the net working capital of the
company, the better the liquidity position would be.
Question 5:
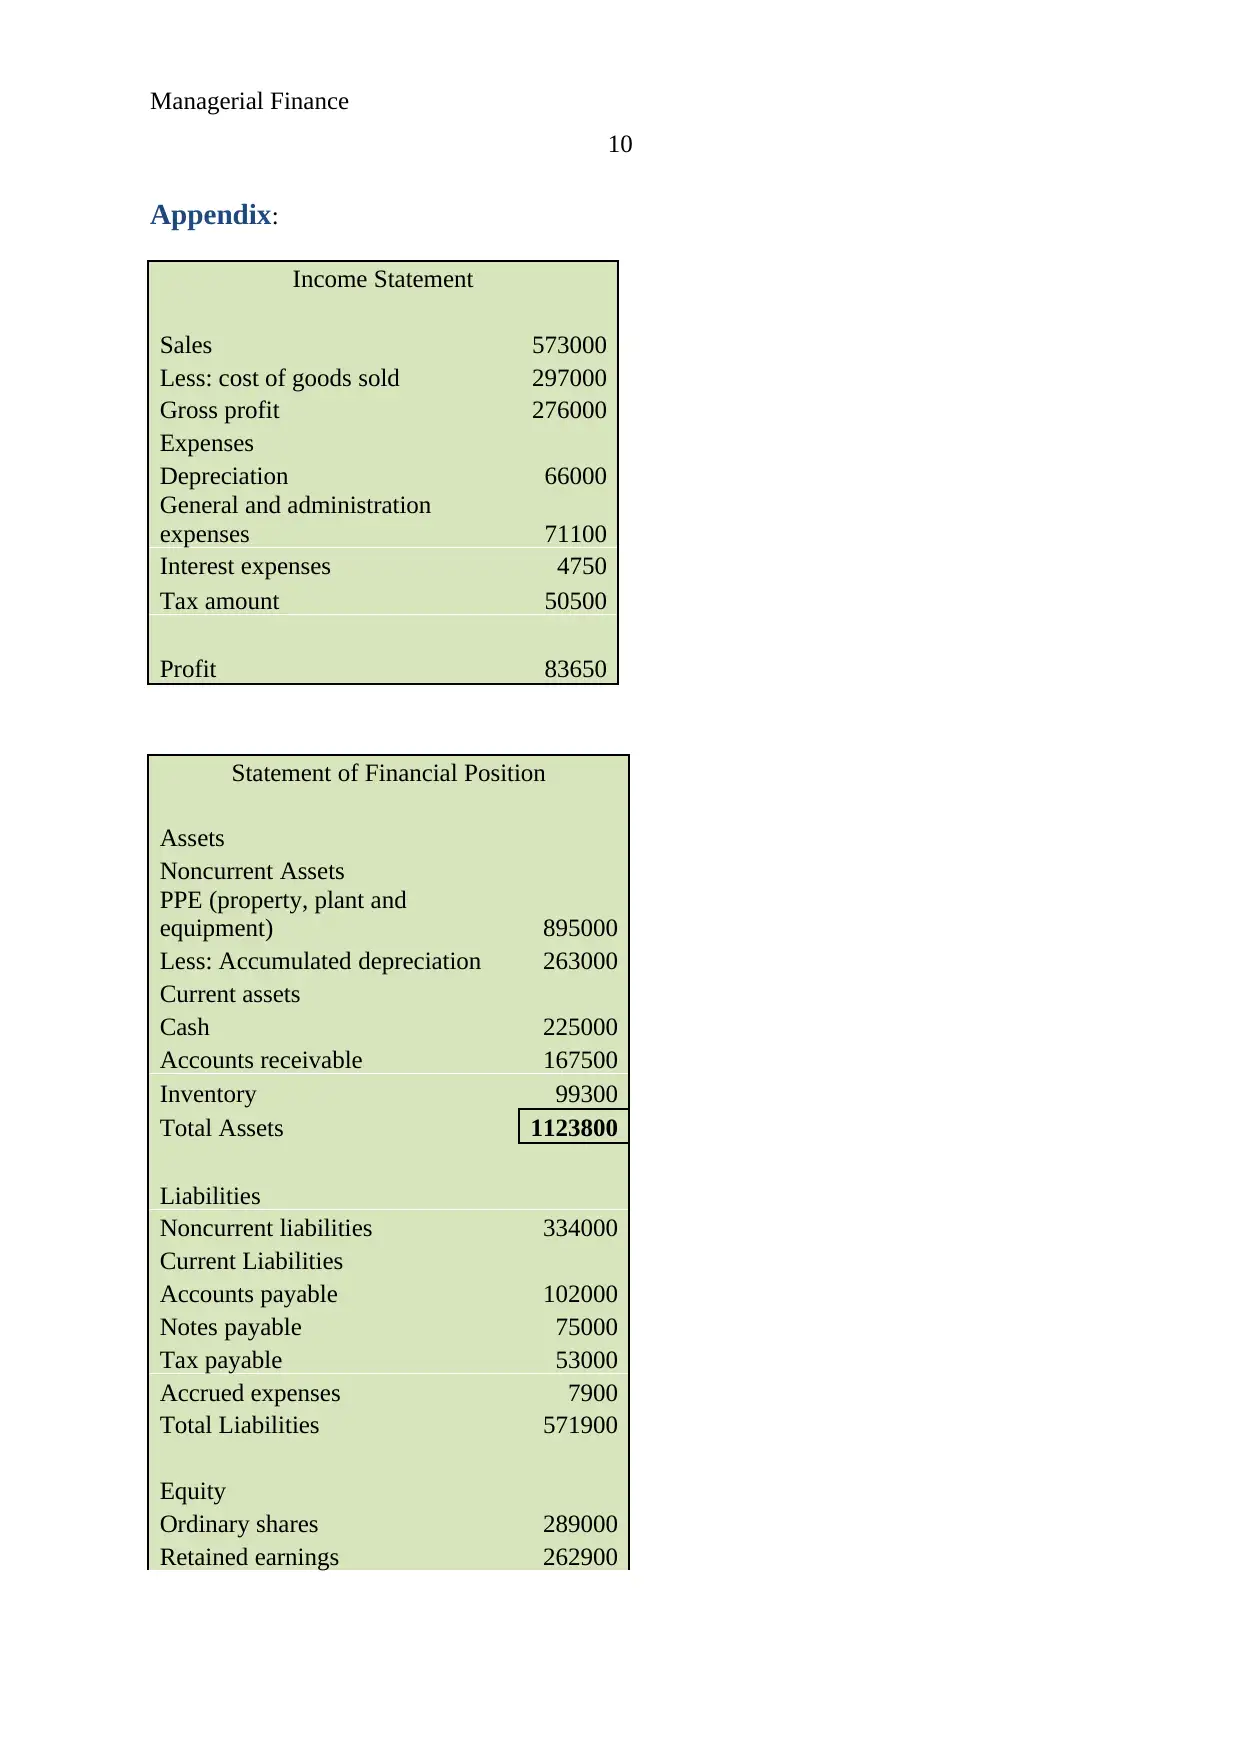
Refer to appendix.
Question 6:
Liquidity level explains the degree to that an asset could be quickly sold in the market
against the cash amount. Liquidity level of a business must be positive so that the liquid risk
position could be minimized. The liquidity position of a business could be calculated through
current ratio and quick ratio (Petzke, Fuller & Metges, 2010). Current ratio explains that on
the basis of all available current assets how much current liabilities could be paid by the
company. Further, the quick ratio explains about the quick assets against the current liabilities
of the company.
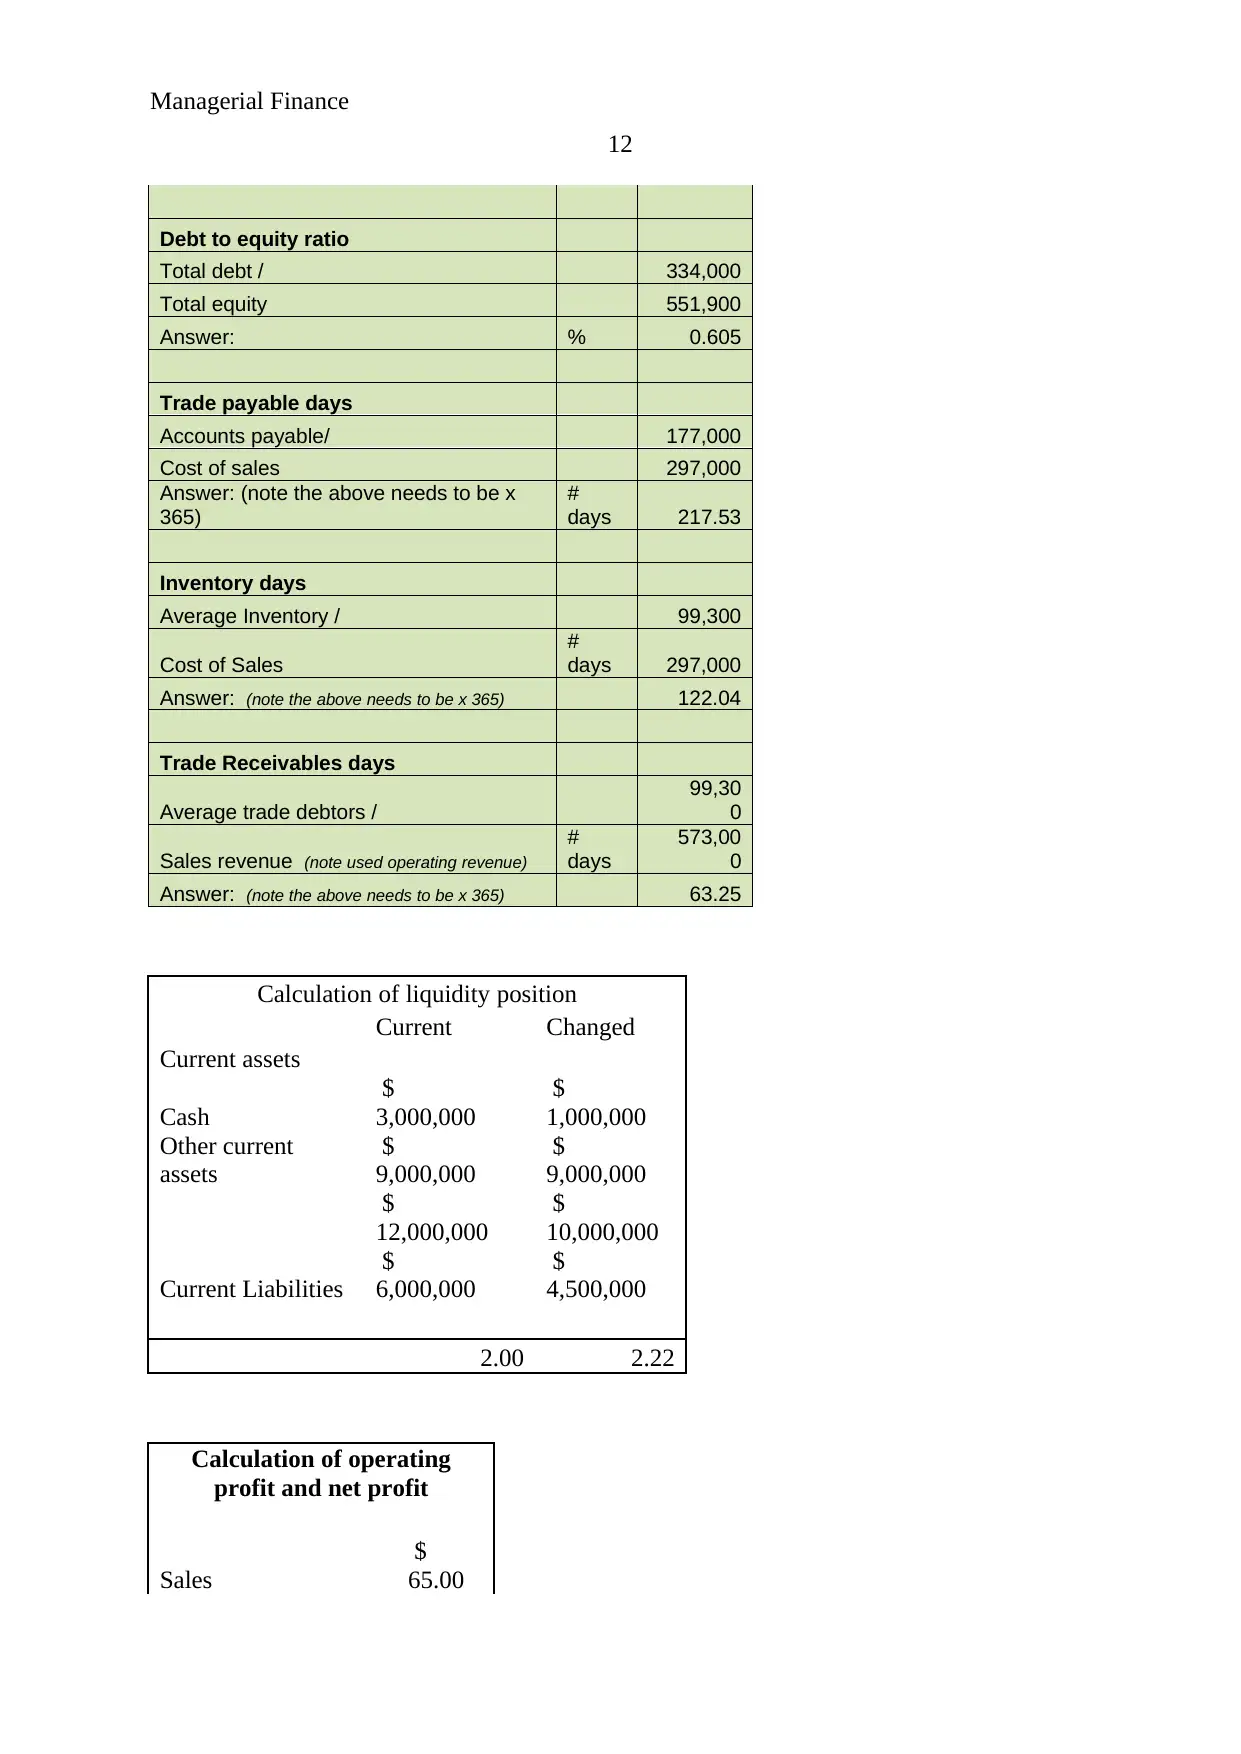
According to the case, if same plan is carried by the business than the current ratio of
the business would be 2.22 times which is higher than the previous plan of the business. It
explains that the business has been more liquid than last time. The calculations of current
position have been given into the appendix.
Question 7:
6
the entire financial position and profitability level of the company which makes it easier for
the stakeholder of the company to identify the profits and the investment level of the business
(Higgins, 2012).
Question 4:
Net working capital is the balance amount of current assets and liabilities of a
business. The net working capital is used by the business to calculate the short term debt
position and liquidity level of the business. If the net working capital of a business is positive
then it explains about better liquidity position of the company.
A business is required to maintain the quick assets (those items which could be
converted quickly into cash) more than the current liabilities of the company so that the short
term debt could be paid by the company at any time and this would lead to better liquidity
level of the company (Fridson & Alvarez, 2011). The net working capital of a business
explains that it is the extra amount which would be maintained by the company even after
paying the current liabilities of the company. The better the net working capital of the
company, the better the liquidity position would be.
Question 5:
Refer to appendix.
Question 6:
Liquidity level explains the degree to that an asset could be quickly sold in the market
against the cash amount. Liquidity level of a business must be positive so that the liquid risk
position could be minimized. The liquidity position of a business could be calculated through
current ratio and quick ratio (Petzke, Fuller & Metges, 2010). Current ratio explains that on
the basis of all available current assets how much current liabilities could be paid by the
company. Further, the quick ratio explains about the quick assets against the current liabilities
of the company.
According to the case, if same plan is carried by the business than the current ratio of
the business would be 2.22 times which is higher than the previous plan of the business. It
explains that the business has been more liquid than last time. The calculations of current
position have been given into the appendix.
Question 7:
⊘ This is a preview!⊘
Do you want full access?
Subscribe today to unlock all pages.
Trusted by 1+ million students worldwide
Managerial Finance
7
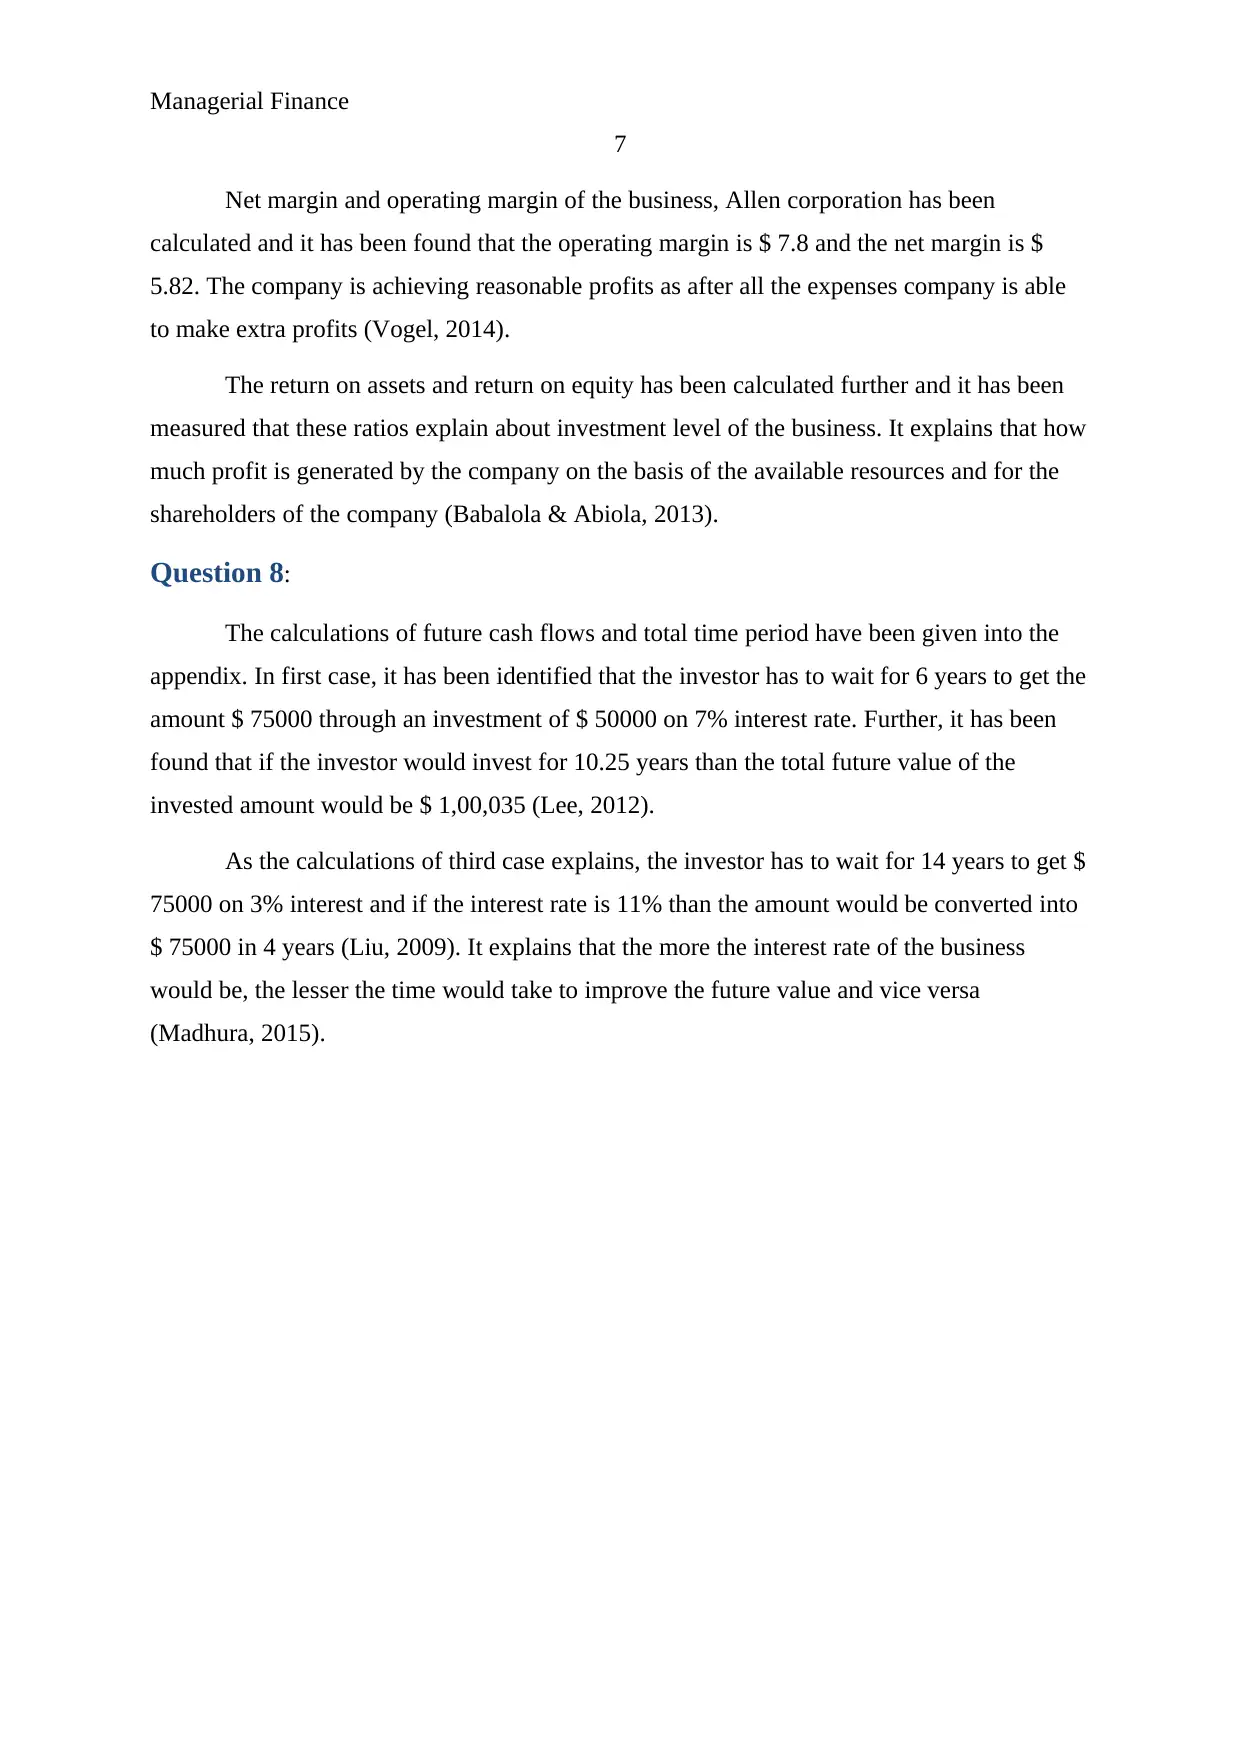
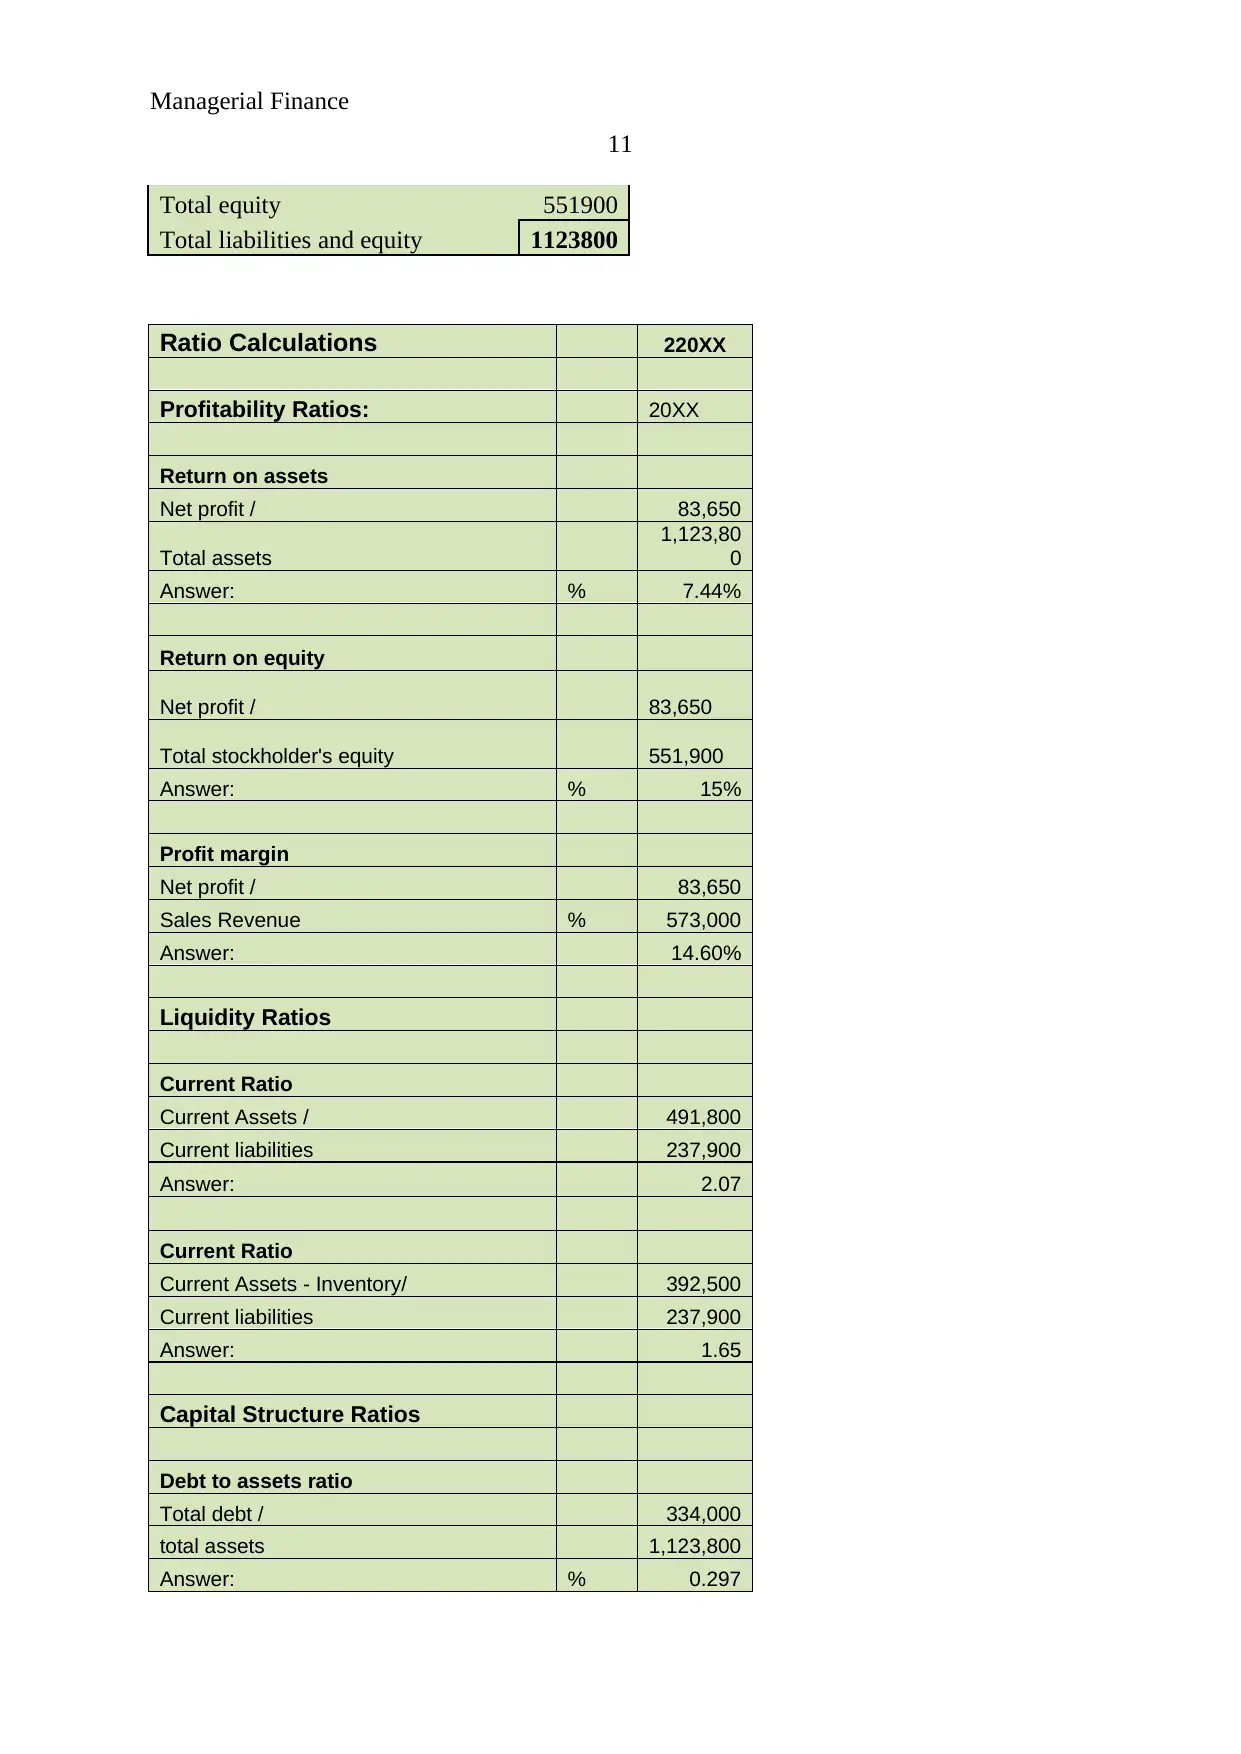
Net margin and operating margin of the business, Allen corporation has been
calculated and it has been found that the operating margin is $ 7.8 and the net margin is $
5.82. The company is achieving reasonable profits as after all the expenses company is able
to make extra profits (Vogel, 2014).
The return on assets and return on equity has been calculated further and it has been
measured that these ratios explain about investment level of the business. It explains that how
much profit is generated by the company on the basis of the available resources and for the
shareholders of the company (Babalola & Abiola, 2013).
Question 8:
The calculations of future cash flows and total time period have been given into the
appendix. In first case, it has been identified that the investor has to wait for 6 years to get the
amount $ 75000 through an investment of $ 50000 on 7% interest rate. Further, it has been
found that if the investor would invest for 10.25 years than the total future value of the
invested amount would be $ 1,00,035 (Lee, 2012).
As the calculations of third case explains, the investor has to wait for 14 years to get $
75000 on 3% interest and if the interest rate is 11% than the amount would be converted into
$ 75000 in 4 years (Liu, 2009). It explains that the more the interest rate of the business
would be, the lesser the time would take to improve the future value and vice versa
(Madhura, 2015).
7
Net margin and operating margin of the business, Allen corporation has been
calculated and it has been found that the operating margin is $ 7.8 and the net margin is $
5.82. The company is achieving reasonable profits as after all the expenses company is able
to make extra profits (Vogel, 2014).
The return on assets and return on equity has been calculated further and it has been
measured that these ratios explain about investment level of the business. It explains that how
much profit is generated by the company on the basis of the available resources and for the
shareholders of the company (Babalola & Abiola, 2013).
Question 8:
The calculations of future cash flows and total time period have been given into the
appendix. In first case, it has been identified that the investor has to wait for 6 years to get the
amount $ 75000 through an investment of $ 50000 on 7% interest rate. Further, it has been
found that if the investor would invest for 10.25 years than the total future value of the
invested amount would be $ 1,00,035 (Lee, 2012).
As the calculations of third case explains, the investor has to wait for 14 years to get $
75000 on 3% interest and if the interest rate is 11% than the amount would be converted into
$ 75000 in 4 years (Liu, 2009). It explains that the more the interest rate of the business
would be, the lesser the time would take to improve the future value and vice versa
(Madhura, 2015).
Paraphrase This Document
Need a fresh take? Get an instant paraphrase of this document with our AI Paraphraser
Managerial Finance
8
References:
Babalola, Y. A., & Abiola, F. R. (2013). Financial ratio analysis of firms: A tool for decision
making. International journal of management sciences, 1(4), 132-137.
Chandra, P. (2011). Financial management. Tata McGraw-Hill Education.
Delivering our objectives. (2018). Wesfarmers Limited. [online]. Retrieved from
http://www.wesfarmers.com.au/investor-centre/company-performance-news/delivering-
our-objective
Dividend release. (2018). ASX. [online]. Retrieved from
https://www.asx.com.au/prices/dividends.htm
Fridson, M. S., & Alvarez, F. (2011). Financial statement analysis: a practitioner's
guide (Vol. 597). John Wiley & Sons.
Gapenski, L. C., & Reiter, K. L. (2008). Healthcare finance: an introduction to accounting
and financial management. Chicago, IL: Health Administration Press.
Goss, D. (2015). Small Business and Society (Routledge Revivals). Routledge.
Haney, L. H. (2009). Business Organization and Combination. BiblioBazaar, LLC.
Higgins, R. C. (2012). Analysis for financial management. McGraw-Hill/Irwin.
Lee, W. (2012). Time Value of Money. Cambridge University Press.
Liu, B. (2009). Some research problems in uncertainty theory. Journal of Uncertain
systems, 3(1), 3-10.
Madhura, L. (2015). Financial management. Tata McGraw-Hill Education.
Market dividends. (2018). Wesfarmers Limited. [online]. Retrieved from
https://www.asx.com.au/asx/markets/dividends.do?
by=asxCodes&asxCodes=WES&view=all
Petzke, K. J., Fuller, B. T., & Metges, C. C. (2010). Advances in natural stable isotope ratio
analysis of human hair to determine nutritional and metabolic status. Current Opinion
in Clinical Nutrition & Metabolic Care, 13(5), 532-540.
Share price. (2018). Wesfarmers Limited. [online]. Retrieved from:
https://www.asx.com.au/asx/share-price-research/company/WES
Managerial Finance
9
Vogel, H. L. (2014). Entertainment industry economics: A guide for financial analysis.
Cambridge University Press.
Who we are. (2018). Wesfarmers Limited. [online]. Retrieved from
http://www.wesfarmers.com.au/who-we-are/who-we-are
9
Vogel, H. L. (2014). Entertainment industry economics: A guide for financial analysis.
Cambridge University Press.
Who we are. (2018). Wesfarmers Limited. [online]. Retrieved from
http://www.wesfarmers.com.au/who-we-are/who-we-are
⊘ This is a preview!⊘
Do you want full access?
Subscribe today to unlock all pages.
Trusted by 1+ million students worldwide
Managerial Finance
10
Appendix:
Income Statement
Sales 573000
Less: cost of goods sold 297000
Gross profit 276000
Expenses
Depreciation 66000
General and administration
expenses 71100
Interest expenses 4750
Tax amount 50500
Profit 83650
Statement of Financial Position
Assets
Noncurrent Assets
PPE (property, plant and
equipment) 895000
Less: Accumulated depreciation 263000
Current assets
Cash 225000
Accounts receivable 167500
Inventory 99300
Total Assets 1123800
Liabilities
Noncurrent liabilities 334000
Current Liabilities
Accounts payable 102000
Notes payable 75000
Tax payable 53000
Accrued expenses 7900
Total Liabilities 571900
Equity
Ordinary shares 289000
Retained earnings 262900
Paraphrase This Document
Need a fresh take? Get an instant paraphrase of this document with our AI Paraphraser
Managerial Finance
11
Total equity 551900
Total liabilities and equity 1123800
Ratio Calculations 220XX
Profitability Ratios: 20XX
Return on assets
Net profit / 83,650
Total assets
1,123,80
0
Answer: % 7.44%
Return on equity
Net profit / 83,650
Total stockholder's equity 551,900
Answer: % 15%
Profit margin
Net profit / 83,650
Sales Revenue % 573,000
Answer: 14.60%
Liquidity Ratios
Current Ratio
Current Assets / 491,800
Current liabilities 237,900
Answer: 2.07
Current Ratio
Current Assets - Inventory/ 392,500
Current liabilities 237,900
Answer: 1.65
Capital Structure Ratios
Debt to assets ratio
Total debt / 334,000
total assets 1,123,800
Answer: % 0.297
Managerial Finance
12
Debt to equity ratio
Total debt / 334,000
Total equity 551,900
Answer: % 0.605
Trade payable days
Accounts payable/ 177,000
Cost of sales 297,000
Answer: (note the above needs to be x
365)
#
days 217.53
Inventory days
Average Inventory / 99,300
Cost of Sales
#
days 297,000
Answer: (note the above needs to be x 365) 122.04
Trade Receivables days
Average trade debtors /
99,30
0
Sales revenue (note used operating revenue)
#
days
573,00
0
Answer: (note the above needs to be x 365) 63.25
Calculation of liquidity position
Current Changed
Current assets
Cash
$
3,000,000
$
1,000,000
Other current
assets
$
9,000,000
$
9,000,000
$
12,000,000
$
10,000,000
Current Liabilities
$
6,000,000
$
4,500,000
2.00 2.22
Calculation of operating
profit and net profit
Sales
$
65.00
⊘ This is a preview!⊘
Do you want full access?
Subscribe today to unlock all pages.
Trusted by 1+ million students worldwide
1 out of 14
Related Documents


Your All-in-One AI-Powered Toolkit for Academic Success.
+13062052269
info@desklib.com
Available 24*7 on WhatsApp / Email
![[object Object]](/_next/static/media/star-bottom.7253800d.svg)
Unlock your academic potential
Copyright © 2020–2026 A2Z Services. All Rights Reserved. Developed and managed by ZUCOL.