7ENT1059 FEA Assignment: Vibration Analysis of a Box & Plate Stress

Verified

Added on  2022/09/16

|15
|1860
|17
Report
AI Summary
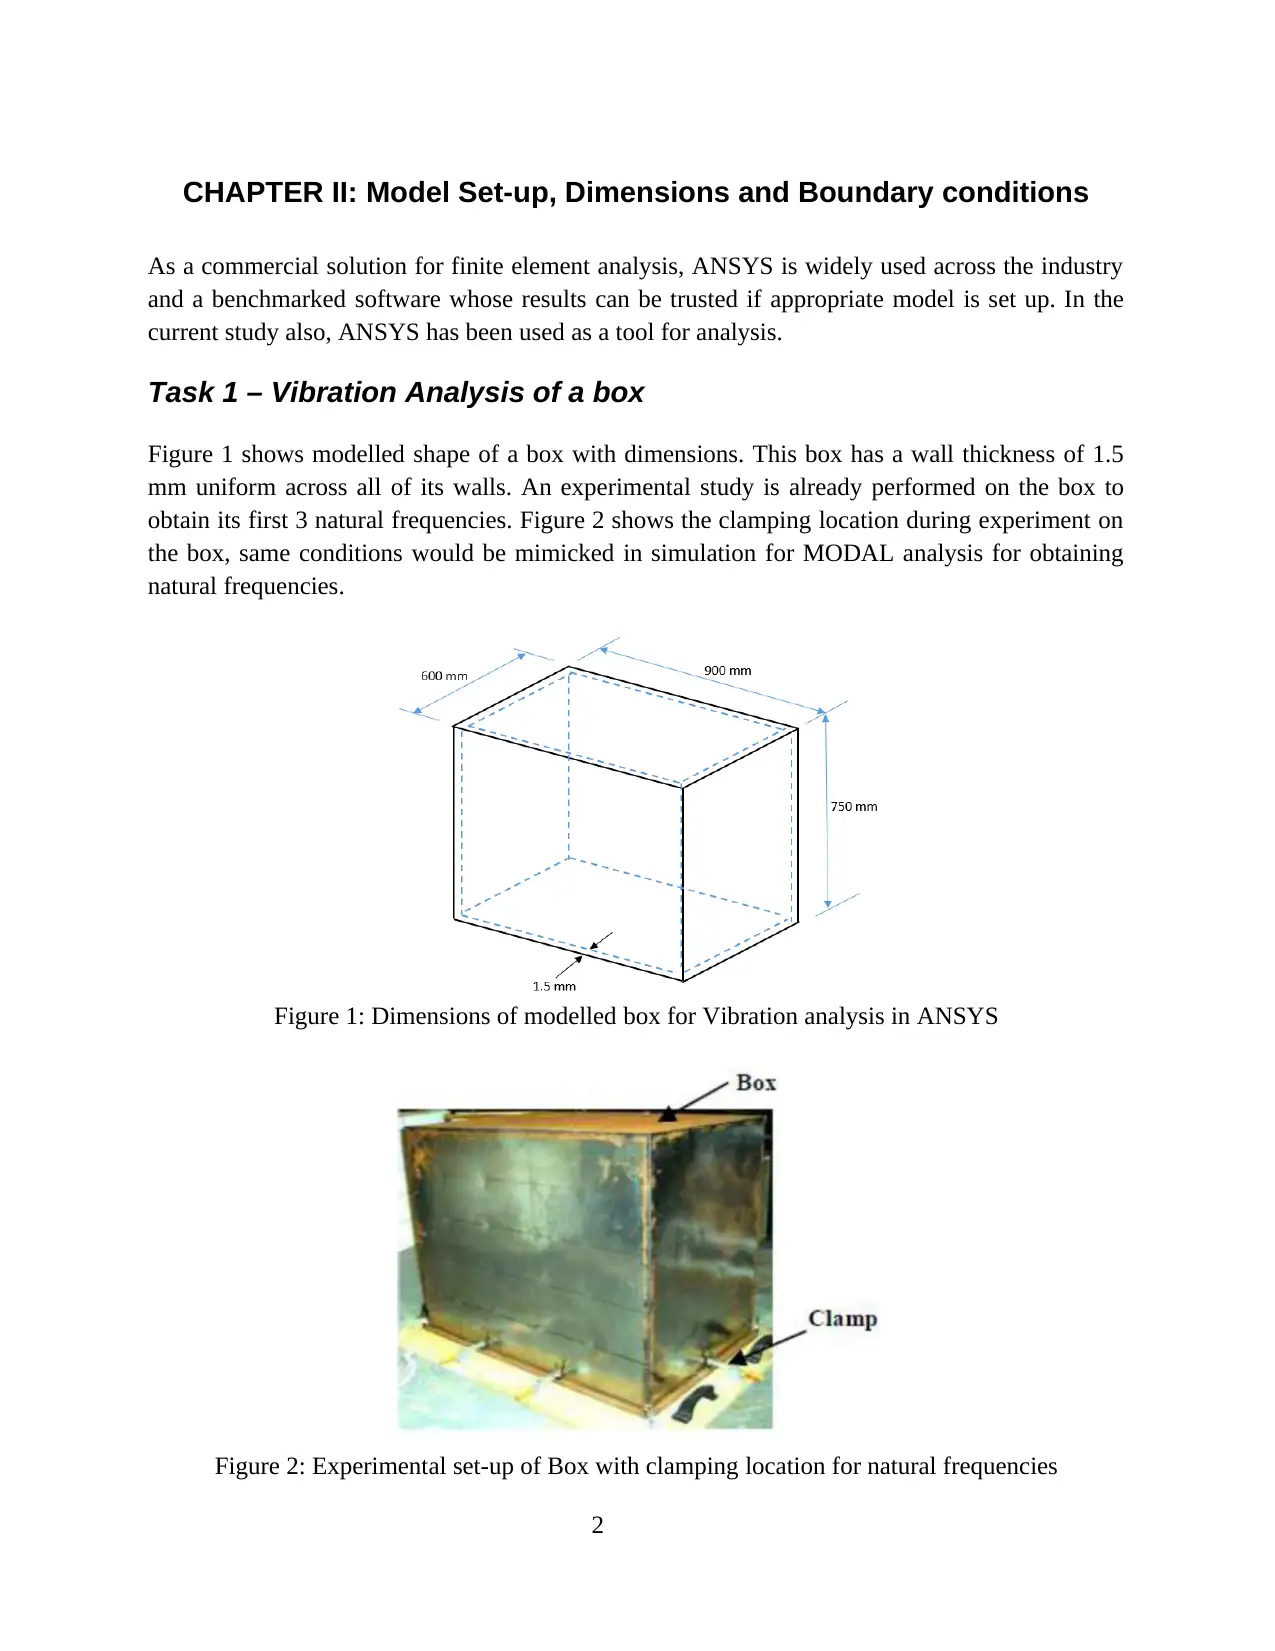
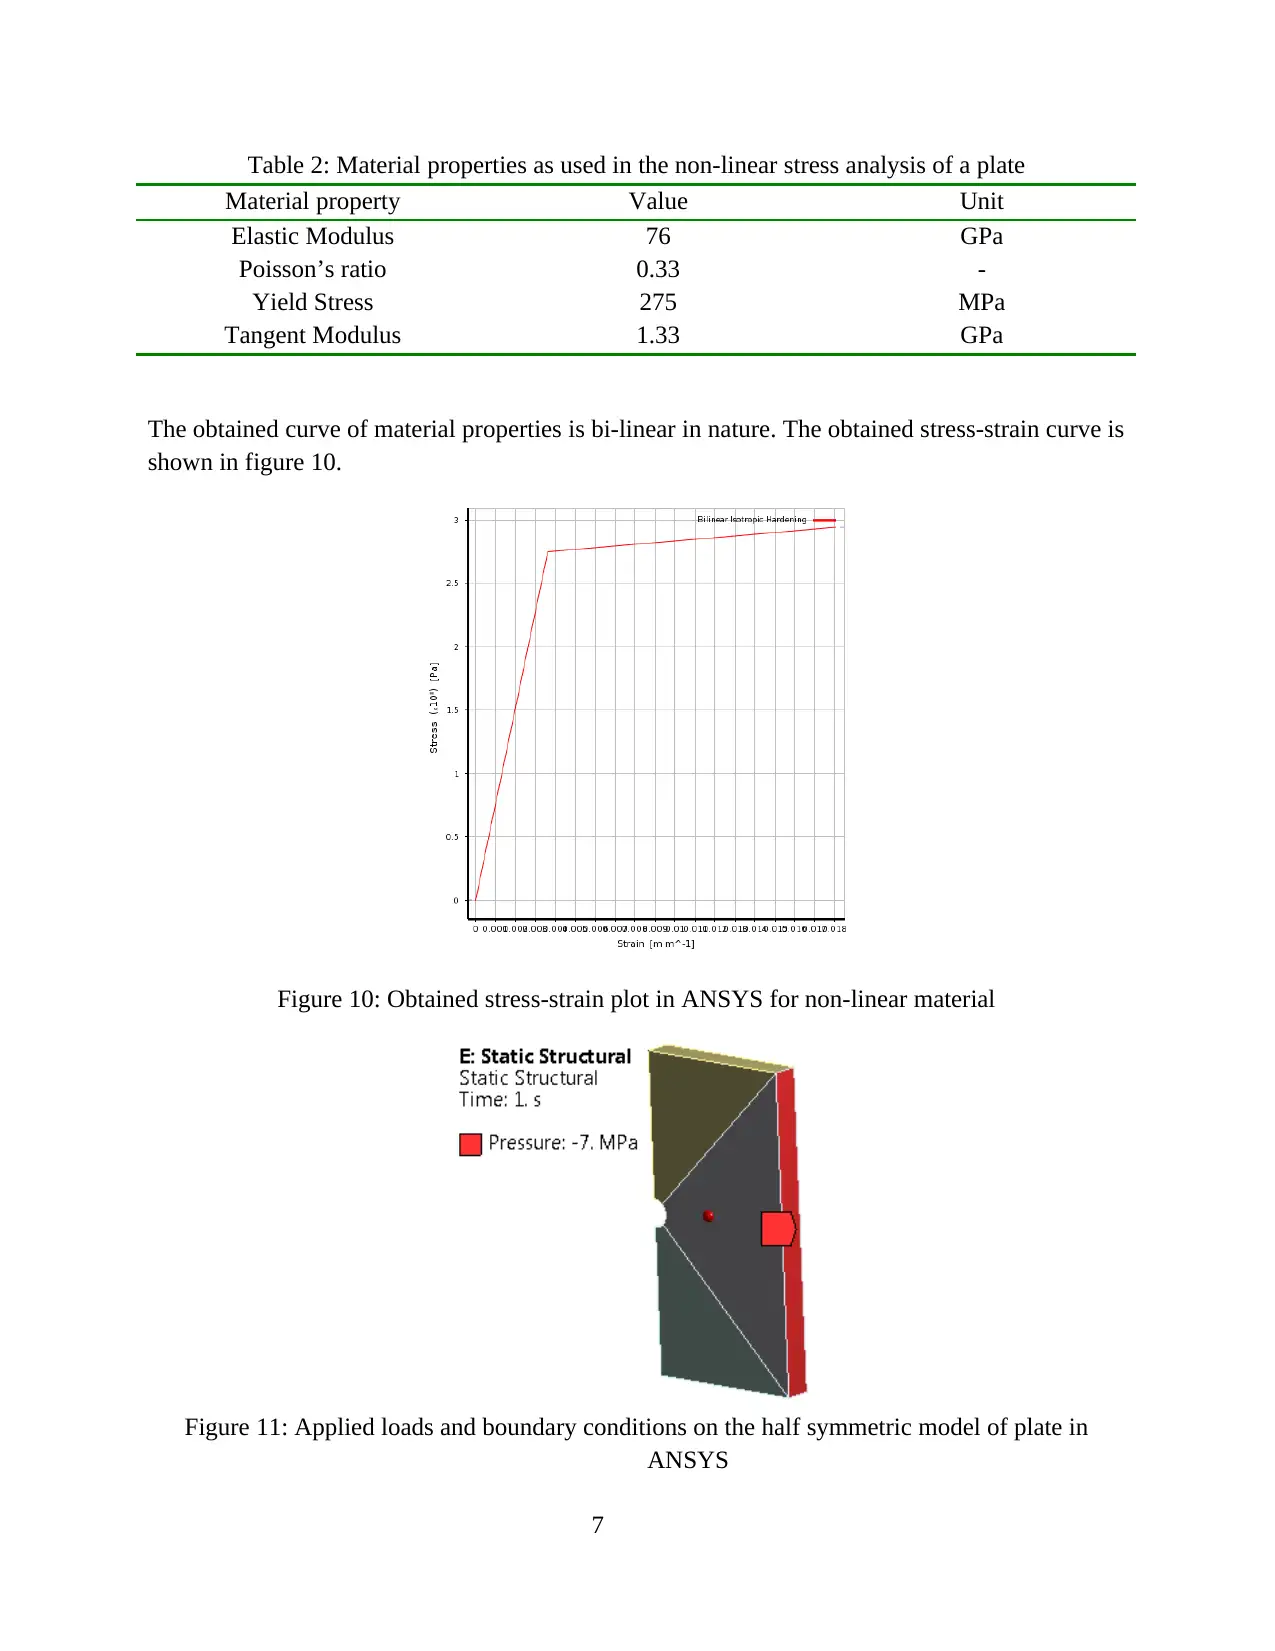
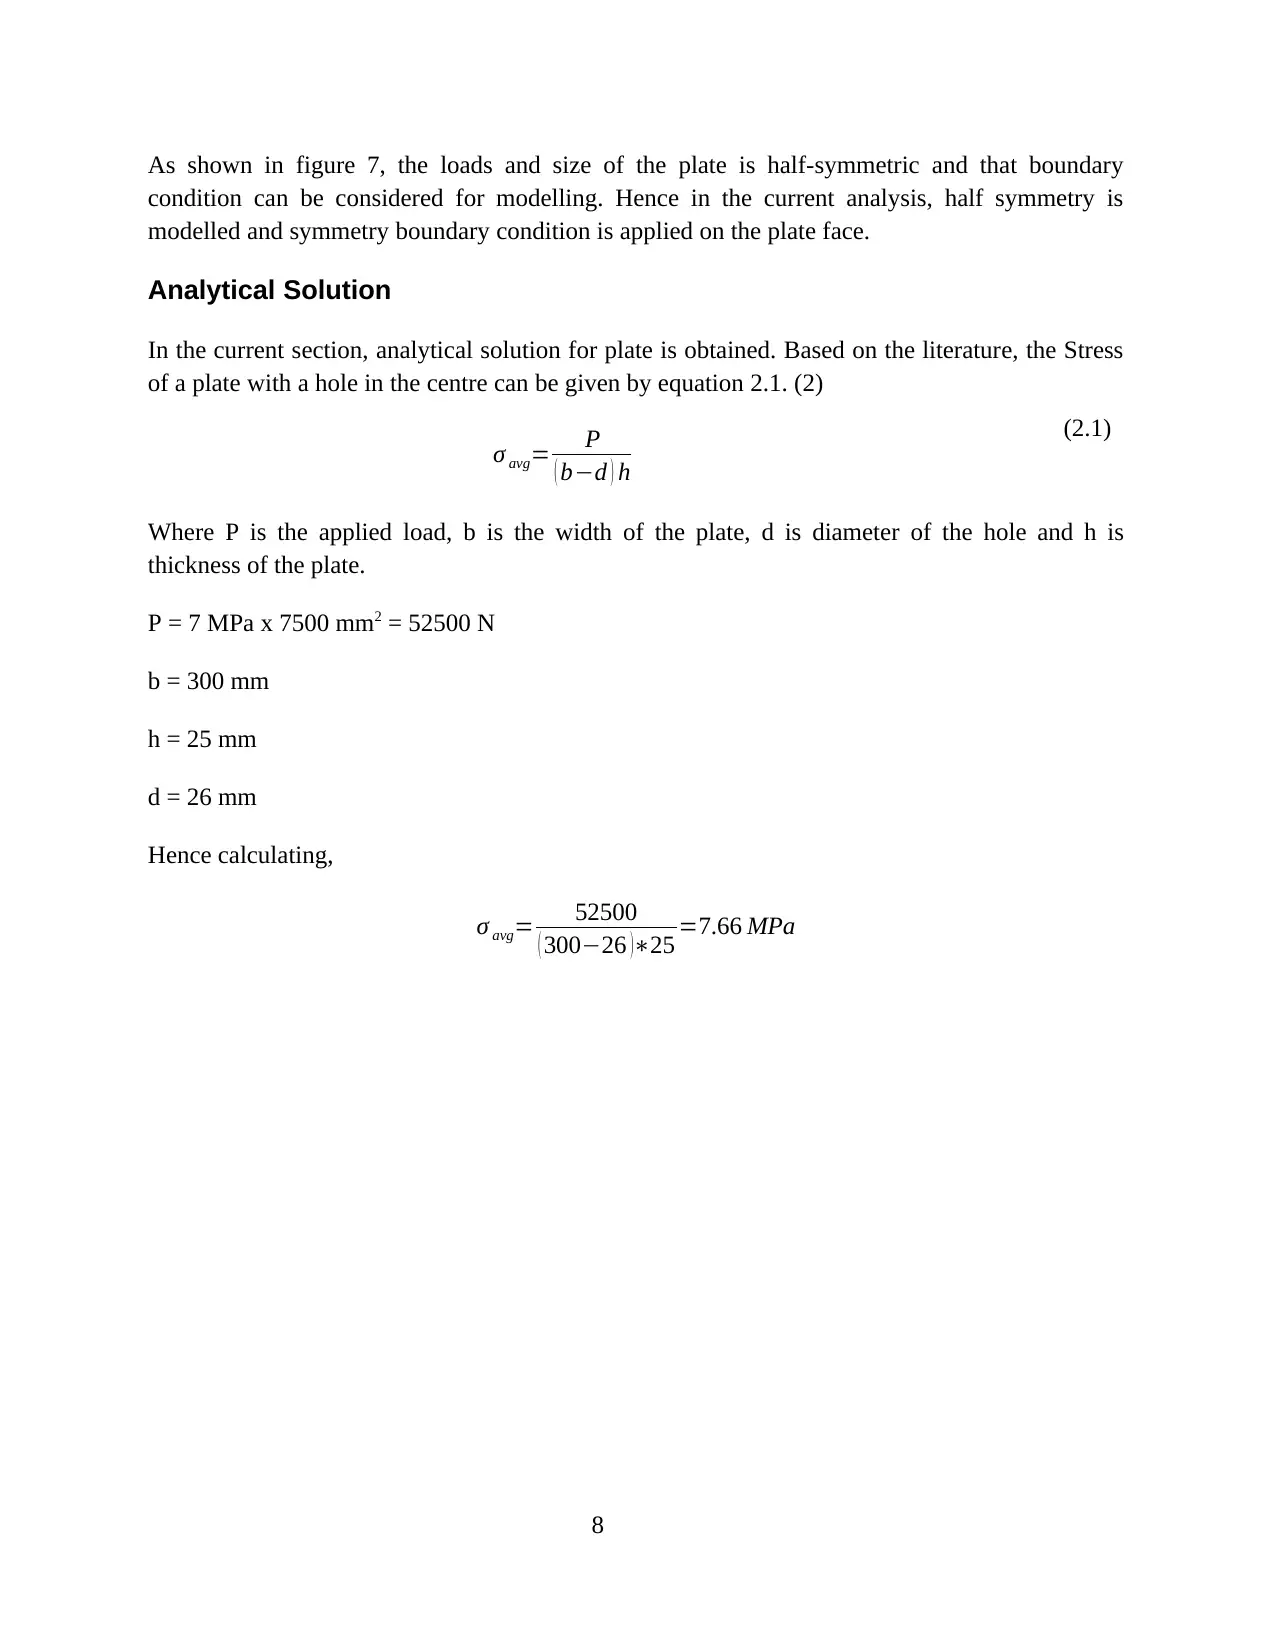
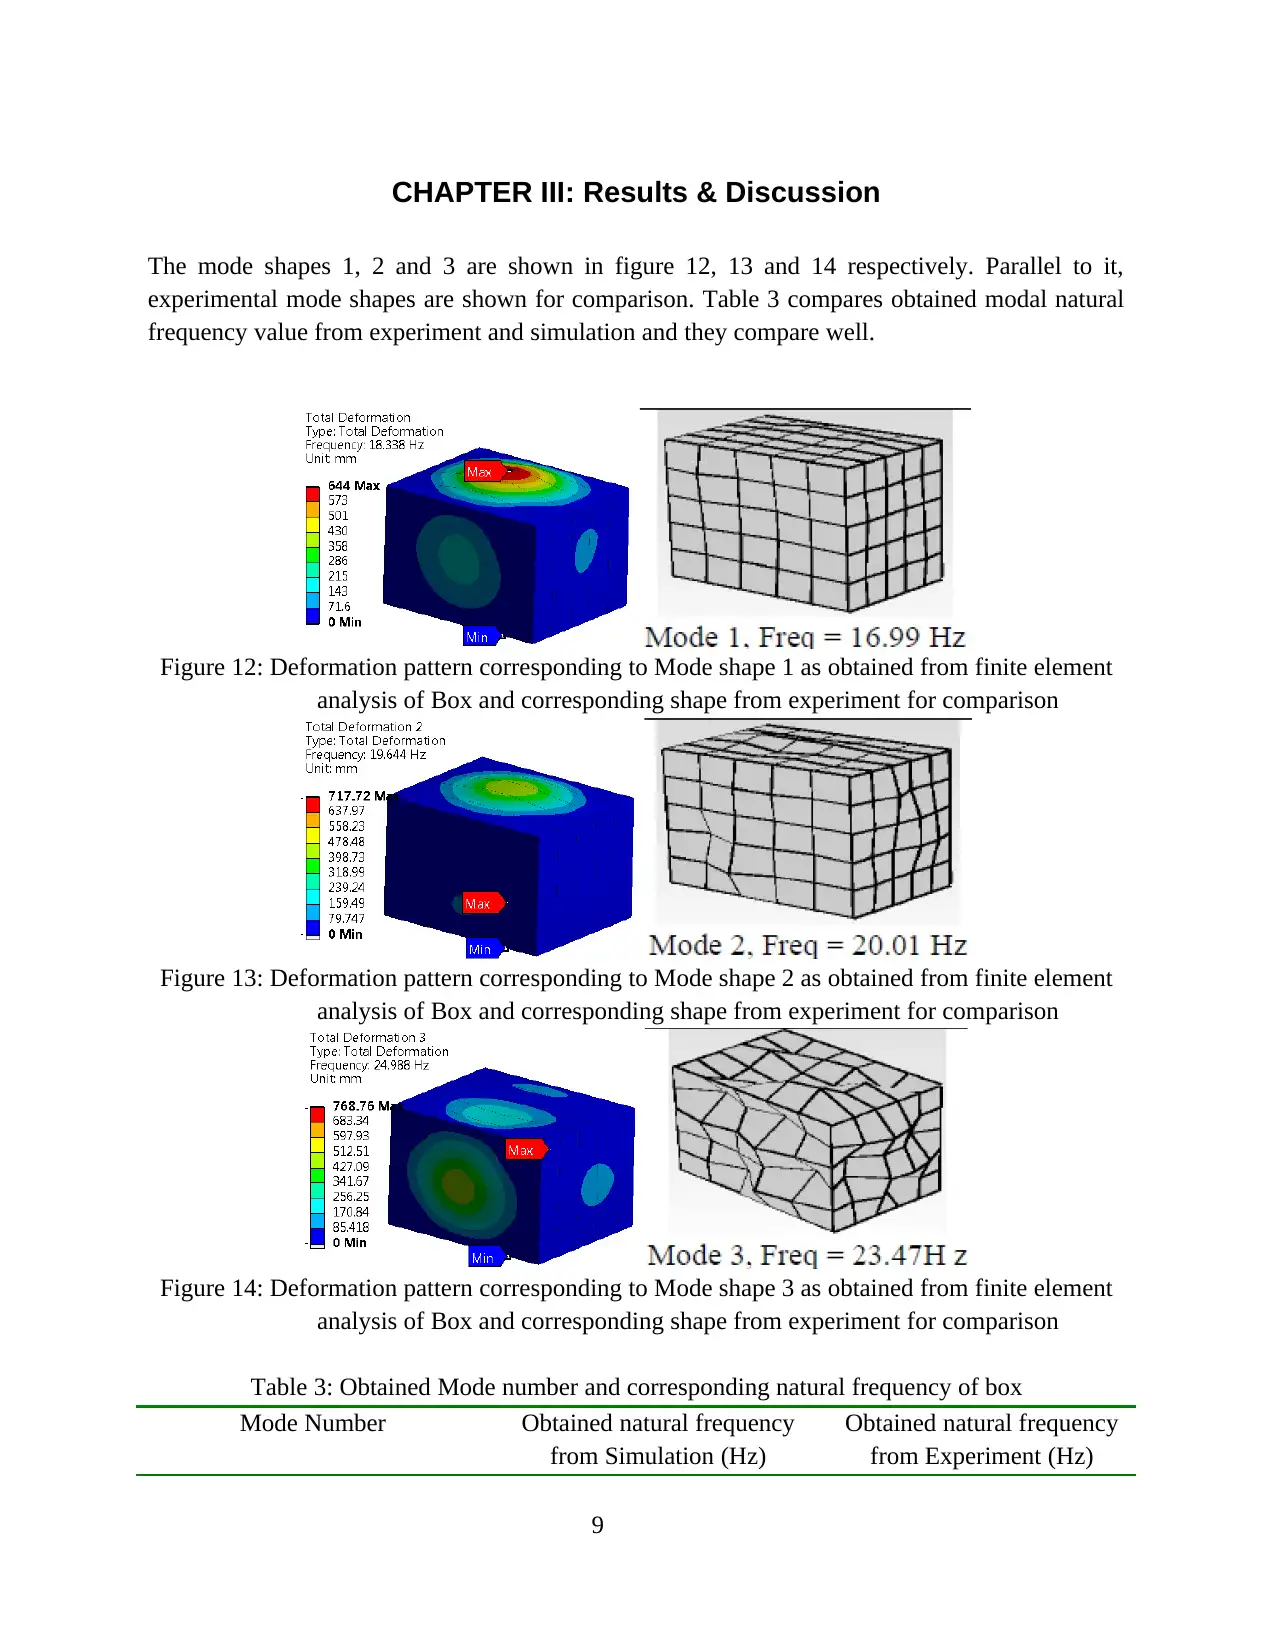
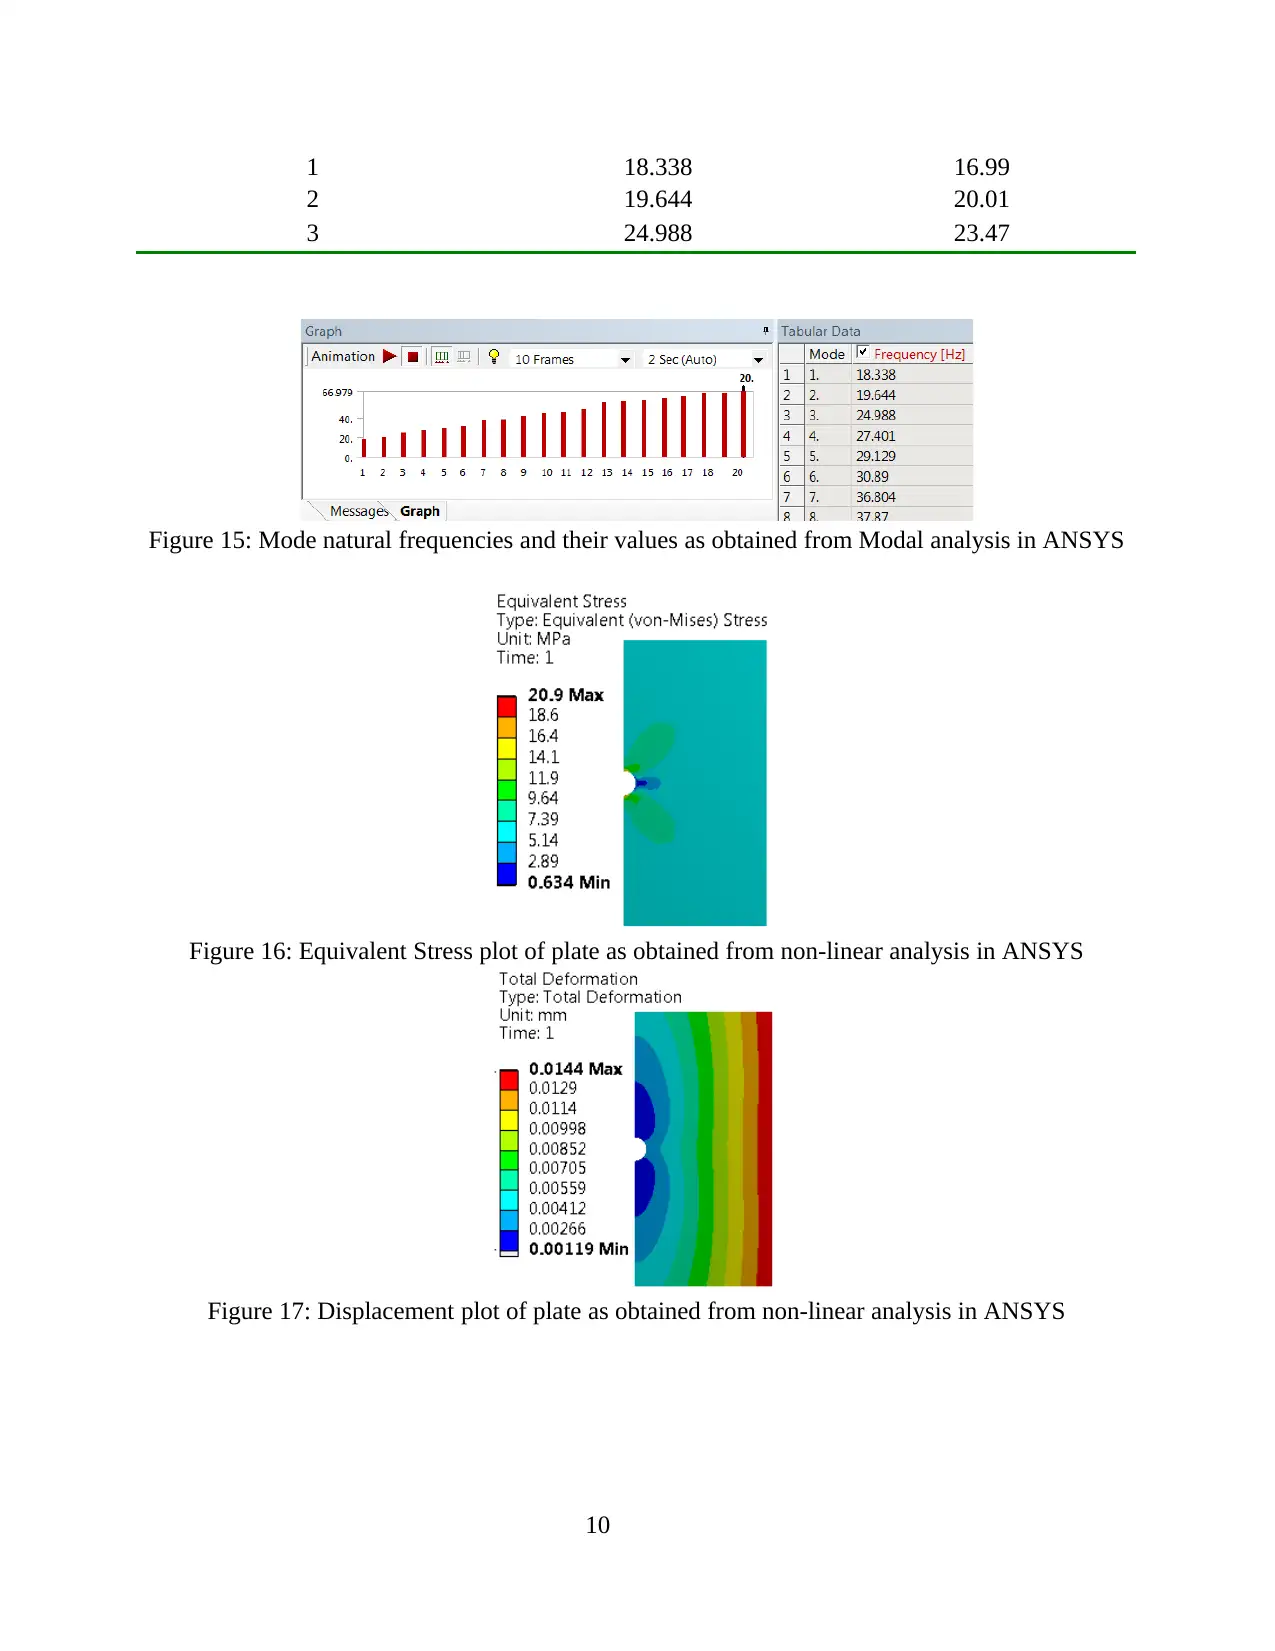
This report presents a comprehensive finite element analysis (FEA) study, conducted using ANSYS, focusing on two primary tasks: vibration analysis of a box and stress analysis of an aluminum plate. The report details the model setup, including dimensions, boundary conditions, and material properties for both analyses. For the box vibration analysis, modal analysis is performed to determine natural frequencies, with comparisons made to experimental results. The study also explores the impact of changing to orthotropic material properties. The stress analysis of the plate investigates non-linear behavior under applied loads, with a focus on meshing and its impact on results convergence. The report includes analytical solutions for stress calculations and presents results in the form of mode shapes, stress distributions, displacement, and strain plots. The discussion section compares simulation and experimental findings, highlighting the importance of meshing in non-linear analysis and the accuracy of FEA in predicting component behavior. The conclusion summarizes the key findings, emphasizing the effectiveness of FEA as a tool for engineering design and analysis. This report is a valuable resource for students studying mechanical engineering, providing insights into FEA applications and methodologies.
Document Page
Finite Element Analysis – Vibration of a box,
Stress in a plate
<Student Name>
<Student Number>
Assignment Report
Supervisor: <XXX>
SCHOOL OF ENGINEERING AND COMPUTER SCIENCE
University of HERTFORDSHIRE
<Month Year>
tabler-icon-diamond-filled.svg

Paraphrase This Document

Need a fresh take? Get an instant paraphrase of this document with our AI Paraphraser
Document Page
TABLE OF CONTENTS
TABLE OF CONTENTS..................................................................................................................i
CHAPTER I: INTRODUCTION.....................................................................................................1
CHAPTER II: Model Set-up, Dimensions and Boundary conditions.............................................2
Task 1 – Vibration Analysis of a box..........................................................................................2
Geometry and discretization....................................................................................................3
Judgement of discretization......................................................................................................4
Material properties, loads and Boundary conditions................................................................4
Task 1B – Changing to Orthotropic material...........................................................................4
Task 2 – Stress Analysis of an Aluminium plate.........................................................................5
Geometry and discretization....................................................................................................5
Judgement of discretization......................................................................................................6
Material properties, loads and Boundary conditions................................................................6
Analytical Solution..................................................................................................................8
CHAPTER III: Results & Discussion..............................................................................................9
CHAPTER IV: Conclusion............................................................................................................12
References......................................................................................................................................13
i
Document Page
CHAPTER I: INTRODUCTION
Different applications across the industry use finite element analysis very widely now-a-days.
Multiple types of analysis such as modal, stress analysis (linear and non-linear), thermal etc. can
be done to access the corresponding performance parameters of the designed products.
Multiple applications can be seen across the industry. Traditional one to look is a pressure vessel.
It can be seen that pressure vessel can be designed with analytical calculations first hand.
Sometimes, if the design has a singularity where stress concentrate, it can be captured using
analytical calculations. FEA captures this and reports the results accurately on the stress rise (1).
1
Document Page
CHAPTER II: Model Set-up, Dimensions and Boundary conditions
As a commercial solution for finite element analysis, ANSYS is widely used across the industry
and a benchmarked software whose results can be trusted if appropriate model is set up. In the
current study also, ANSYS has been used as a tool for analysis.
Task 1 – Vibration Analysis of a box
Figure 1 shows modelled shape of a box with dimensions. This box has a wall thickness of 1.5
mm uniform across all of its walls. An experimental study is already performed on the box to
obtain its first 3 natural frequencies. Figure 2 shows the clamping location during experiment on
the box, same conditions would be mimicked in simulation for MODAL analysis for obtaining
natural frequencies.
Figure 1: Dimensions of modelled box for Vibration analysis in ANSYS
Figure 2: Experimental set-up of Box with clamping location for natural frequencies
2
tabler-icon-diamond-filled.svg

Paraphrase This Document

Need a fresh take? Get an instant paraphrase of this document with our AI Paraphraser
Document Page
Geometry and discretization
Geometry shown in figure 1 is replicated in ANSYS Designmodeler. Prepared geometry is
shown in figure 3.
Figure 3: Prepared geometry of box in ANSYS Designmodeler for vibration analysis
The geometry has been sliced into rectangular pieces across all 3 dimensions similar to
experimental set up. This helps in applying appropriate constraints similar to clamps on to the
box geometry during analysis.
The prepared geometry is to be meshed and analysed. Meshing (discretization) is shown in figure
4.
Figure 4: Discretization of prepared box in ANSYS Modal analysis
3
Document Page
Judgement of discretization
The meshing as shown in figure 4 has been refined i.e. element size was reduced to check and
see if there is any impact on the natural frequencies. It was observed that change in element size
had negligible effect on the value of obtained natural frequencies.
Material properties, loads and Boundary conditions
In this section, mesh, loads and boundary conditions are shown and discussed. The box is sliced
into rectangular boxes as shown in the prepared geometry. The clamps are replicated by applying
a fixed boundary condition on the side edges along the faces where clamps are put.
Figure 5: Applied fixed boundary conditions along the edges of rectangular box in ANSYS
Current material properties used in the analysis are listed in Table 1. The elastic modulus,
Poisson’s ratio and density are used as provided for the material of choice for the box.
Table 1: Material properties as used in the vibrational analysis of the box
Material property Value Unit
Elastic Modulus 200 GPa
Poisson’s ratio 0.3 -
Density 7830 Kg/m3
Task 1B – Changing to Orthotropic material
If the material properties of the box are to be changed to orthotropic, it can be done in ANSYS.
The definition of orthotropic material requires directional properties in X, Y and Z to be defined.
The used material model in ANSYS is shown in figure 6.
4
Document Page
Figure 6: Orthotropic material model as can be used in ANSYS for directional properties
definition
Along with orthotropic material, it would need definition of orientation for the analysis to know
the direction mapping on to the part.
Task 2 – Stress Analysis of an Aluminium plate
In this section, model of task 2 is discussed in which a plate is analysed for its non-linear
behaviour on application of loads.
Geometry and discretization
Geometry dimensions shown in figure 7 is replicated in ANSYS Design modeler. Prepared
geometry is shown in figure 8.
Figure 7: Dimensions of modelled plate for non-linear stress analysis in ANSYS
The hole in the centre of the geometry might make the meshing difficult and not sweep-able
hence geometry is cut into 4 pieces along the diagonal of the plate. This helps in meshing the
geometry easily. The prepared geometry is to be meshed and analysed. Meshing (discretization)
is shown in figure 9. The meshing is very critical in the non-linear analysis so as to capture
accurate results. In the current analysis, a swept mesh is created by mapping a size over the edges
of the geometry so that all the elements can keep their aspect ratio within acceptable range.
5
tabler-icon-diamond-filled.svg

Paraphrase This Document

Need a fresh take? Get an instant paraphrase of this document with our AI Paraphraser
Document Page
Figure 8: Prepared geometry of plate in ANSYS Designmodeler for non-linear stress analysis
Figure 9: Discretization (meshing) of prepared plate in ANSYS non-linear stress analysis
Judgement of discretization
The meshing as shown in figure 9 has been refined i.e. element size was reduced to check and
see if there is any impact on the stress values. It was observed that change in element size had
significant effect on the value of obtained equivalent stress until a minimum size of 2.5 mm.
Below that even if the mesh size is further refined, the analysis results does not change. Hence it
can be considered as converged mesh.
Material properties, loads and Boundary conditions
Current material properties used in the analysis are listed in Table 2. The elastic modulus,
Poisson’s ratio and density are used as provided for the material of choice for the box.
6
Document Page
Table 2: Material properties as used in the non-linear stress analysis of a plate
Material property Value Unit
Elastic Modulus 76 GPa
Poisson’s ratio 0.33 -
Yield Stress 275 MPa
Tangent Modulus 1.33 GPa
The obtained curve of material properties is bi-linear in nature. The obtained stress-strain curve is
shown in figure 10.
Figure 10: Obtained stress-strain plot in ANSYS for non-linear material
Figure 11: Applied loads and boundary conditions on the half symmetric model of plate in
ANSYS
7
Document Page
As shown in figure 7, the loads and size of the plate is half-symmetric and that boundary
condition can be considered for modelling. Hence in the current analysis, half symmetry is
modelled and symmetry boundary condition is applied on the plate face.
Analytical Solution
In the current section, analytical solution for plate is obtained. Based on the literature, the Stress
of a plate with a hole in the centre can be given by equation 2.1. (2)
σ avg= P
( bd ) h
(2.1)
Where P is the applied load, b is the width of the plate, d is diameter of the hole and h is
thickness of the plate.
P = 7 MPa x 7500 mm2 = 52500 N
b = 300 mm
h = 25 mm
d = 26 mm
Hence calculating,
σ avg= 52500
( 30026 )25 =7.66 MPa
8
tabler-icon-diamond-filled.svg

Paraphrase This Document

Need a fresh take? Get an instant paraphrase of this document with our AI Paraphraser
Document Page
CHAPTER III: Results & Discussion
The mode shapes 1, 2 and 3 are shown in figure 12, 13 and 14 respectively. Parallel to it,
experimental mode shapes are shown for comparison. Table 3 compares obtained modal natural
frequency value from experiment and simulation and they compare well.
Figure 12: Deformation pattern corresponding to Mode shape 1 as obtained from finite element
analysis of Box and corresponding shape from experiment for comparison
Figure 13: Deformation pattern corresponding to Mode shape 2 as obtained from finite element
analysis of Box and corresponding shape from experiment for comparison
Figure 14: Deformation pattern corresponding to Mode shape 3 as obtained from finite element
analysis of Box and corresponding shape from experiment for comparison
Table 3: Obtained Mode number and corresponding natural frequency of box
Mode Number Obtained natural frequency
from Simulation (Hz)
Obtained natural frequency
from Experiment (Hz)
9
Document Page
1 18.338 16.99
2 19.644 20.01
3 24.988 23.47
Figure 15: Mode natural frequencies and their values as obtained from Modal analysis in ANSYS
Figure 16: Equivalent Stress plot of plate as obtained from non-linear analysis in ANSYS
Figure 17: Displacement plot of plate as obtained from non-linear analysis in ANSYS
10
chevron_up_icon
1 out of 15
circle_padding
hide_on_mobile
zoom_out_icon
[object Object]