FINM4106 Advanced Investments Project: Fama and French (1993)
VerifiedAdded on 2022/09/28
|11
|2099
|24
Project
AI Summary
This project replicates and extends the findings of Fama and French (1993) on stock returns, focusing on three stock-market factors: an overall market factor (excess market return), firm size, and book-to-market equity. The student utilizes data from Professor Kenneth R. French's data library, including the Fama/French factors (Mkt-RF, SMB, and HML) and 25 portfolios formed on size and book-to-market. The project involves merging datasets, performing time-series regressions, and analyzing the impact of these factors on stock returns. Key aspects include examining the relationship between the market factor, size, and book-to-market equity, as well as assessing the January effect and the factors' ability to explain cross-sectional variations in stock returns. The project's aim is to determine how well the three-factor model captures the patterns observed in the U.S. stock market, particularly with respect to size and value effects, using statistical analysis and replication of the original research.

ADVANCED INVESTMENTS
Paraphrase This Document
Need a fresh take? Get an instant paraphrase of this document with our AI Paraphraser

Table of Contents
Introduction.........................................................................................................................................2
Question 1............................................................................................................................................2
Question 2............................................................................................................................................3
Question 3............................................................................................................................................3
Question 4............................................................................................................................................4
Question 5............................................................................................................................................5
Question 6............................................................................................................................................6
Question 7............................................................................................................................................7
Question 8............................................................................................................................................8
Conclusion............................................................................................................................................9
Reference............................................................................................................................................10

Introduction
The primary point of this undertaking to execute and breaking down on the hall
factors and computing the stocks and bonds on the information investigation utilizing stata
usage. There are three financial exchange factors: a general market factor and factors
identified with firm size and book-to-showcase value. There are two security market factors.
Identified with development and default dangers. Stock returns have shared variety because
of the securities exchange variables, and they are connected to security returns through shared
variety in the security market factors. The cross-area of normal profits for U.S. regular stocks
indicates little connection to either the market is of the Sharpe resource valuing model or the
utilization ps of the intertemporal resource evaluating model and others. With the exception
of second rate corporates. Then again, factors that have no uncommon remaining in resource
evaluating hypothesis show solid capacity to clarify the cross-area of normal returns. The
rundown of exactly decided normal return factors incorporates size (ME, stock value time's
number of offers), influence, profit/value (E/P), and book-to-showcase value (the proportion
of the book estimation of an association's regular stock, BE, to its fairly estimated worth,
ME) of the security market elements catch the basic variety in security returns will be
researched.
Question 1
The elements that will in general impact the financial exchange have attracted
impressive consideration prompting generous investigates and studies planned for
disentangling the wonders of the securities exchange. Past examinations dependent on the
cross-area of normal returns of the basic stock in the United States demonstrate that there
exists little connection between the normal comes back to the market dependent on the β of
"Sharpe (1964)- Linter (1965) resource evaluating model or the utilization βs of the
intertemporal resource estimating model of Breeden (1979) and others" (Fama and French,
1993). Further, in their paper (Fama and French, 1993) note that factors which don't have any
exceptional remaining in the advantage estimating hypothesis do indicate adequately
dependable power in clarifying the cross-segment of normal returns. To address the
investigation objective, the paper is part into a few subsections relapse replication for both
the replication time frame just as the all-encompassing period, testing for January impact in
the replication time frame just, talk and organization dependent on the structure on the
account monetary on profits of stock for the data.
⊘ This is a preview!⊘
Do you want full access?
Subscribe today to unlock all pages.
Trusted by 1+ million students worldwide

Question 2
The intermediary for the market factor in stock returns is the overabundance market
return, R.M-RF. R&l is the arrival on the worth weighted arrangement of the stocks in the six
size-BE'ME portfolios, in addition to the negative-BE stocks rejected from the portfolios. RF
is the one-month bill pace of Stocks (Williams and Williams, 2010). We utilize
overabundance returns on 25 portfolios, framed on size and book-to-advertise value. As
needy factors in the time-arrangement relapses. We use portfolios shaped on size and BE/ME
since we try to decide if the copying portfolios SMB and HML catch regular factors in stock
returns identified with size and book-to-advertise value. Portfolios shaped on size and BE.'
AIE will likewise create a wide scope of normal comes back to be clarified by contending
resource valuing conditions. Afterward, in any case, we use portfolios framed on E.P
(income/cost) and DiP (profit/cost). Factors that are additionally useful about normal returns,
to check the power of our outcomes on the capacity of our informative variables to catch the
cross-segment of normal returns.
Question 3
The 25 size-BE,', LfE portfolios are shaped a lot of like the six size-BE;&LIE portfolios
talked about before. In June of every year t we sort NYSE stocks by size and (autonomously)
by book-to-advertise value. For the size sort. .Untruth is estimated toward the finish of June.
For the book-to-showcase sort, ME is advertise value toward the finish of December of c - 1.
What’s more, BE is book basic value for the monetary year finishing off with schedule year r
- 1. We use NYSE breakpoints for ME and BE; .tfE to assign NYSE. Amex. Furthermore,
(after 1972) NASDAQ stocks to five size quintiles and five book-to-advertise quintiles. We
develop 25 portfolios from the crossing points of the size and BE, LfE quintiles and figure
esteem weighted month to month returns on the portfolios from July off to June of r + 1. The
overabundance returns on these 25 portfolios for July 1963 to December 1991 are the reliant
factors for stocks in the time-arrangement relapses.
Paraphrase This Document
Need a fresh take? Get an instant paraphrase of this document with our AI Paraphraser
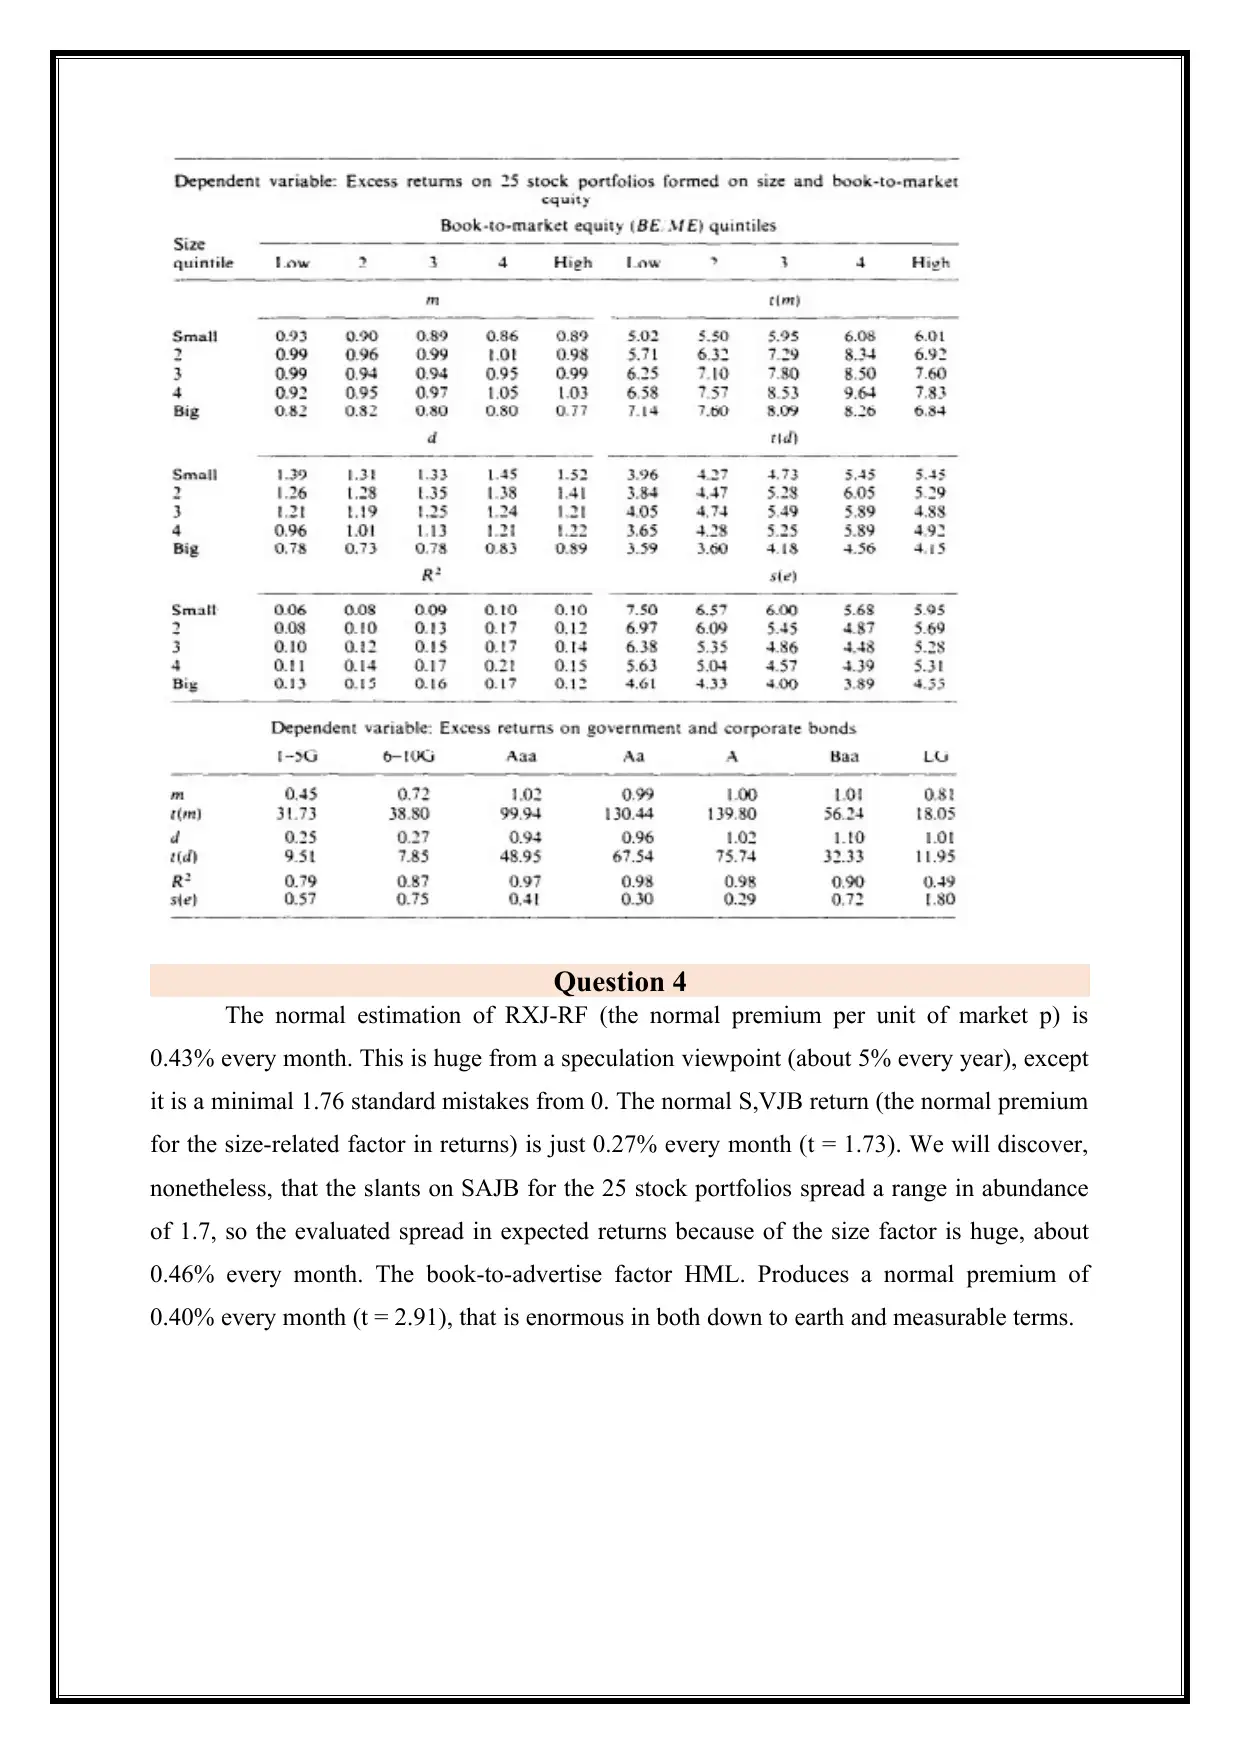
Question 4
The normal estimation of RXJ-RF (the normal premium per unit of market p) is
0.43% every month. This is huge from a speculation viewpoint (about 5% every year), except
it is a minimal 1.76 standard mistakes from 0. The normal S,VJB return (the normal premium
for the size-related factor in returns) is just 0.27% every month (t = 1.73). We will discover,
nonetheless, that the slants on SAJB for the 25 stock portfolios spread a range in abundance
of 1.7, so the evaluated spread in expected returns because of the size factor is huge, about
0.46% every month. The book-to-advertise factor HML. Produces a normal premium of
0.40% every month (t = 2.91), that is enormous in both down to earth and measurable terms.
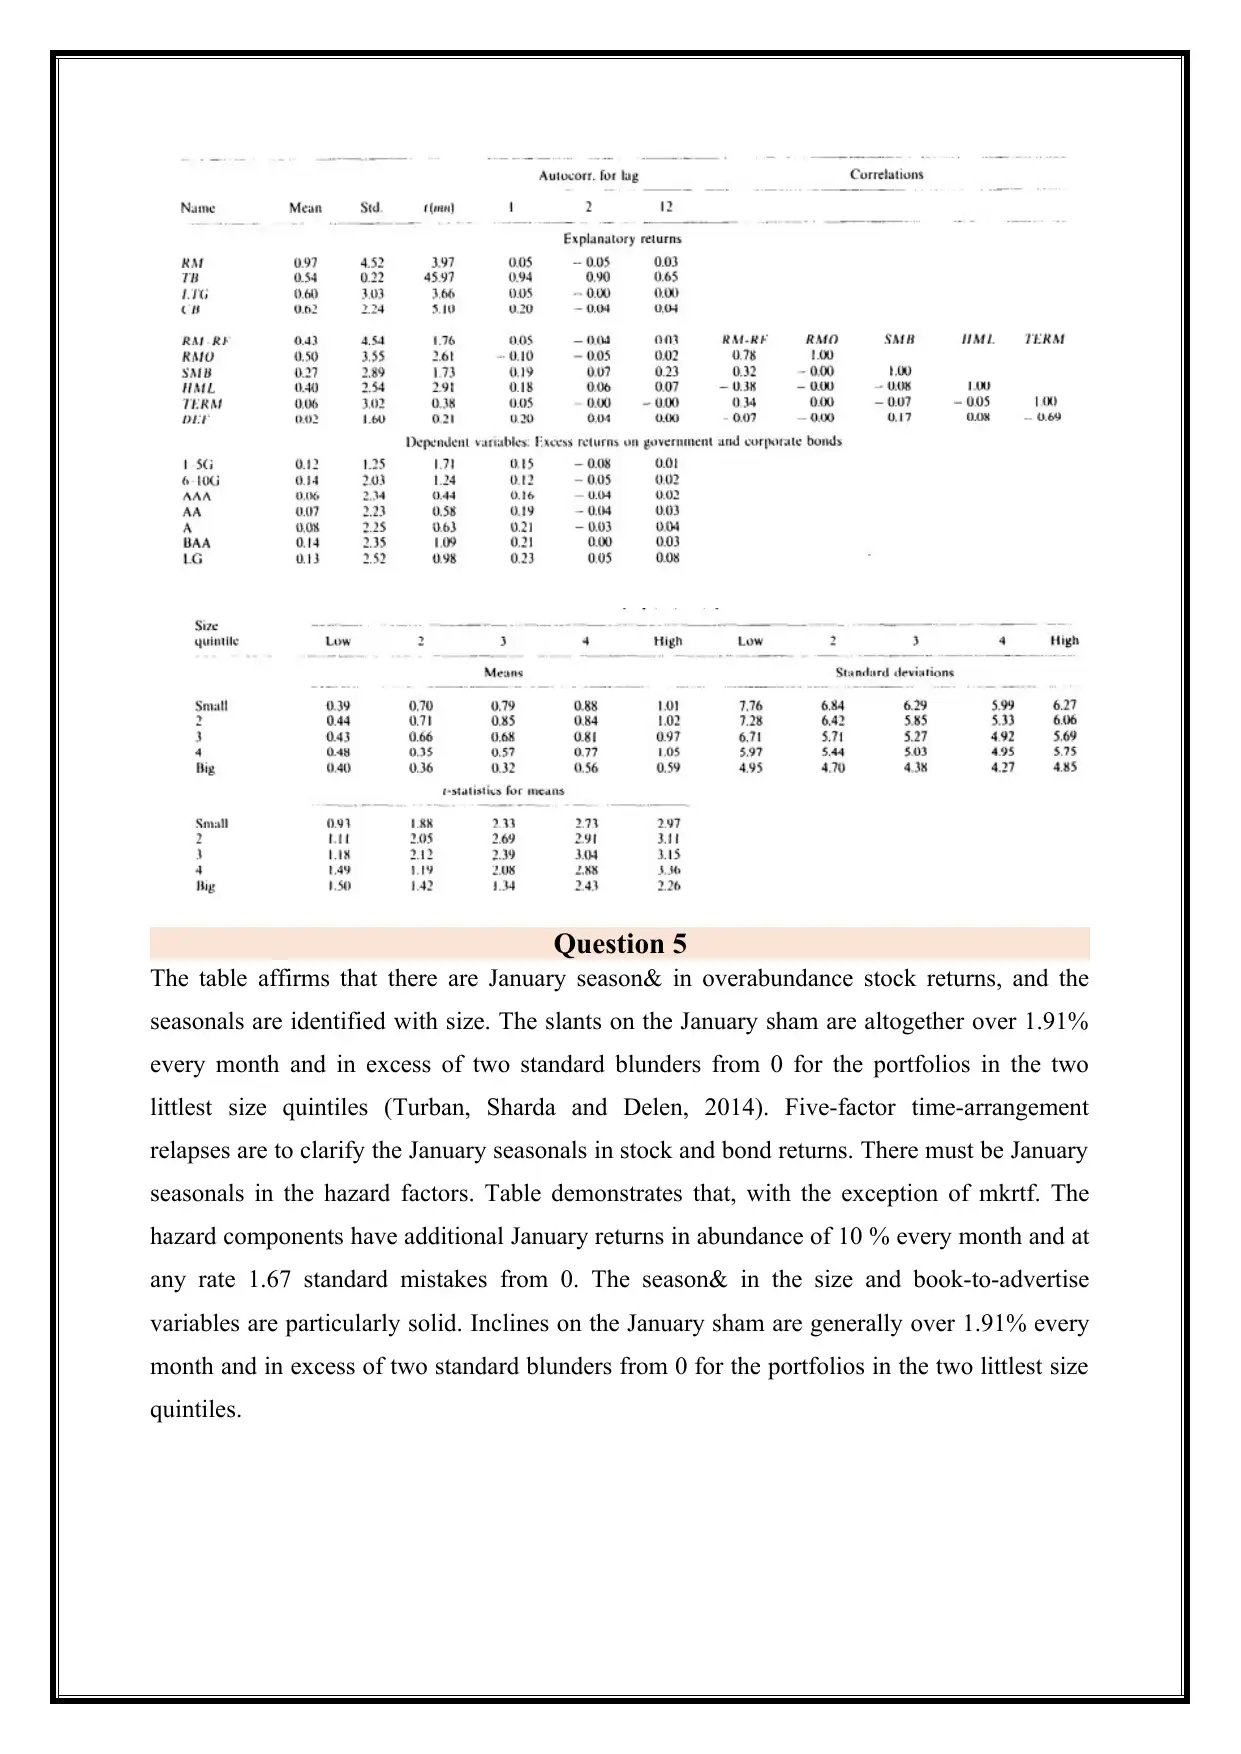
Question 5
The table affirms that there are January season& in overabundance stock returns, and the
seasonals are identified with size. The slants on the January sham are altogether over 1.91%
every month and in excess of two standard blunders from 0 for the portfolios in the two
littlest size quintiles (Turban, Sharda and Delen, 2014). Five-factor time-arrangement
relapses are to clarify the January seasonals in stock and bond returns. There must be January
seasonals in the hazard factors. Table demonstrates that, with the exception of mkrtf. The
hazard components have additional January returns in abundance of 10 % every month and at
any rate 1.67 standard mistakes from 0. The season& in the size and book-to-advertise
variables are particularly solid. Inclines on the January sham are generally over 1.91% every
month and in excess of two standard blunders from 0 for the portfolios in the two littlest size
quintiles.
⊘ This is a preview!⊘
Do you want full access?
Subscribe today to unlock all pages.
Trusted by 1+ million students worldwide
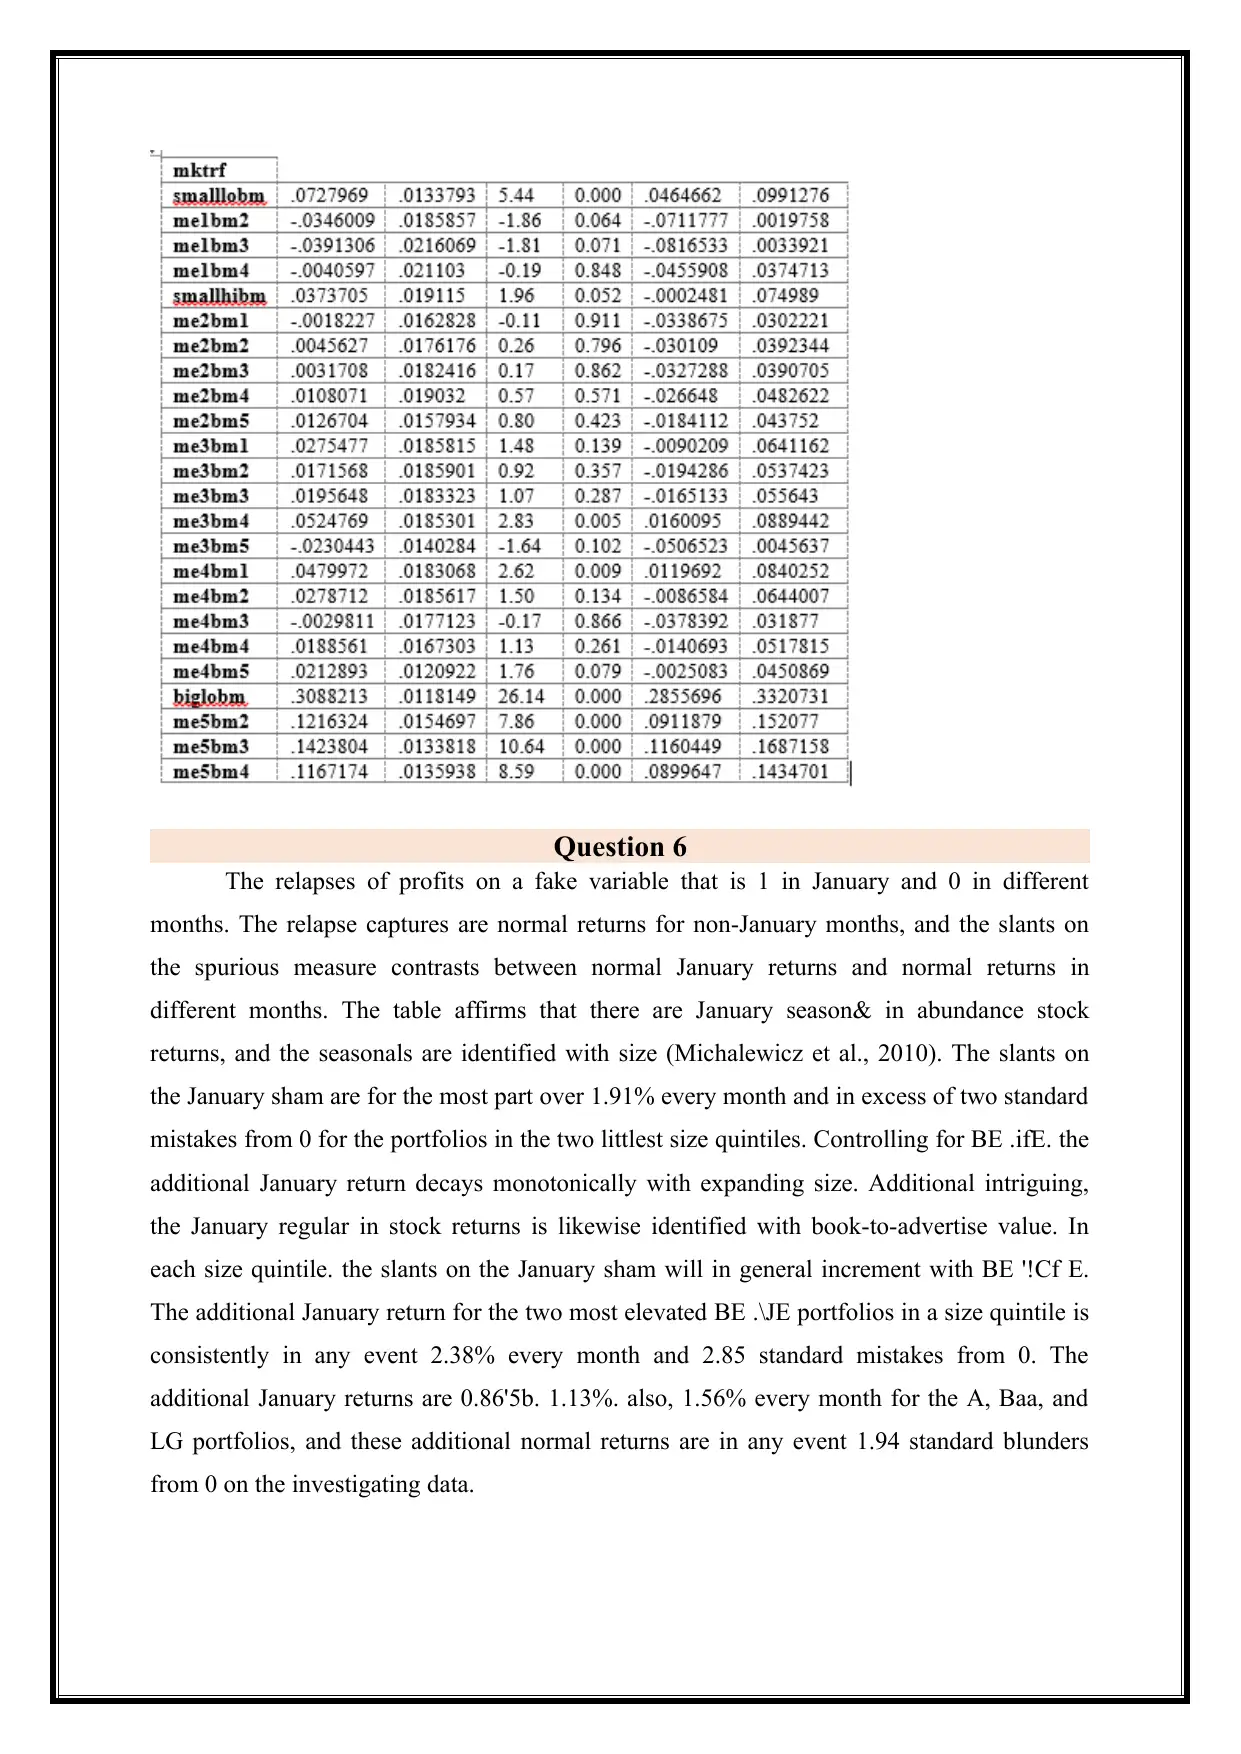
Question 6
The relapses of profits on a fake variable that is 1 in January and 0 in different
months. The relapse captures are normal returns for non-January months, and the slants on
the spurious measure contrasts between normal January returns and normal returns in
different months. The table affirms that there are January season& in abundance stock
returns, and the seasonals are identified with size (Michalewicz et al., 2010). The slants on
the January sham are for the most part over 1.91% every month and in excess of two standard
mistakes from 0 for the portfolios in the two littlest size quintiles. Controlling for BE .ifE. the
additional January return decays monotonically with expanding size. Additional intriguing,
the January regular in stock returns is likewise identified with book-to-advertise value. In
each size quintile. the slants on the January sham will in general increment with BE '!Cf E.
The additional January return for the two most elevated BE .\JE portfolios in a size quintile is
consistently in any event 2.38% every month and 2.85 standard mistakes from 0. The
additional January returns are 0.86'5b. 1.13%. also, 1.56% every month for the A, Baa, and
LG portfolios, and these additional normal returns are in any event 1.94 standard blunders
from 0 on the investigating data.
Paraphrase This Document
Need a fresh take? Get an instant paraphrase of this document with our AI Paraphraser
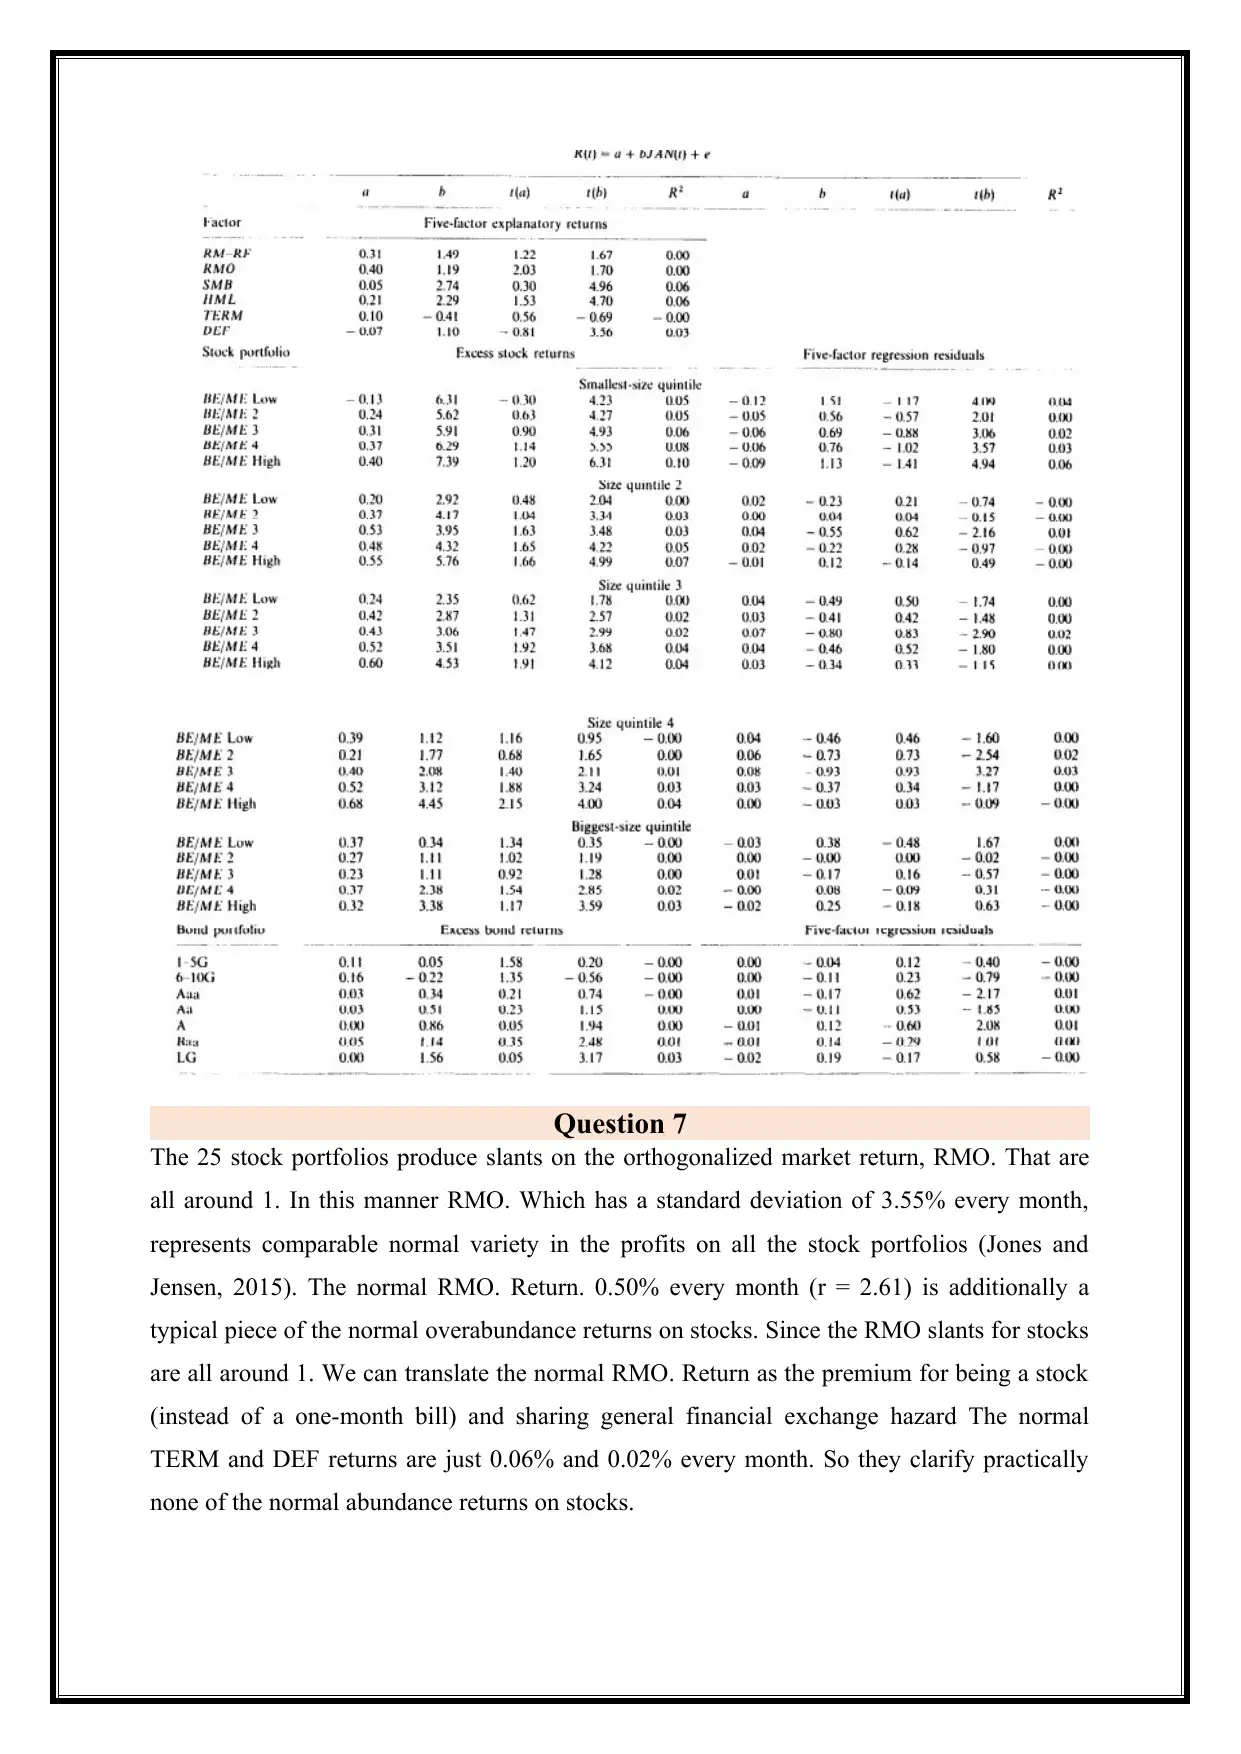
Question 7
The 25 stock portfolios produce slants on the orthogonalized market return, RMO. That are
all around 1. In this manner RMO. Which has a standard deviation of 3.55% every month,
represents comparable normal variety in the profits on all the stock portfolios (Jones and
Jensen, 2015). The normal RMO. Return. 0.50% every month (r = 2.61) is additionally a
typical piece of the normal overabundance returns on stocks. Since the RMO slants for stocks
are all around 1. We can translate the normal RMO. Return as the premium for being a stock
(instead of a one-month bill) and sharing general financial exchange hazard The normal
TERM and DEF returns are just 0.06% and 0.02% every month. So they clarify practically
none of the normal abundance returns on stocks.
Question 8
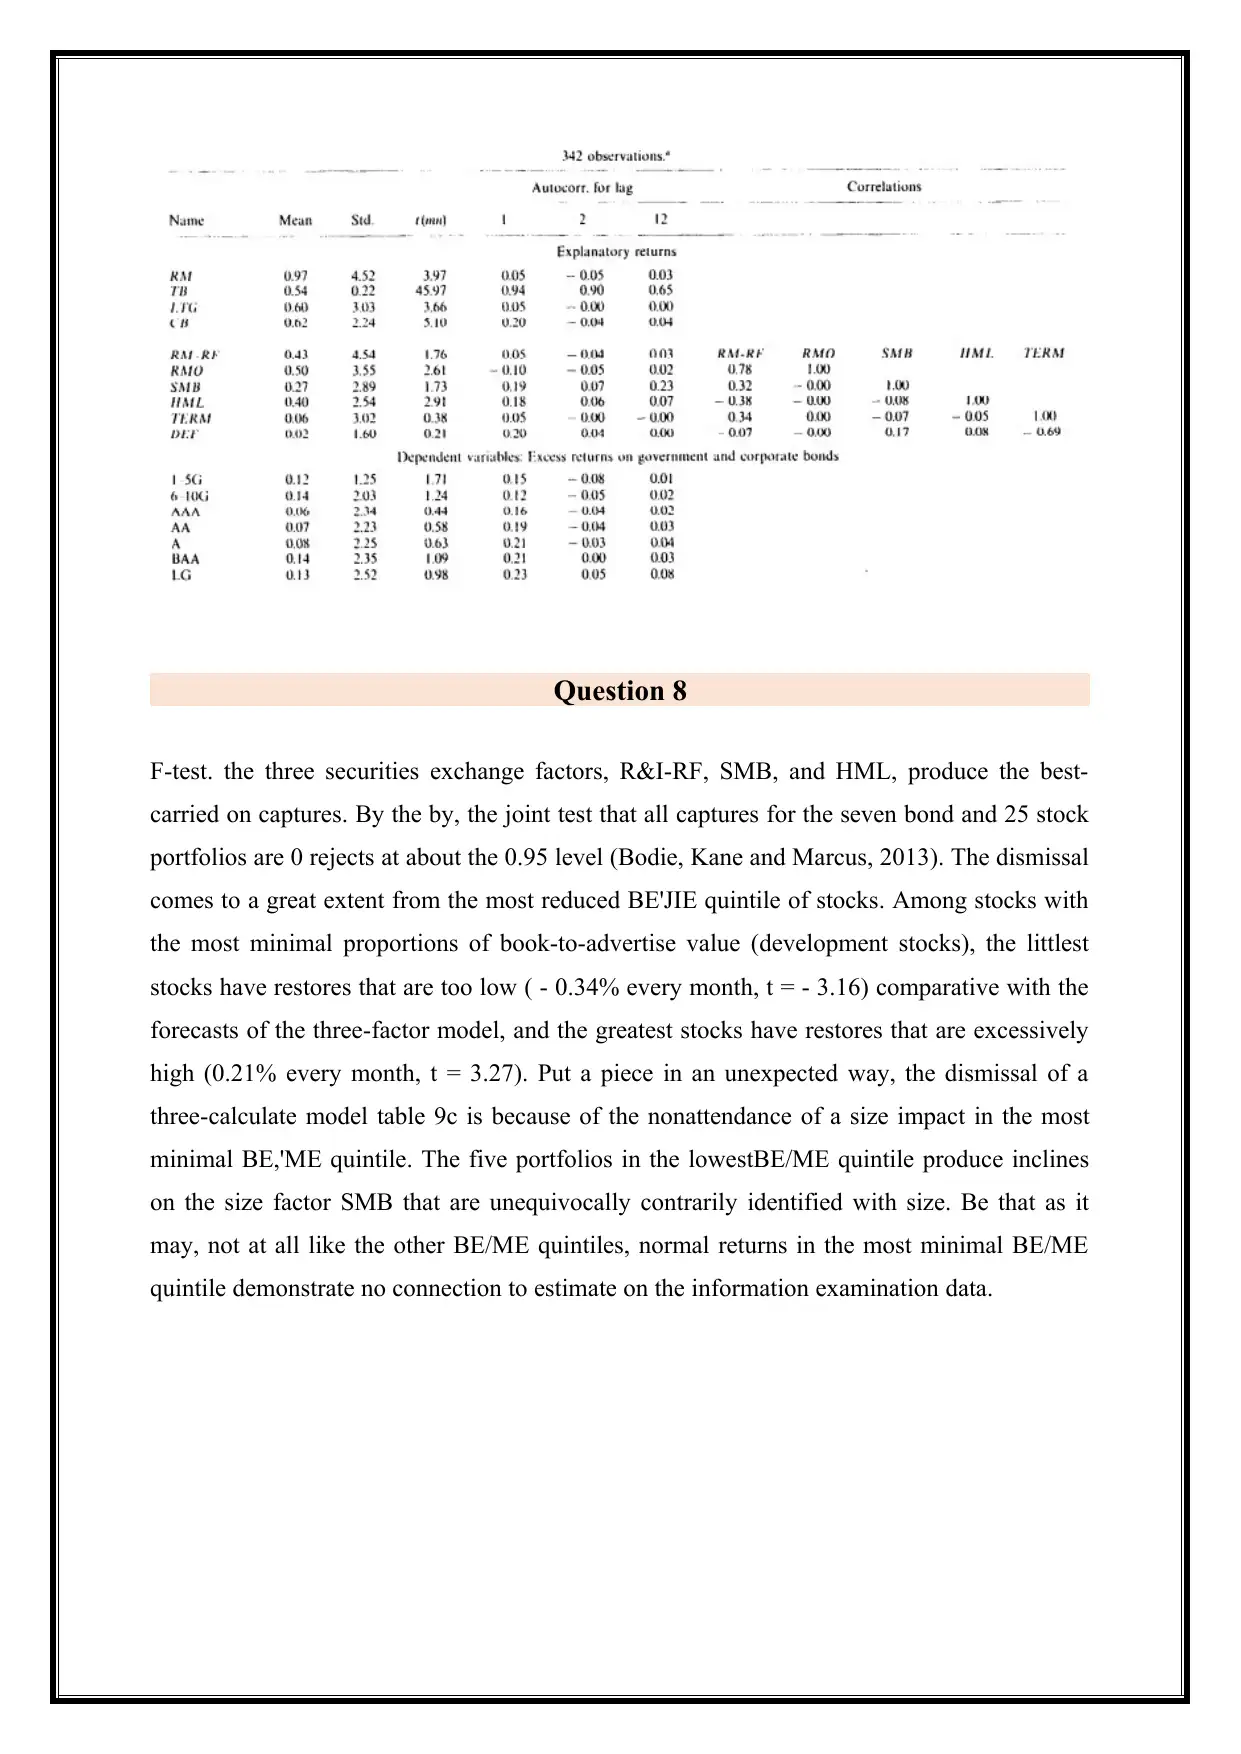
F-test. the three securities exchange factors, R&I-RF, SMB, and HML, produce the best-
carried on captures. By the by, the joint test that all captures for the seven bond and 25 stock
portfolios are 0 rejects at about the 0.95 level (Bodie, Kane and Marcus, 2013). The dismissal
comes to a great extent from the most reduced BE'JIE quintile of stocks. Among stocks with
the most minimal proportions of book-to-advertise value (development stocks), the littlest
stocks have restores that are too low ( - 0.34% every month, t = - 3.16) comparative with the
forecasts of the three-factor model, and the greatest stocks have restores that are excessively
high (0.21% every month, t = 3.27). Put a piece in an unexpected way, the dismissal of a
three-calculate model table 9c is because of the nonattendance of a size impact in the most
minimal BE,'ME quintile. The five portfolios in the lowestBE/ME quintile produce inclines
on the size factor SMB that are unequivocally contrarily identified with size. Be that as it
may, not at all like the other BE/ME quintiles, normal returns in the most minimal BE/ME
quintile demonstrate no connection to estimate on the information examination data.
⊘ This is a preview!⊘
Do you want full access?
Subscribe today to unlock all pages.
Trusted by 1+ million students worldwide
Conclusion
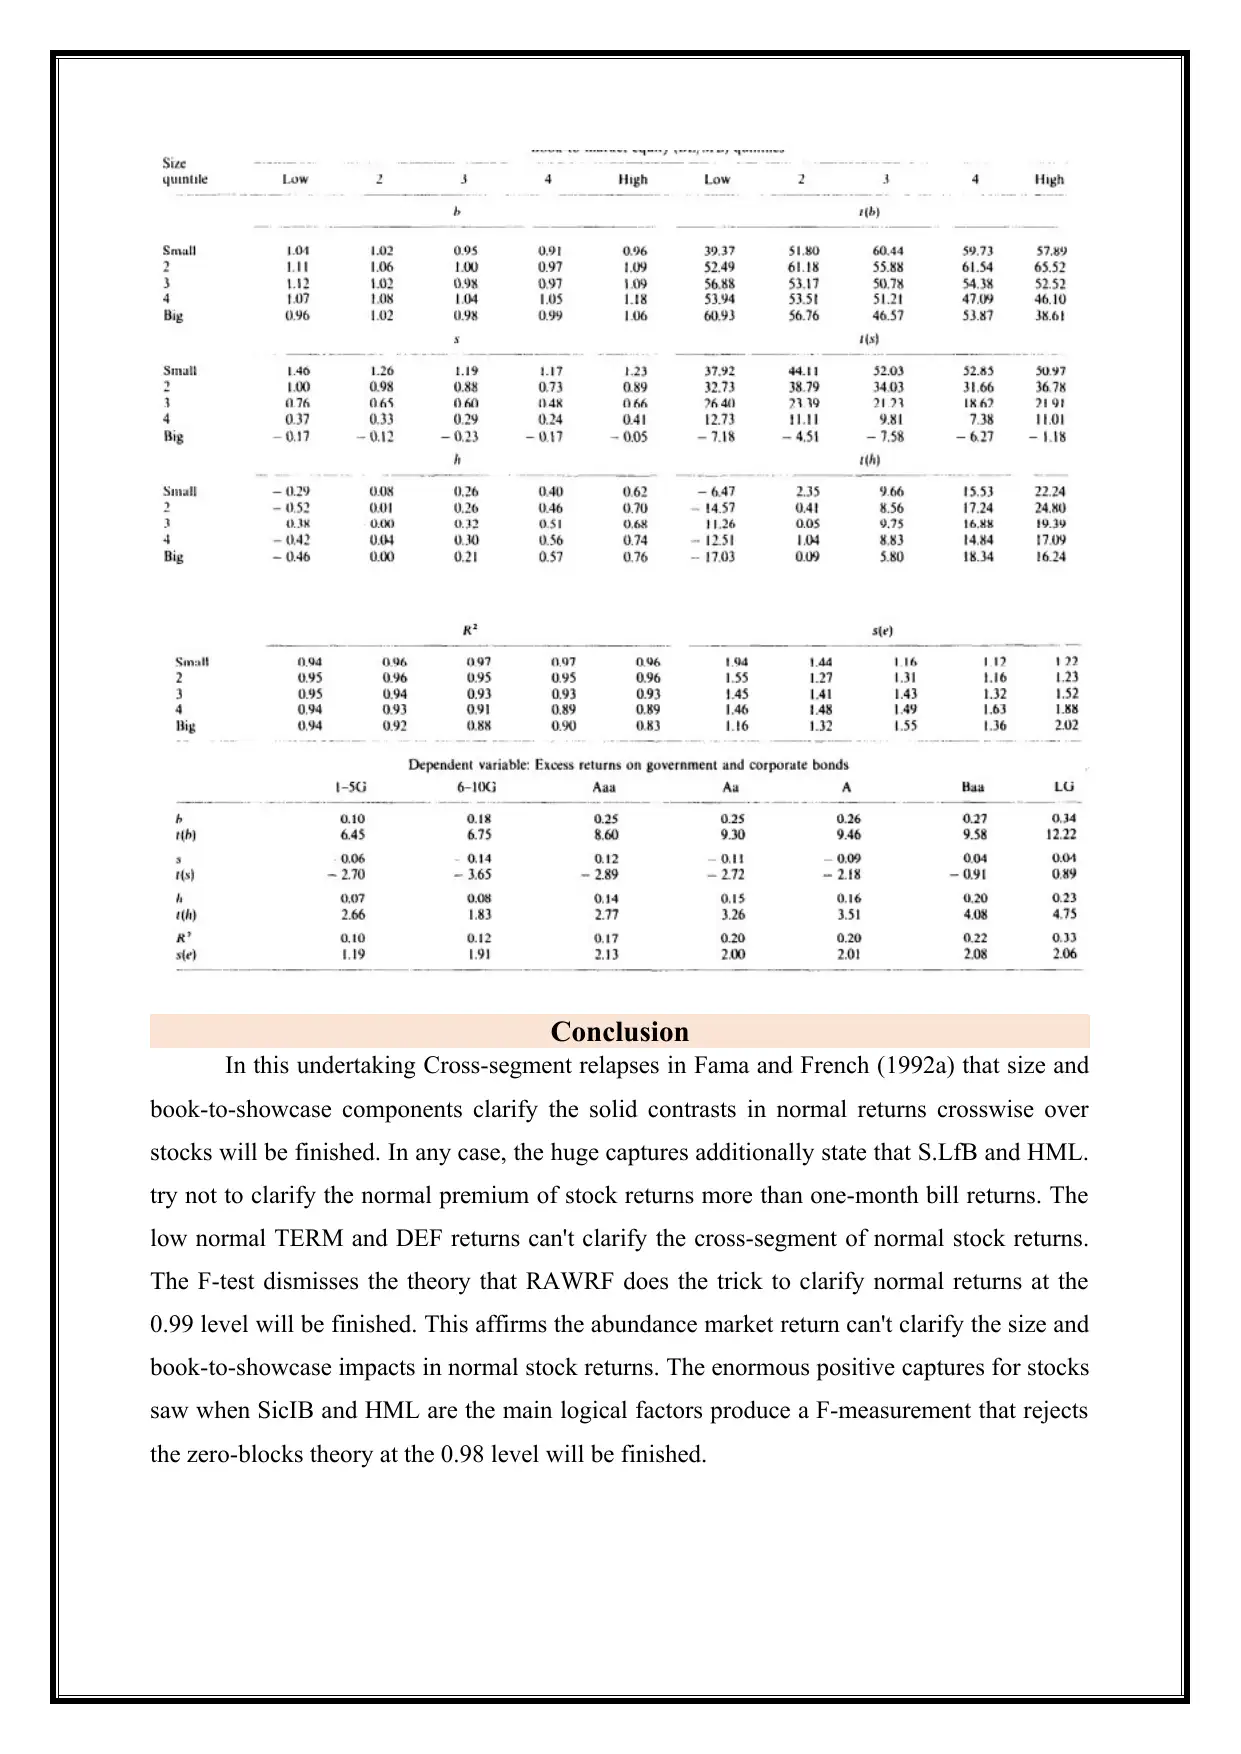
In this undertaking Cross-segment relapses in Fama and French (1992a) that size and
book-to-showcase components clarify the solid contrasts in normal returns crosswise over
stocks will be finished. In any case, the huge captures additionally state that S.LfB and HML.
try not to clarify the normal premium of stock returns more than one-month bill returns. The
low normal TERM and DEF returns can't clarify the cross-segment of normal stock returns.
The F-test dismisses the theory that RAWRF does the trick to clarify normal returns at the
0.99 level will be finished. This affirms the abundance market return can't clarify the size and
book-to-showcase impacts in normal stock returns. The enormous positive captures for stocks
saw when SicIB and HML are the main logical factors produce a F-measurement that rejects
the zero-blocks theory at the 0.98 level will be finished.
Paraphrase This Document
Need a fresh take? Get an instant paraphrase of this document with our AI Paraphraser

Reference
Bodie, Z., Kane, A. and Marcus, A. (2013). Essentials of investments.
Jones, C. and Jensen, G. (2015). Investments. New York: Wiley.
Michalewicz, Z., Chiriac, C., Michalewicz, M. and Schmidt, M. (2010). Adaptive
business intelligence. Canberra (Australia): Springer.
Turban, E., Sharda, R. and Delen, D. (2014). Decision support and business
intelligence systems. Harlow: Pearson.
Williams, S. and Williams, N. (2010). The profit impact of business intelligence. San
Francisco, CA: Morgan Kaufmann.
1 out of 11


Your All-in-One AI-Powered Toolkit for Academic Success.
+13062052269
info@desklib.com
Available 24*7 on WhatsApp / Email
![[object Object]](/_next/static/media/star-bottom.7253800d.svg)
Unlock your academic potential
Copyright © 2020–2026 A2Z Services. All Rights Reserved. Developed and managed by ZUCOL.