Finnish Blog Ad Revenue: Pricing Models and Revenue Estimation
VerifiedAdded on 2023/06/11
|12
|2530
|357
Report
AI Summary
This report estimates the potential ad revenue for a Finnish lifestyle blog focusing on travel and fashion, considering CPM, CPC, and CPA pricing models. Assuming 25,000 unique weekly visitors and 100,000 pages served, the analysis calculates potential revenue from CPM-based banner ads, CPA-based affiliate links, and CPC-based contextual text ads. It uses available data to estimate click-through rates and conversion rates specific to Finland, acknowledging the country's lower digital advertising engagement compared to markets like the United States. The report concludes with an estimated total monthly revenue, highlighting the impact of each advertising method and emphasizing the importance of optimizing ad placement and content relevance to maximize earnings. The blog revenue is estimated at 608.67 EUR combining all the three methods of advertisement.
1
Running Head: SITE REVENUE
Sight Revenue
Name
Institution
Running Head: SITE REVENUE
Sight Revenue
Name
Institution
Paraphrase This Document
Need a fresh take? Get an instant paraphrase of this document with our AI Paraphraser
2
Running Head: SITE REVENUE
Pricing models on online advertising
The world is now moving towards the digital advertising strategies that allude to maximize the
profitability and awareness of a business. Many kinds of businesses are therefore hiring
individual experts in the field of digital marketing who are well familiar with the click funnels
operation and social media management. Those individuals are paid either when an ad is clicked,
seen or even both according to an advertising company (Tran, H, 2017). More so, the cost of
advertising varies from country to country and from continent to continent. It is not all the
continents that many people can see a product and at the same time make a purchase. For
example, developing continents like Africa is not the same as Europe.
The model used to conduct the ad also determines how much it can make per day. Some of the
models used have cost per mile/impression (CPM), cost per click (CPC) or pay per click (PPC)
and Per User action (CPA) (Chaouki, S. M., Mitchell, T. P., Burns, C. H., & Bulmash, S. L,
2018). The cost model per method is different as every method operates differently (Tran, H,
2017). The United States is the largest digital advertising market and according to the estimates
made in 2016, united states used more than $180 billion on advertising. China being the second
in that arena, the united states double its spending on advertising. According to Kantar TNS
Finland (2017), digital advertising cost was 33.3% of the total cost.
A total of 82.7 euros were spent in the first three months which lead to a change of 10.3% as
compared to prior year. The table below shows how Finland operated on its digital advertising
platforms and the spending in the year 2017 extracted from emarketer.com.
Digital advertising in Finland in 2017
Digital ad spending Percentage change
3
Running Head: SITE REVENUE
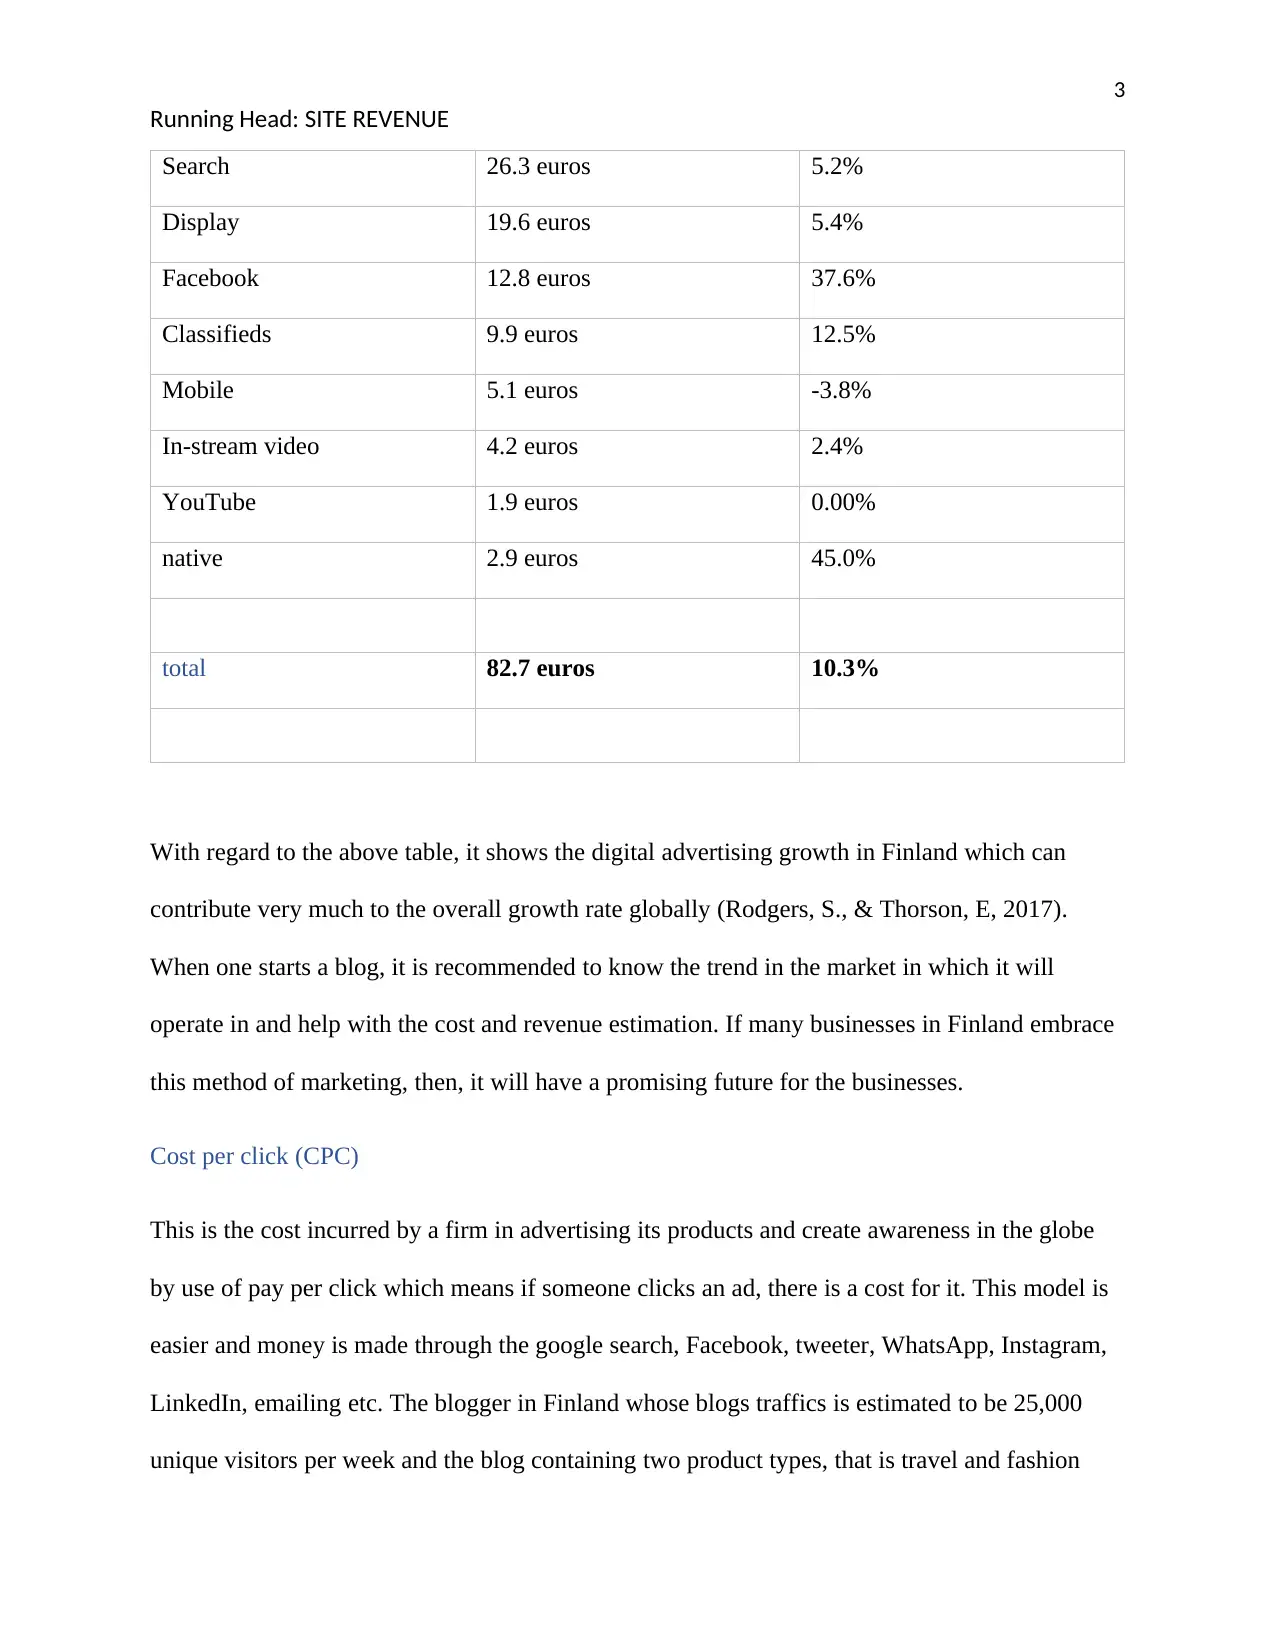
Search 26.3 euros 5.2%
Display 19.6 euros 5.4%
Facebook 12.8 euros 37.6%
Classifieds 9.9 euros 12.5%
Mobile 5.1 euros -3.8%
In-stream video 4.2 euros 2.4%
YouTube 1.9 euros 0.00%
native 2.9 euros 45.0%
total 82.7 euros 10.3%
With regard to the above table, it shows the digital advertising growth in Finland which can
contribute very much to the overall growth rate globally (Rodgers, S., & Thorson, E, 2017).
When one starts a blog, it is recommended to know the trend in the market in which it will
operate in and help with the cost and revenue estimation. If many businesses in Finland embrace
this method of marketing, then, it will have a promising future for the businesses.
Cost per click (CPC)
This is the cost incurred by a firm in advertising its products and create awareness in the globe
by use of pay per click which means if someone clicks an ad, there is a cost for it. This model is
easier and money is made through the google search, Facebook, tweeter, WhatsApp, Instagram,
LinkedIn, emailing etc. The blogger in Finland whose blogs traffics is estimated to be 25,000
unique visitors per week and the blog containing two product types, that is travel and fashion
Running Head: SITE REVENUE
Search 26.3 euros 5.2%
Display 19.6 euros 5.4%
Facebook 12.8 euros 37.6%
Classifieds 9.9 euros 12.5%
Mobile 5.1 euros -3.8%
In-stream video 4.2 euros 2.4%
YouTube 1.9 euros 0.00%
native 2.9 euros 45.0%
total 82.7 euros 10.3%
With regard to the above table, it shows the digital advertising growth in Finland which can
contribute very much to the overall growth rate globally (Rodgers, S., & Thorson, E, 2017).
When one starts a blog, it is recommended to know the trend in the market in which it will
operate in and help with the cost and revenue estimation. If many businesses in Finland embrace
this method of marketing, then, it will have a promising future for the businesses.
Cost per click (CPC)
This is the cost incurred by a firm in advertising its products and create awareness in the globe
by use of pay per click which means if someone clicks an ad, there is a cost for it. This model is
easier and money is made through the google search, Facebook, tweeter, WhatsApp, Instagram,
LinkedIn, emailing etc. The blogger in Finland whose blogs traffics is estimated to be 25,000
unique visitors per week and the blog containing two product types, that is travel and fashion
⊘ This is a preview!⊘
Do you want full access?
Subscribe today to unlock all pages.
Trusted by 1+ million students worldwide
4
Running Head: SITE REVENUE
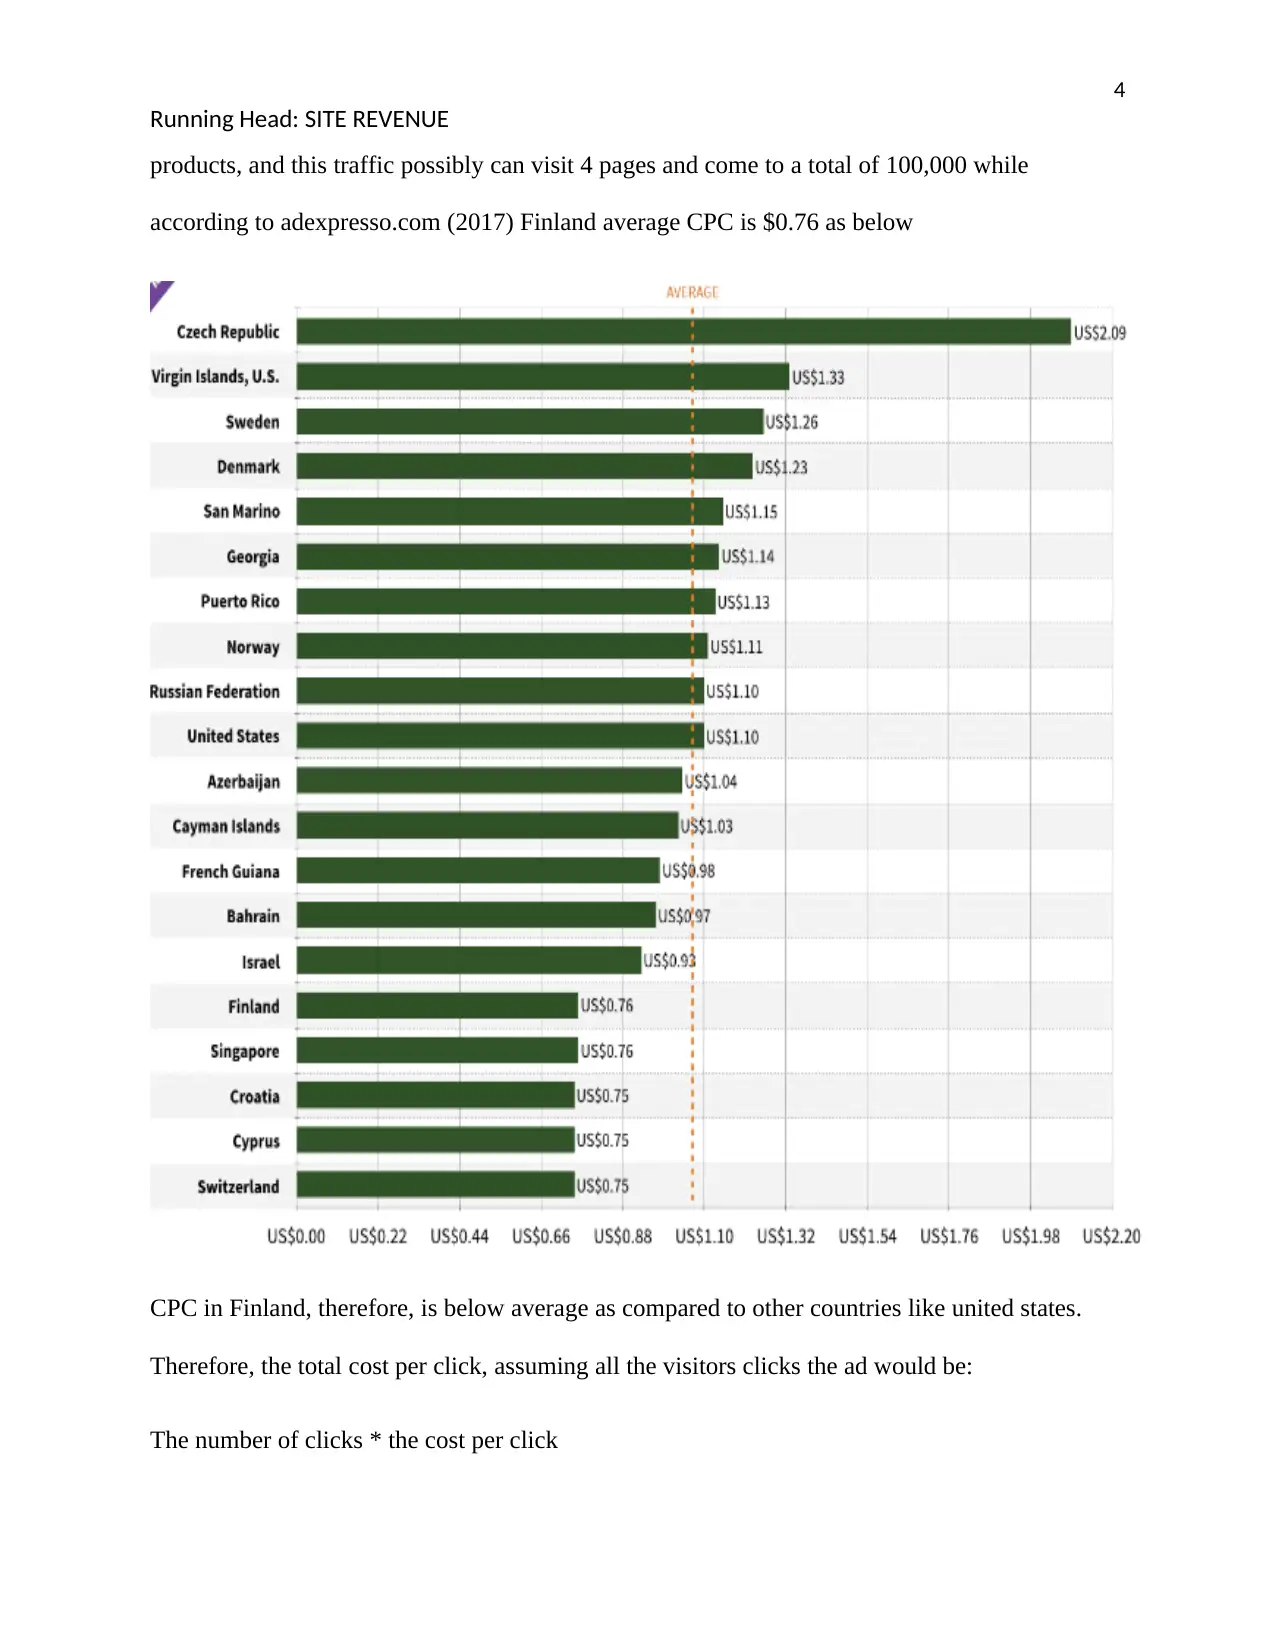
products, and this traffic possibly can visit 4 pages and come to a total of 100,000 while
according to adexpresso.com (2017) Finland average CPC is $0.76 as below
CPC in Finland, therefore, is below average as compared to other countries like united states.
Therefore, the total cost per click, assuming all the visitors clicks the ad would be:
The number of clicks * the cost per click
Running Head: SITE REVENUE
products, and this traffic possibly can visit 4 pages and come to a total of 100,000 while
according to adexpresso.com (2017) Finland average CPC is $0.76 as below
CPC in Finland, therefore, is below average as compared to other countries like united states.
Therefore, the total cost per click, assuming all the visitors clicks the ad would be:
The number of clicks * the cost per click
Paraphrase This Document
Need a fresh take? Get an instant paraphrase of this document with our AI Paraphraser
5
Running Head: SITE REVENUE
100000*0.76=$76000
The data researched by smart insights in January 2018 shows that Finland has a very small figure
for click-through rate as compared to other countries like the United Arab Emirates. The United
Arab Emirates have a click-through rate (CRT) of 0.18% while Finland has only 0.05%. this
clearly tells why the CPC operator does not earn much in Finland markets. The cash flows are
very minimal. United, on the other hand, is superior to the filipin by 33% Therefore,
125*0.65 the estimated CPC for one week which is
81.25*4weeks= 325 EUR per month
This sounds a good income for the advertiser but if the ad is run in the other countries like the
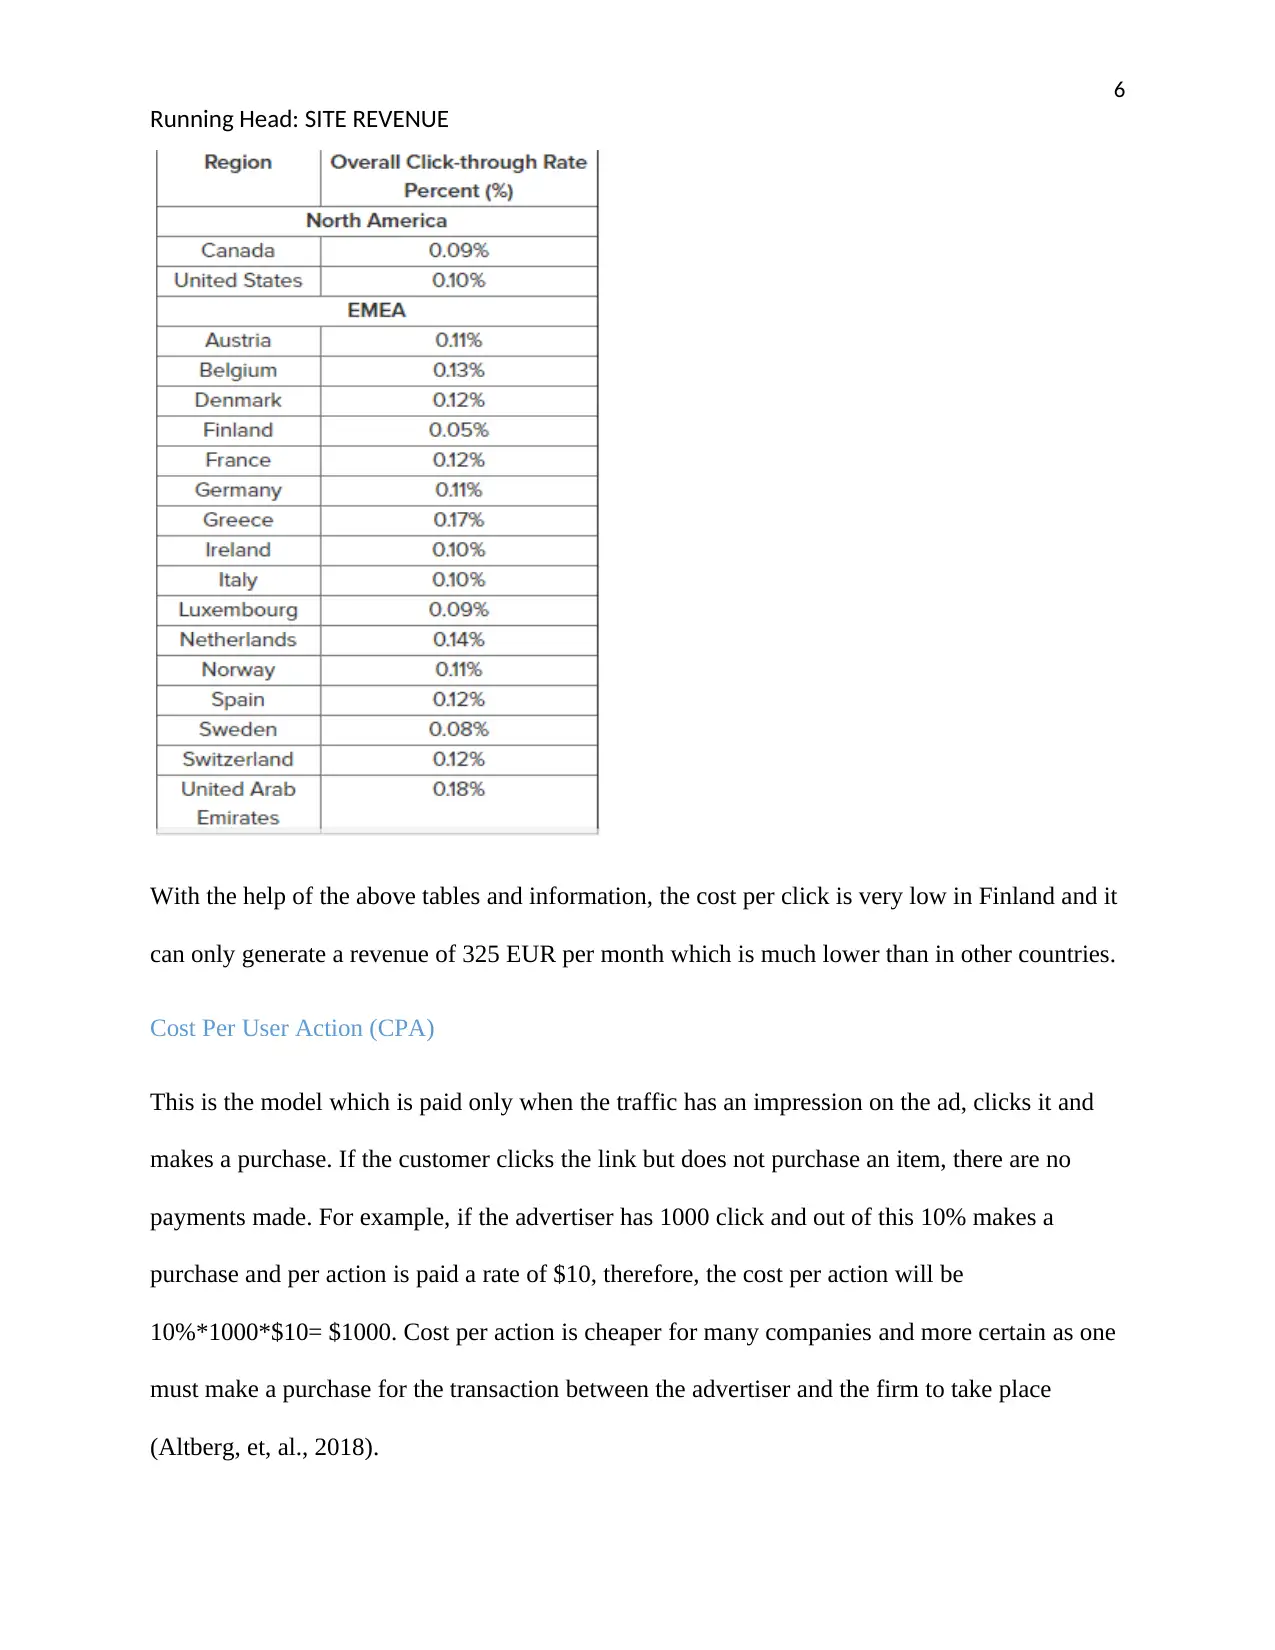
United States, the cost may be much higher. The table below shows the click-through rate per
country that does well in North America, Europe, and the middle east.
Running Head: SITE REVENUE
100000*0.76=$76000
The data researched by smart insights in January 2018 shows that Finland has a very small figure
for click-through rate as compared to other countries like the United Arab Emirates. The United
Arab Emirates have a click-through rate (CRT) of 0.18% while Finland has only 0.05%. this
clearly tells why the CPC operator does not earn much in Finland markets. The cash flows are
very minimal. United, on the other hand, is superior to the filipin by 33% Therefore,
125*0.65 the estimated CPC for one week which is
81.25*4weeks= 325 EUR per month
This sounds a good income for the advertiser but if the ad is run in the other countries like the
United States, the cost may be much higher. The table below shows the click-through rate per
country that does well in North America, Europe, and the middle east.
6
Running Head: SITE REVENUE
With the help of the above tables and information, the cost per click is very low in Finland and it
can only generate a revenue of 325 EUR per month which is much lower than in other countries.
Cost Per User Action (CPA)
This is the model which is paid only when the traffic has an impression on the ad, clicks it and
makes a purchase. If the customer clicks the link but does not purchase an item, there are no
payments made. For example, if the advertiser has 1000 click and out of this 10% makes a
purchase and per action is paid a rate of $10, therefore, the cost per action will be
10%*1000*$10= $1000. Cost per action is cheaper for many companies and more certain as one
must make a purchase for the transaction between the advertiser and the firm to take place
(Altberg, et, al., 2018).
⊘ This is a preview!⊘
Do you want full access?
Subscribe today to unlock all pages.
Trusted by 1+ million students worldwide
7
Running Head: SITE REVENUE
Since this is an affiliate link, not all clicked will make a purchase, but just a few. Many
businesses prefer the ratio of return on investment and the cost per acquisition rate to be 5:1
(Altberg, et., al 2018) . This means, when a business spends 5 dollars on advertising, then, five
dollars are generated. If the business is charged a 20% conversion rate, it gains 80% of the
expected return on investment. The company spends less and other models like cost per click
may spend more if the link goes viral, and the company will incur o lot of charges, and the
advertiser will earn more. Therefore: by use of the above demonstration, there are 25000 clicks
per week and the blog contains two products, travel, and fashion products. Both have a
percentage of 50% on the blog. Cost per action is 20% of return on investment, therefore, if the
blog sells products costing $100, the affiliate link will earn the advertiser 20%*100, which is
$20.
The cash flow for the month will be as follows assuming 10% of the click-through rate;
0.03*0.2*100*277.78
=166.67
Cost per mile/ impression
This is the cost incurred by a company for every impression made on the link even though the
purchase is not made immediately. Here, the objective of the firm is to create awareness. This is
the oldest advertising method ever existed. A good example of this is where, a video in youtube
Is linked with an ad, which, when the viewers are busy viewing the video, or before they start
viewing, an ad appears. In this, the owner of the video is paid may be one dollar for every 1000
viewers assuming all the viewers saw an ad.
Paraphrase This Document
Need a fresh take? Get an instant paraphrase of this document with our AI Paraphraser
8
Running Head: SITE REVENUE
The cost per mile model is used where the company I not looking directly at the profit and
capital maximization but looks indirectly through making awar5eness that the coma[nay really
exists. The cost per mile. Is earned by the advertiser when he advertises the link and people see
it.
This method is widely used worldwide by use of youtube, facebook, and other social platforms
(Altberg, et., al 2018). Cost per mile rate of income is similar in most of the countries, for
example, youtube will pay one dollar, no matter where you are. Anybody within the globe can
view the content. For some social media platforms like Facebook, one can set where the ad will
run (Rodgers, S., & Thorson, E, 2017). For example, if the target population is in Europe,
Facebook has an option that enables an advertiser to reach the target audience.
The estimated CPM in united states is around $2 to 3. The formula for getting revenue per mile
is as bellow.
Revenue per mile = (Cost of 1 Unit of a Media Program) / (Size of Media Program's Audience) x
1,000
the revenue per mile is the revenue that a company gets when customers see the advert and make
a purchase immediately. The company then takes the sales less cost and the revenue is obtained.
The cost is the payments for the advertisement to the advertiser (Chaouki, S. M., Mitchell, T. P.,
Burns, C. H., & Bulmash, S. L, 2018).
Cost Per Mile/thousand estimation in the blog (travel and fashion)
If the cost per mile in united states is $2-3, and as stated earlier, united states are the biggest
advertising market in the world, so Finland must be lower than this. The indication shown by the
9
Running Head: SITE REVENUE
above argument is that Finland has a lower click-through rate, and the same applies to the cost
per mile/thousand. More so, in youtube advertisement, it might be the same.
Every advertiser is looking forward to attracting more traffics to increase the clickthrough rate.
They can wish to add as many ads as possible on one blog page. For the advertisers using
Adsense, it had some rules that you could not exceed 3 ads on one webpage. But for the
premium, the advertisers enjoyed adding up to 6 ads on one page. Later, the absence revised their
policy and now one can add unlimited numbers of ads. Adding too many ads may lead to the
content not making sense (Rodgers, S., & Thorson, E, 2017). I maximum of 6 ads are good to go.
For the affiliate links, the target is the content that is discussed in the blog. For the travel, the
blog should be clear on the travel booking, hotel and time for departure, for the fashion, the
target audience is those who can make purchases of clothes and shoes. It should be written in a
simple English or any other language that is understood by the audience, attractive, convincing
and touching (Rodgers, S., & Thorson, E, 2017). These two blogs advertise different things and
therefore, the advertiser should be careful on the ad conduction.
Finland has not grown very much in terms of digital advertising as compared to united states. In
the graph above, it shows the status of Finland and the results for CPC and CPA is below
average. This means, even the cost per thousand, the performance is not different. This blog will
not have more than the average cost per thousand because the number of traffic is lower than in
other countries like the United States and the United Arab Emirates (Rodgers, S., & Thorson, E,
2017).
The average order value made through the affiliate links is $340 and those made by hotels
official booking page is about $600. This is according to the hotel champ website. This shows
⊘ This is a preview!⊘
Do you want full access?
Subscribe today to unlock all pages.
Trusted by 1+ million students worldwide
10
Running Head: SITE REVENUE
that hotels should invest heavily on the official landing page as it keeps good relations with other
affiliates.
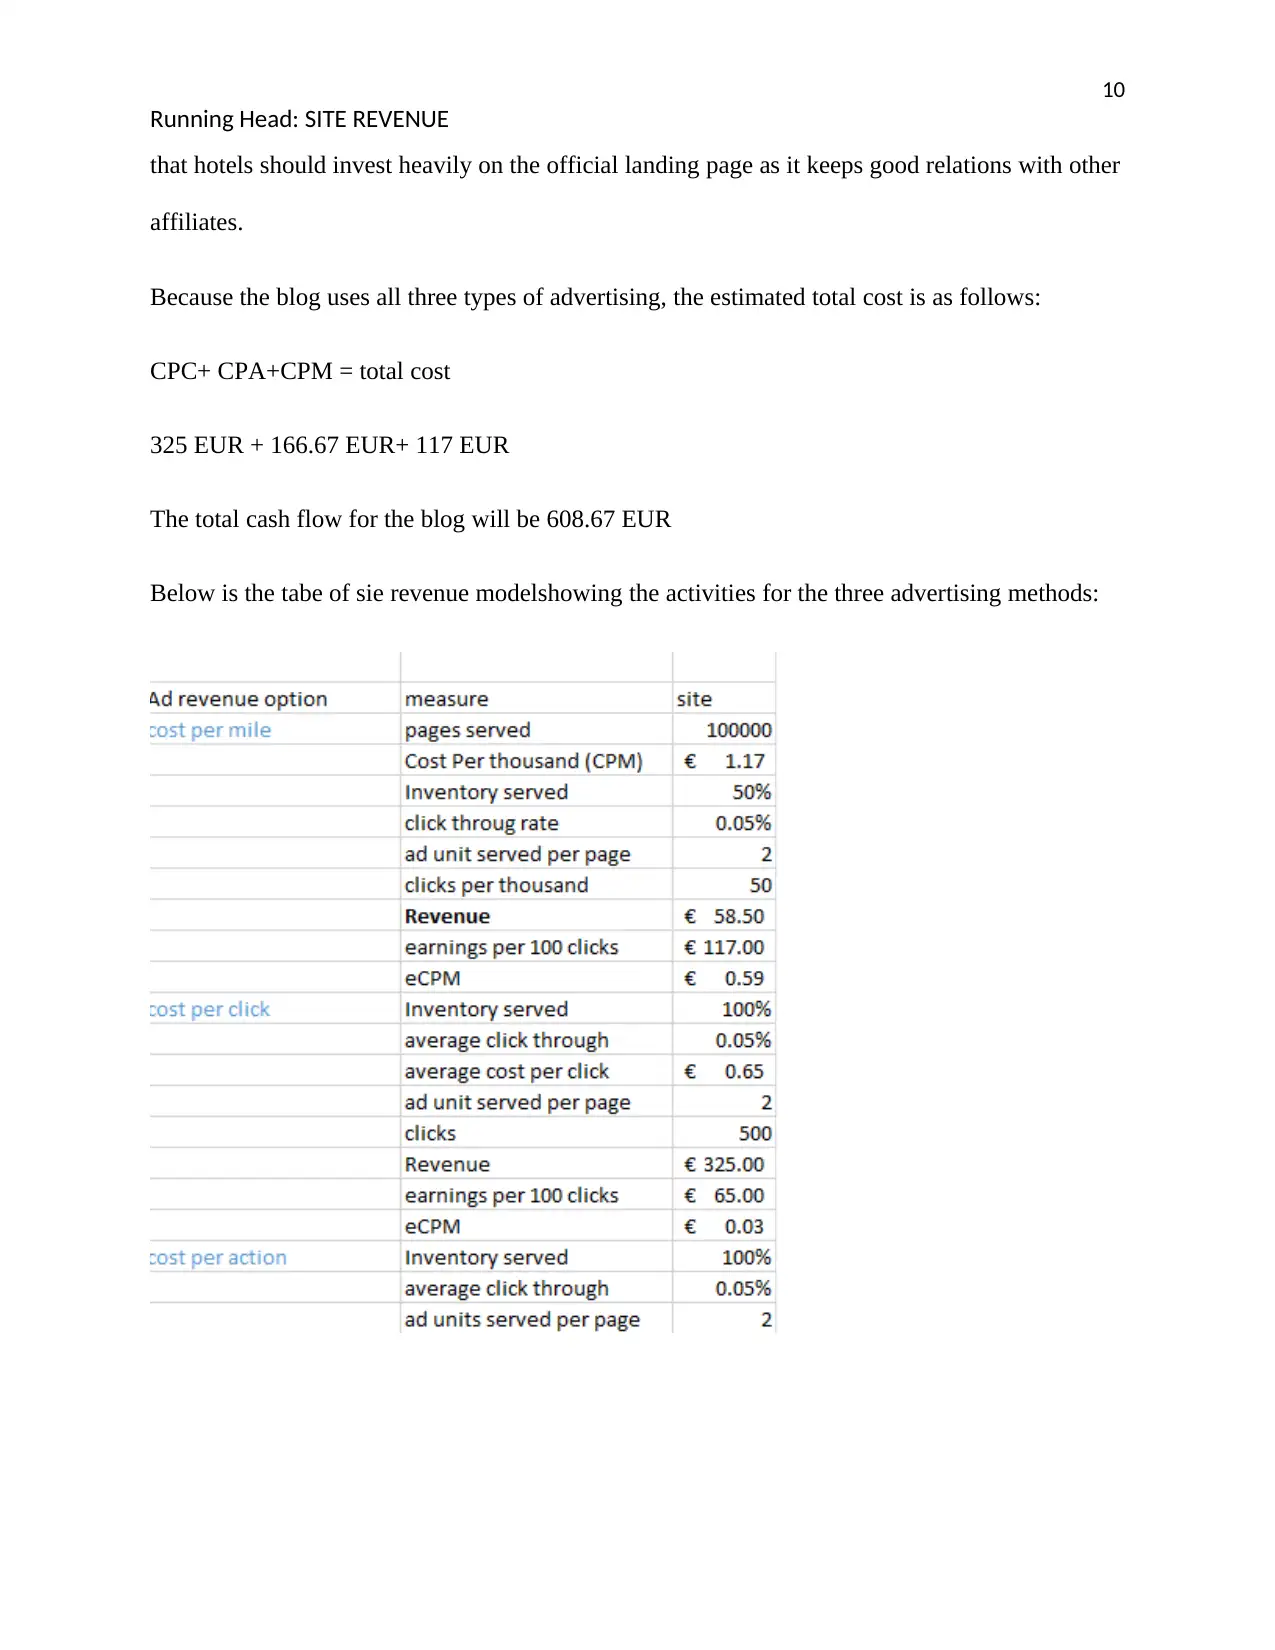
Because the blog uses all three types of advertising, the estimated total cost is as follows:
CPC+ CPA+CPM = total cost
325 EUR + 166.67 EUR+ 117 EUR
The total cash flow for the blog will be 608.67 EUR
Below is the tabe of sie revenue modelshowing the activities for the three advertising methods:
Running Head: SITE REVENUE
that hotels should invest heavily on the official landing page as it keeps good relations with other
affiliates.
Because the blog uses all three types of advertising, the estimated total cost is as follows:
CPC+ CPA+CPM = total cost
325 EUR + 166.67 EUR+ 117 EUR
The total cash flow for the blog will be 608.67 EUR
Below is the tabe of sie revenue modelshowing the activities for the three advertising methods:
Paraphrase This Document
Need a fresh take? Get an instant paraphrase of this document with our AI Paraphraser
11
Running Head: SITE REVENUE
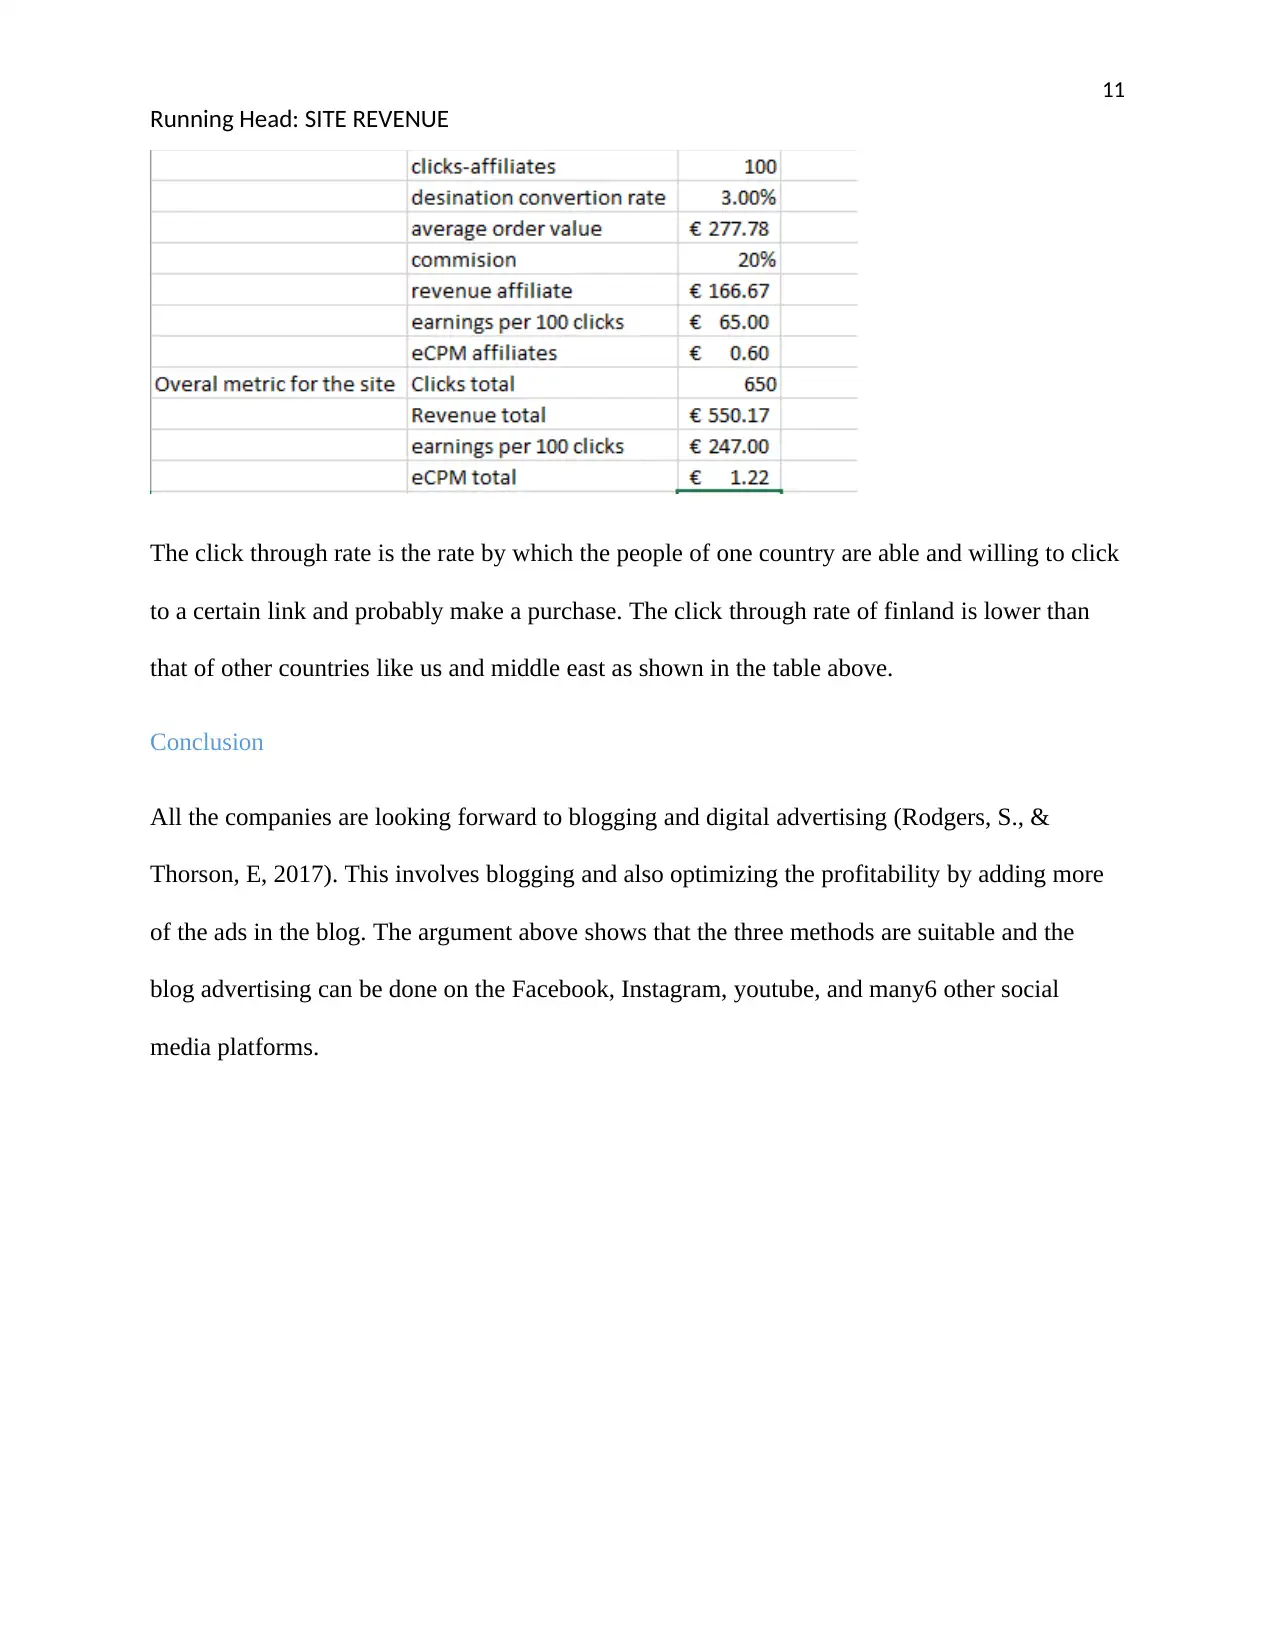
The click through rate is the rate by which the people of one country are able and willing to click
to a certain link and probably make a purchase. The click through rate of finland is lower than
that of other countries like us and middle east as shown in the table above.
Conclusion
All the companies are looking forward to blogging and digital advertising (Rodgers, S., &
Thorson, E, 2017). This involves blogging and also optimizing the profitability by adding more
of the ads in the blog. The argument above shows that the three methods are suitable and the
blog advertising can be done on the Facebook, Instagram, youtube, and many6 other social
media platforms.
Running Head: SITE REVENUE
The click through rate is the rate by which the people of one country are able and willing to click
to a certain link and probably make a purchase. The click through rate of finland is lower than
that of other countries like us and middle east as shown in the table above.
Conclusion
All the companies are looking forward to blogging and digital advertising (Rodgers, S., &
Thorson, E, 2017). This involves blogging and also optimizing the profitability by adding more
of the ads in the blog. The argument above shows that the three methods are suitable and the
blog advertising can be done on the Facebook, Instagram, youtube, and many6 other social
media platforms.
12
Running Head: SITE REVENUE
References
Altberg, E., Faber, S., Hirson, R., Van der Linden, S., Lyon, B. H., & Manca, P. G. (2018). U.S.
Patent No. 9,984,377. Washington, DC: U.S. Patent and Trademark Office.
Chaouki, S. M., Mitchell, T. P., Burns, C. H., & Bulmash, S. L. (2018). U.S. Patent No.
9,996,856. Washington, DC: U.S. Patent and Trademark Office.
Rodgers, S., & Thorson, E. (Eds.). (2017). Digital advertising: Theory and research. Taylor &
Francis.
Tran, H. (2017). U.S. Patent No. 9,842,337. Washington, DC: U.S. Patent and Trademark
Office.
⊘ This is a preview!⊘
Do you want full access?
Subscribe today to unlock all pages.
Trusted by 1+ million students worldwide
1 out of 12

Your All-in-One AI-Powered Toolkit for Academic Success.
+13062052269
info@desklib.com
Available 24*7 on WhatsApp / Email
![[object Object]](/_next/static/media/star-bottom.7253800d.svg)
Unlock your academic potential
Copyright © 2020–2025 A2Z Services. All Rights Reserved. Developed and managed by ZUCOL.