First Abu Dhabi Bank: Performance Evaluation and Financial Analysis
VerifiedAdded on 2023/06/04
|17
|2053
|450
Report
AI Summary
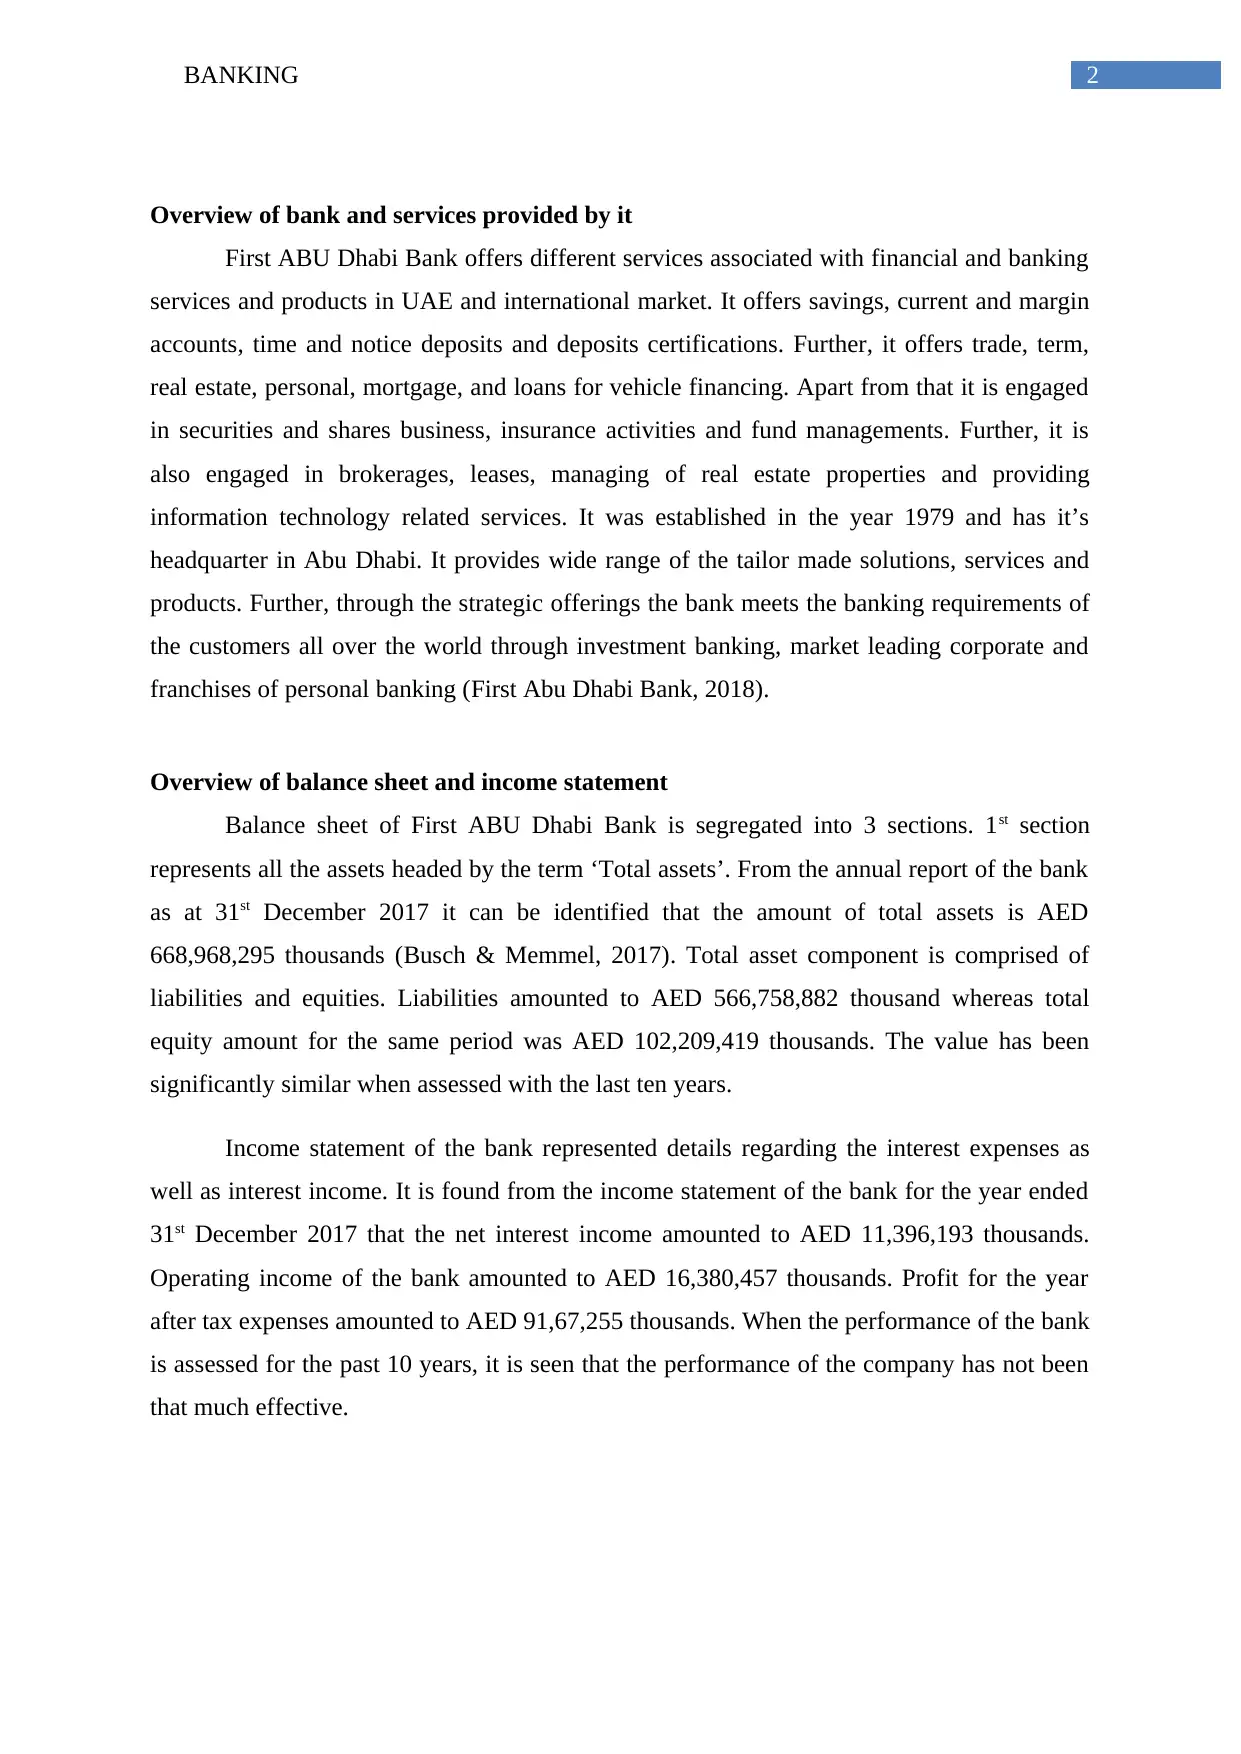
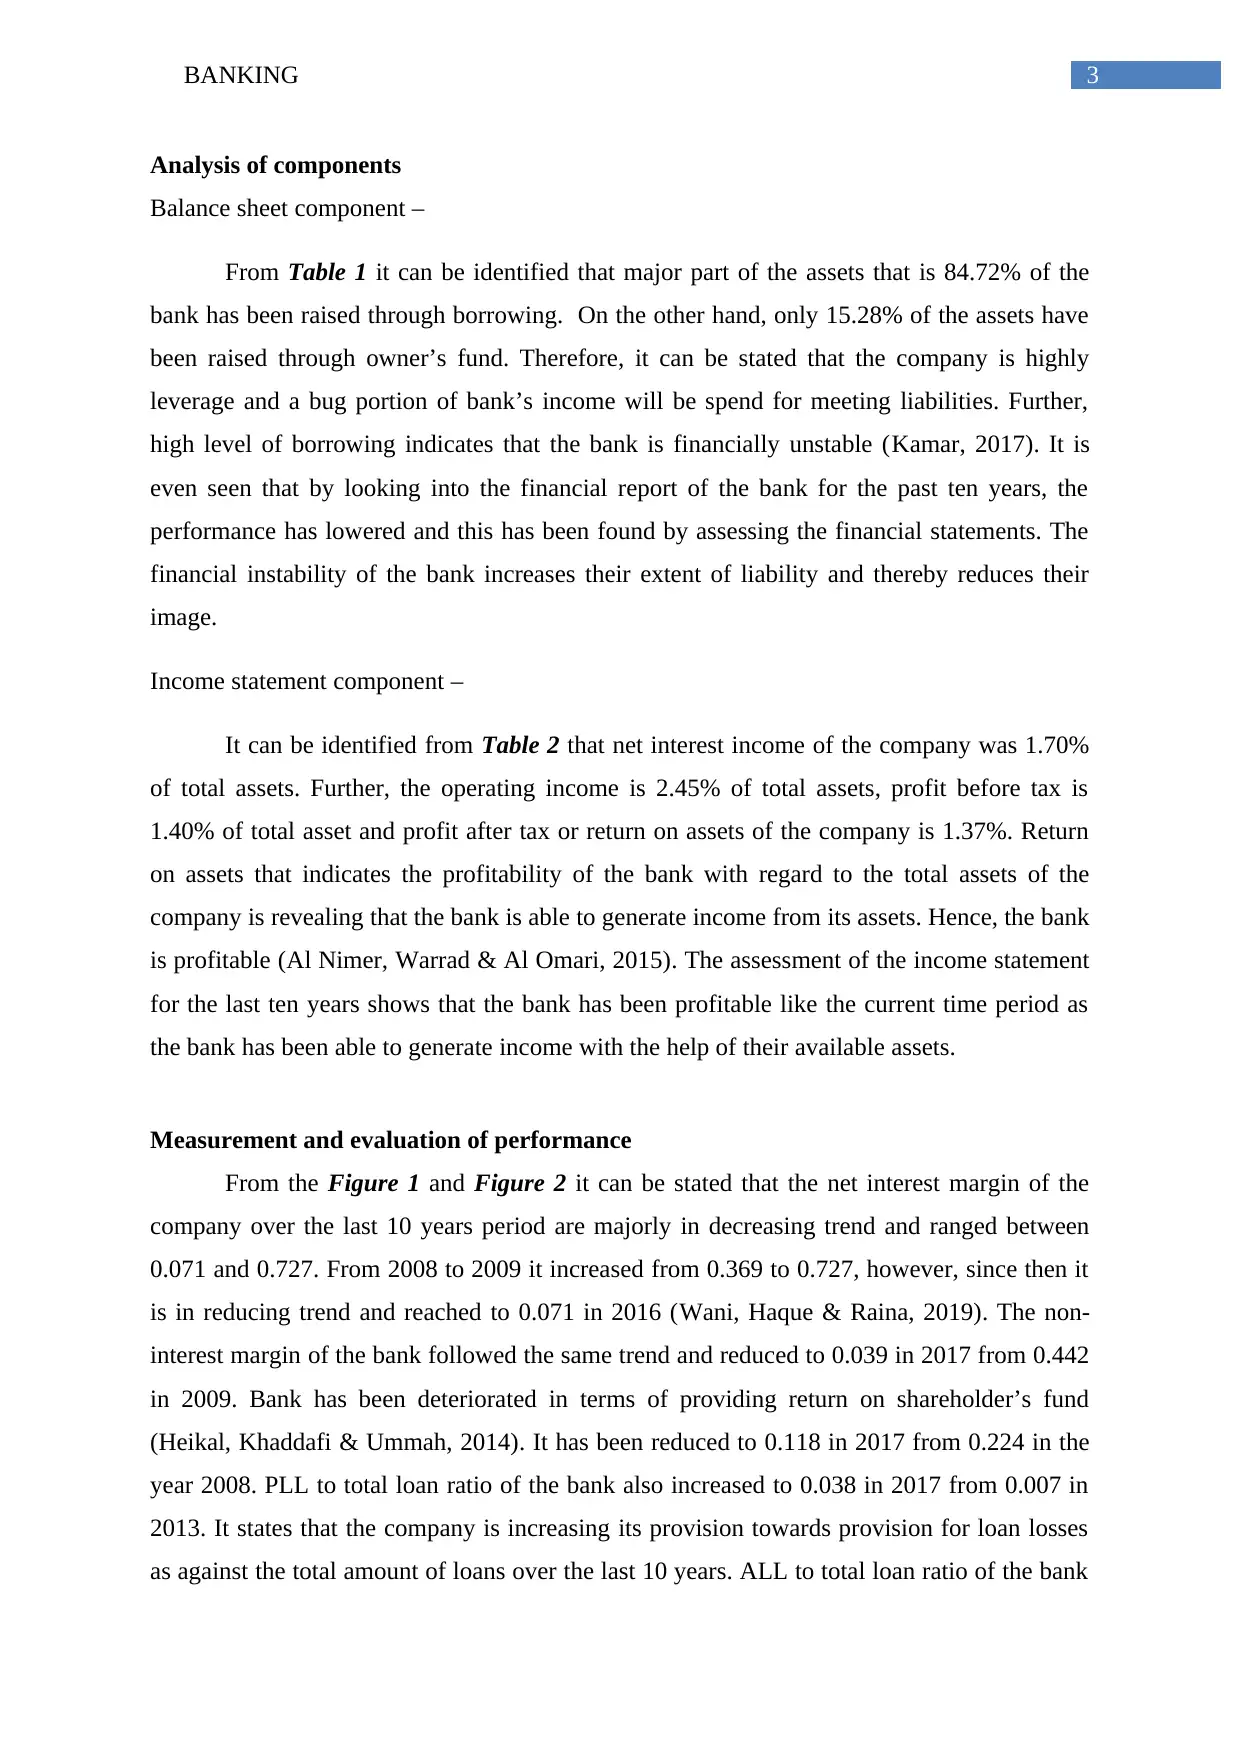
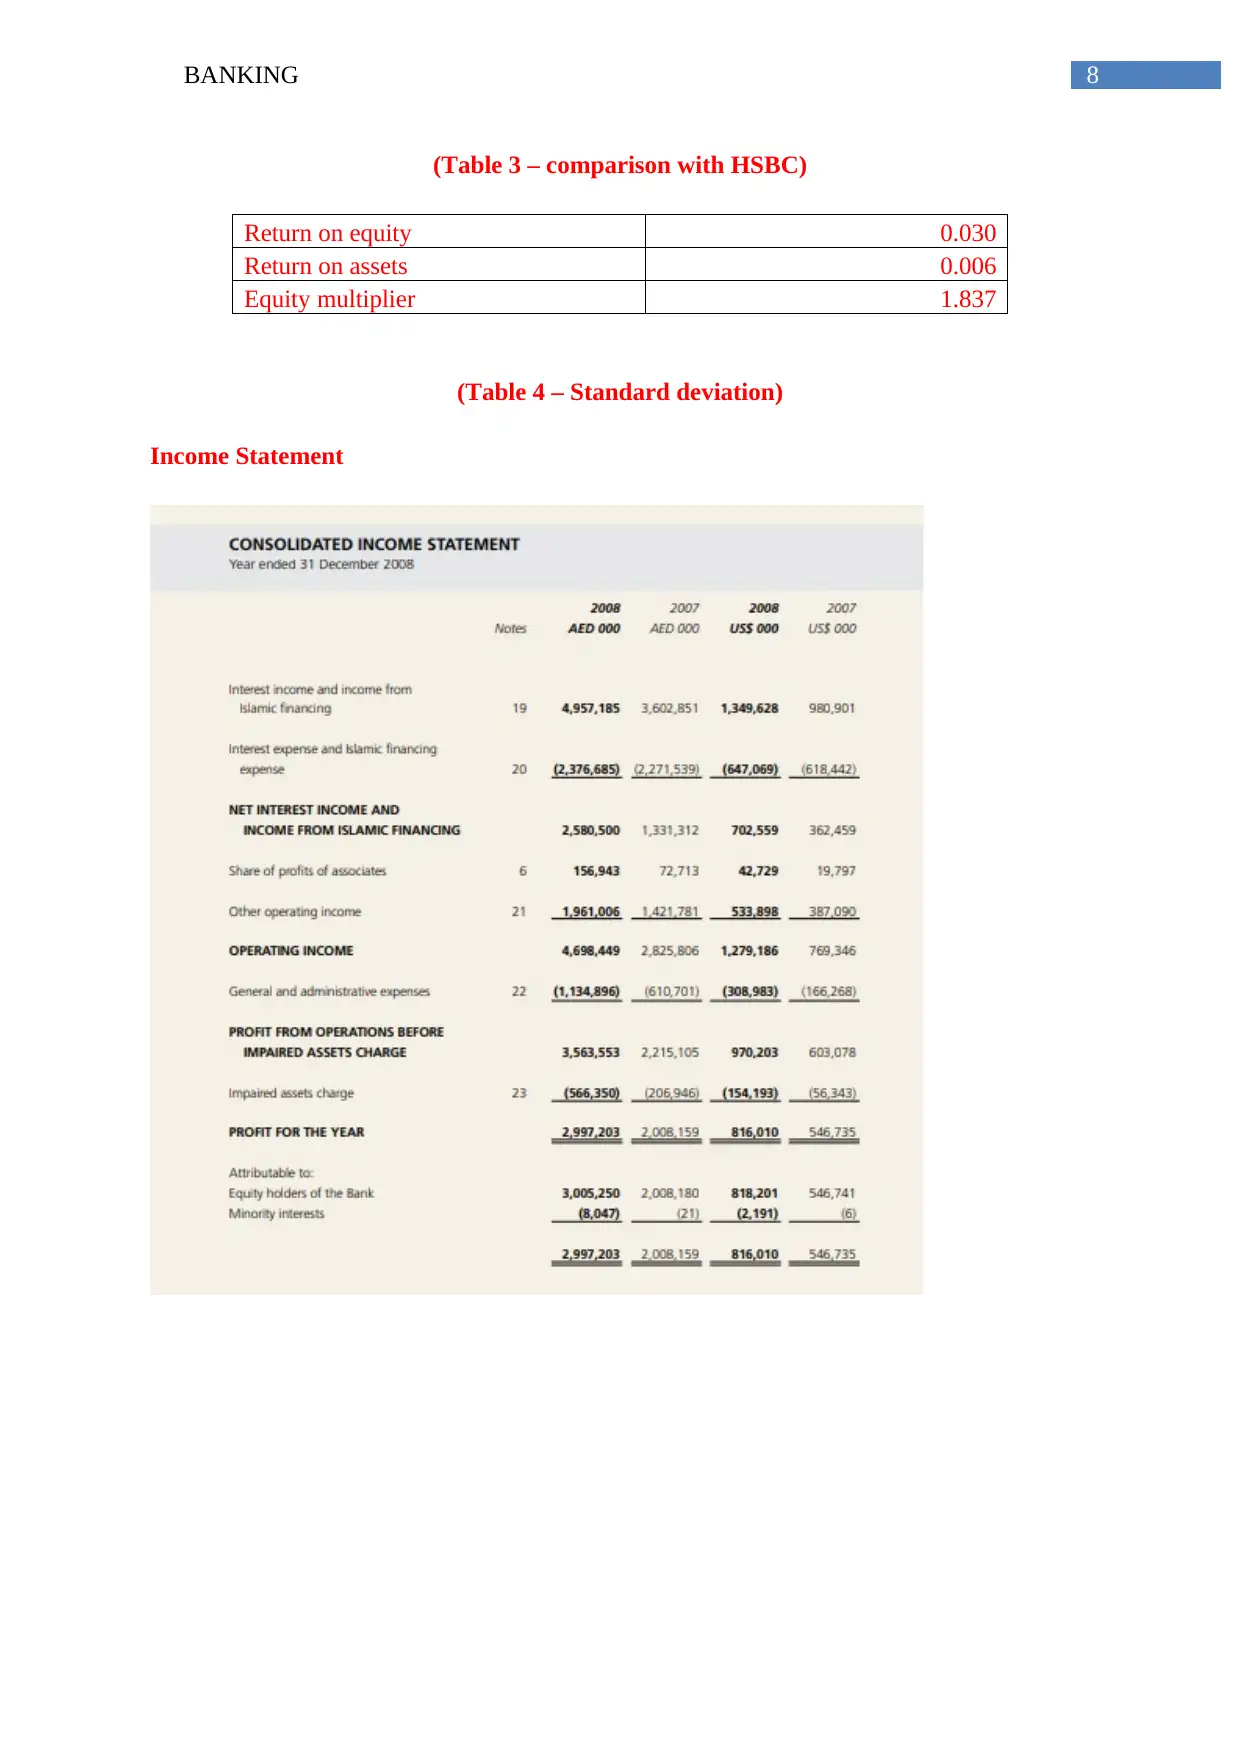
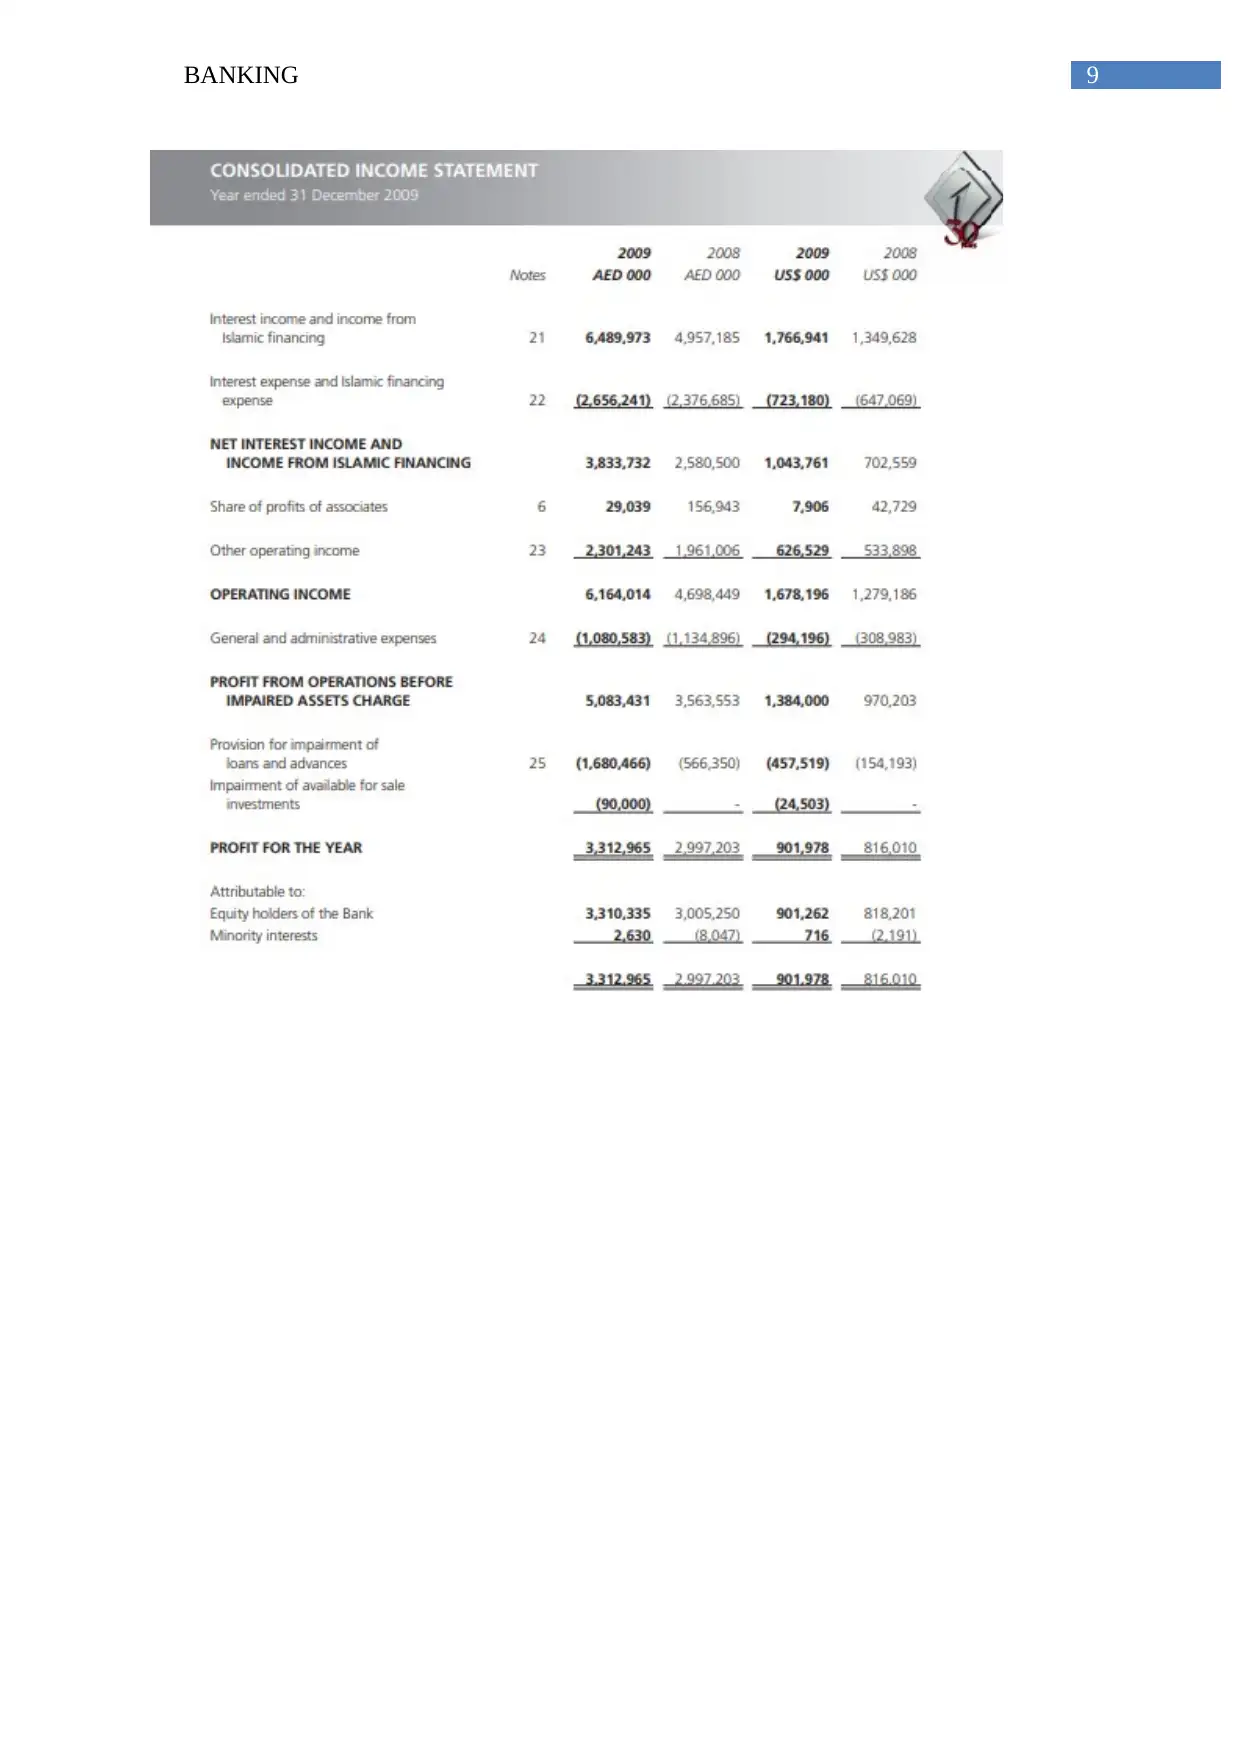
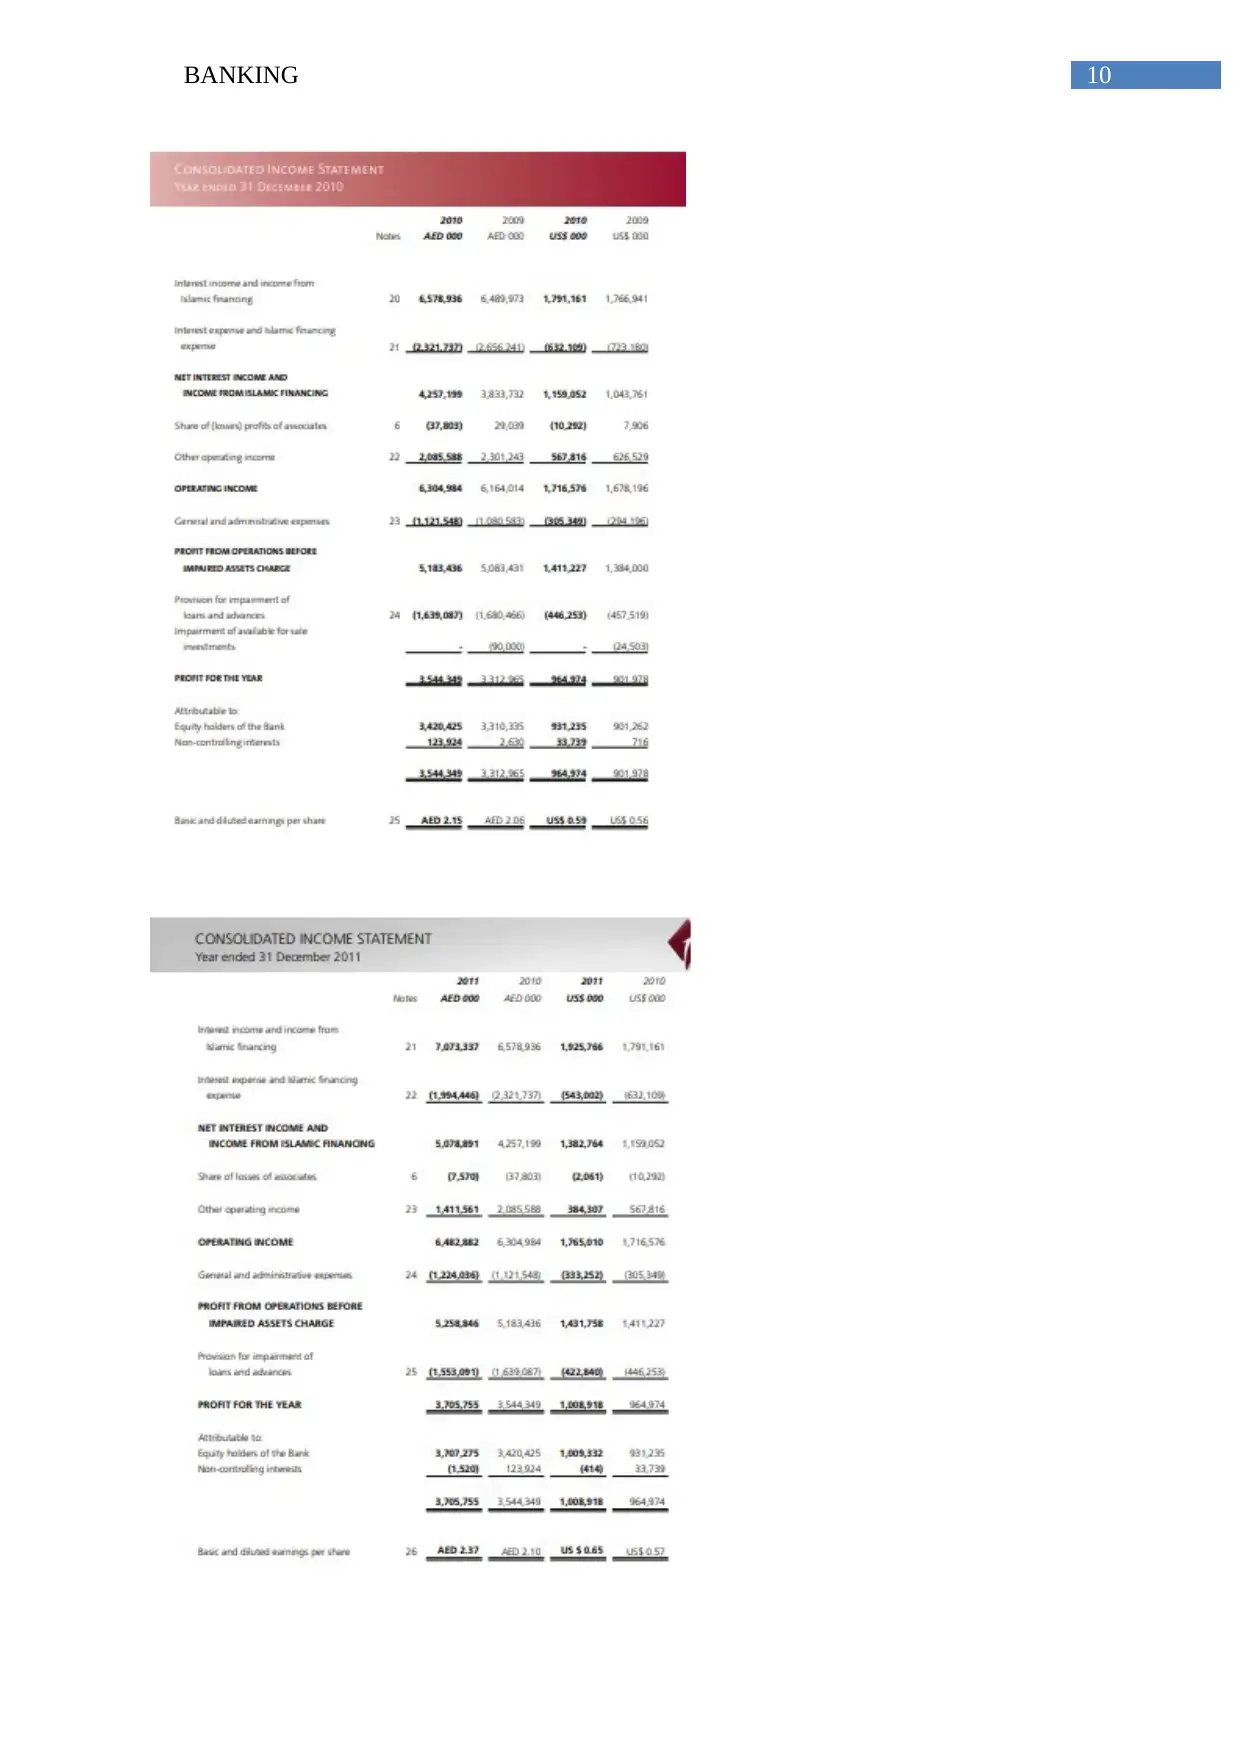
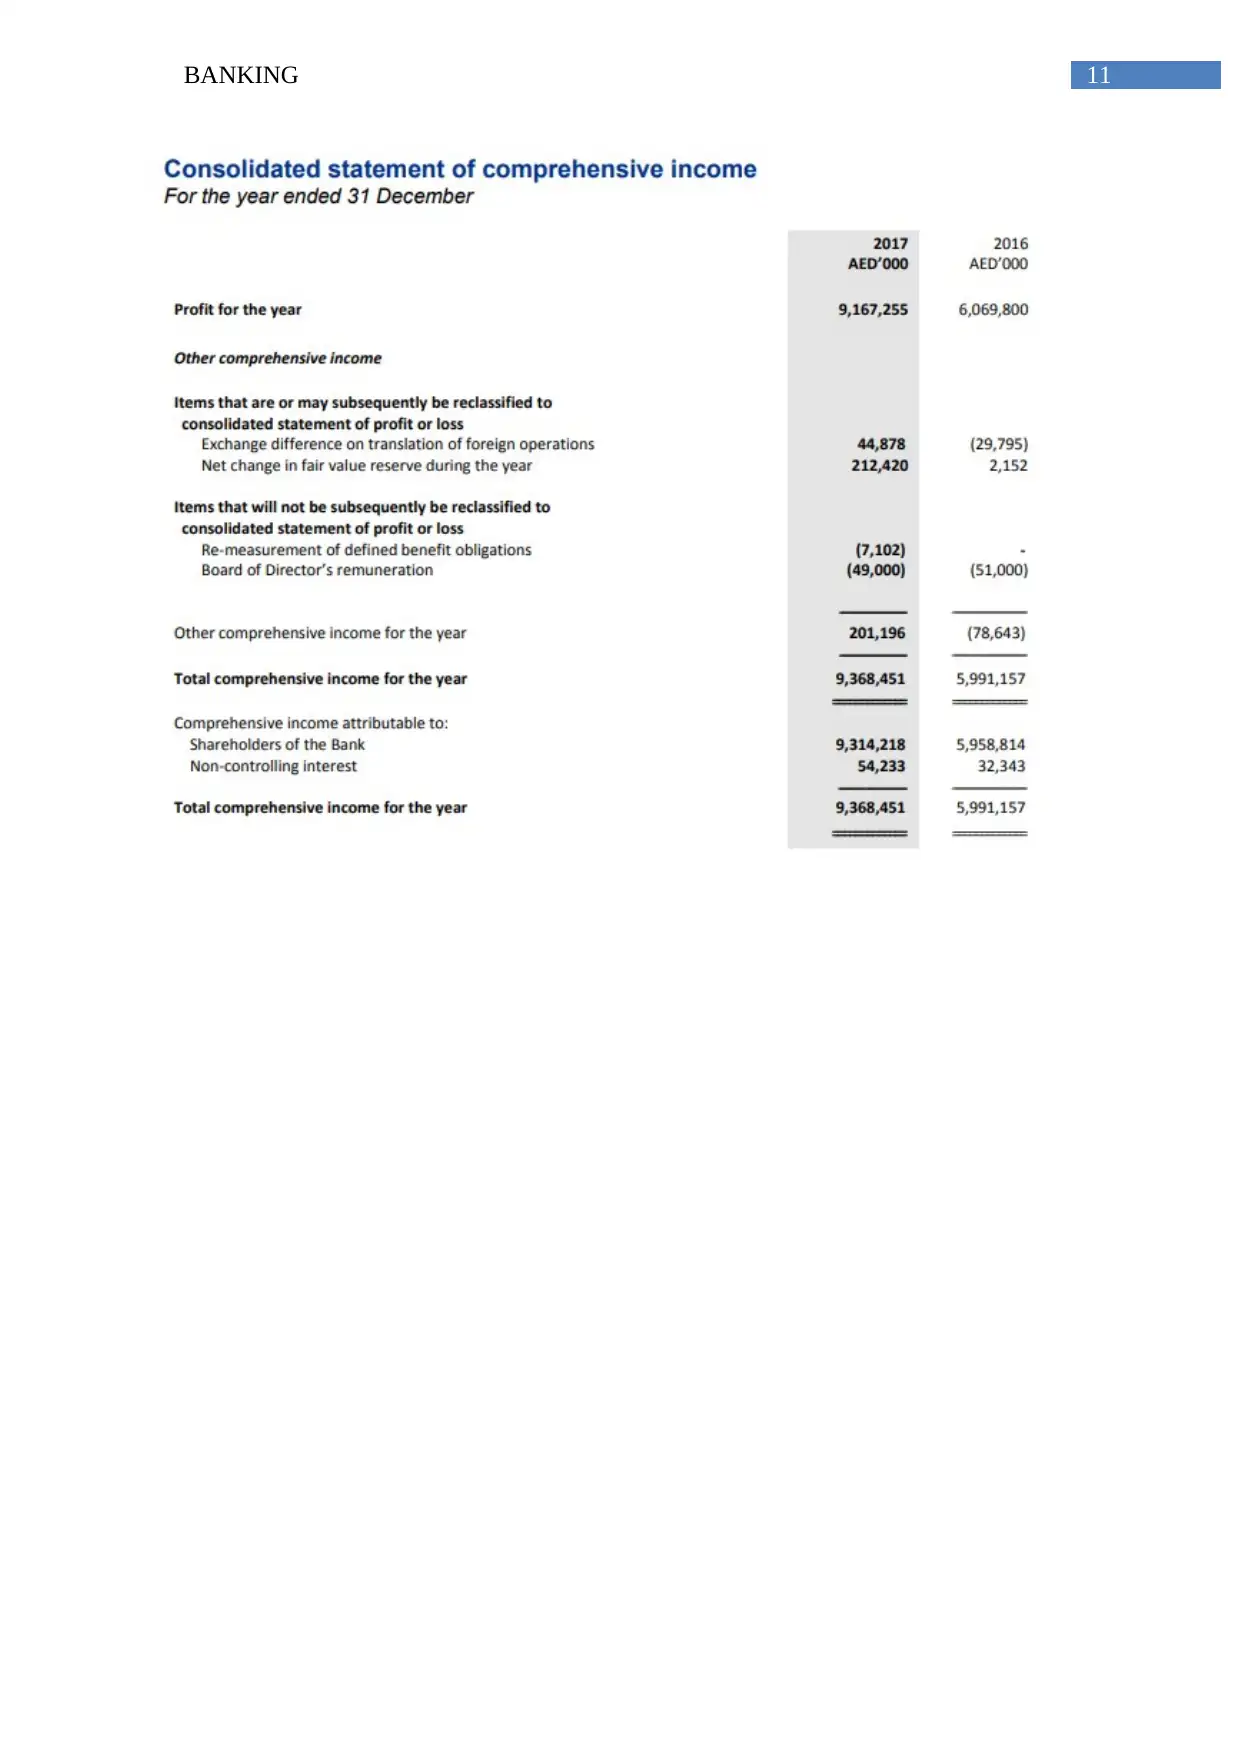
This report provides a comprehensive financial analysis of First Abu Dhabi Bank (FAB). It begins with an overview of the bank's services and products, followed by an examination of its balance sheet and income statement components. The analysis delves into key financial ratios, including net interest margin, return on assets (ROA), and return on equity (ROE), to evaluate the bank's performance over a ten-year period. A comparison with HSBC is also presented, highlighting differences in financial metrics such as net interest margin, non-interest margin, and equity multiplier. The report further explores the standard deviation of ROE, ROA, and equity multiplier, providing insights into the data dispersion. Finally, the report concludes with an assessment of the bank's profitability and efficiency in managing its assets, emphasizing the ROA. The report utilizes data from the bank's annual reports and other financial sources to support its findings and conclusions. The report also includes tables and figures to illustrate the findings.
Contribute Materials
Your contribution can guide someone’s learning journey. Share your
documents today.

Running head: BANKING
Banking
Name of the student
Name of the university
Student ID
Author note
Banking
Name of the student
Name of the university
Student ID
Author note
Secure Best Marks with AI Grader
Need help grading? Try our AI Grader for instant feedback on your assignments.

1BANKING
Table of Contents
Overview of bank and services provided by it...........................................................................2
Overview of balance sheet and income statement.....................................................................2
Analysis of components.............................................................................................................2
Measurement and evaluation of performance............................................................................3
Comparison with HSBC.............................................................................................................4
Standard deviation of First ABU Dhabi Bank...........................................................................5
Return on assets (ROA).............................................................................................................5
Reference....................................................................................................................................7

2BANKING
Overview of bank and services provided by it
First ABU Dhabi Bank offers different services associated with financial and banking
services and products in UAE and international market. It offers savings, current and margin
accounts, time and notice deposits and deposits certifications. Further, it offers trade, term,
real estate, personal, mortgage, and loans for vehicle financing. Apart from that it is engaged
in securities and shares business, insurance activities and fund managements. Further, it is
also engaged in brokerages, leases, managing of real estate properties and providing
information technology related services. It was established in the year 1979 and has it’s
headquarter in Abu Dhabi. It provides wide range of the tailor made solutions, services and
products. Further, through the strategic offerings the bank meets the banking requirements of
the customers all over the world through investment banking, market leading corporate and
franchises of personal banking (First Abu Dhabi Bank, 2018).
Overview of balance sheet and income statement
Balance sheet of First ABU Dhabi Bank is segregated into 3 sections. 1st section
represents all the assets headed by the term ‘Total assets’. From the annual report of the bank
as at 31st December 2017 it can be identified that the amount of total assets is AED
668,968,295 thousands (Busch & Memmel, 2017). Total asset component is comprised of
liabilities and equities. Liabilities amounted to AED 566,758,882 thousand whereas total
equity amount for the same period was AED 102,209,419 thousands. The value has been
significantly similar when assessed with the last ten years.
Income statement of the bank represented details regarding the interest expenses as
well as interest income. It is found from the income statement of the bank for the year ended
31st December 2017 that the net interest income amounted to AED 11,396,193 thousands.
Operating income of the bank amounted to AED 16,380,457 thousands. Profit for the year
after tax expenses amounted to AED 91,67,255 thousands. When the performance of the bank
is assessed for the past 10 years, it is seen that the performance of the company has not been
that much effective.

3BANKING
Analysis of components
Balance sheet component –
From Table 1 it can be identified that major part of the assets that is 84.72% of the
bank has been raised through borrowing. On the other hand, only 15.28% of the assets have
been raised through owner’s fund. Therefore, it can be stated that the company is highly
leverage and a bug portion of bank’s income will be spend for meeting liabilities. Further,
high level of borrowing indicates that the bank is financially unstable (Kamar, 2017). It is
even seen that by looking into the financial report of the bank for the past ten years, the
performance has lowered and this has been found by assessing the financial statements. The
financial instability of the bank increases their extent of liability and thereby reduces their
image.
Income statement component –
It can be identified from Table 2 that net interest income of the company was 1.70%
of total assets. Further, the operating income is 2.45% of total assets, profit before tax is
1.40% of total asset and profit after tax or return on assets of the company is 1.37%. Return
on assets that indicates the profitability of the bank with regard to the total assets of the
company is revealing that the bank is able to generate income from its assets. Hence, the bank
is profitable (Al Nimer, Warrad & Al Omari, 2015). The assessment of the income statement
for the last ten years shows that the bank has been profitable like the current time period as
the bank has been able to generate income with the help of their available assets.
Measurement and evaluation of performance
From the Figure 1 and Figure 2 it can be stated that the net interest margin of the
company over the last 10 years period are majorly in decreasing trend and ranged between
0.071 and 0.727. From 2008 to 2009 it increased from 0.369 to 0.727, however, since then it
is in reducing trend and reached to 0.071 in 2016 (Wani, Haque & Raina, 2019). The non-
interest margin of the bank followed the same trend and reduced to 0.039 in 2017 from 0.442
in 2009. Bank has been deteriorated in terms of providing return on shareholder’s fund
(Heikal, Khaddafi & Ummah, 2014). It has been reduced to 0.118 in 2017 from 0.224 in the
year 2008. PLL to total loan ratio of the bank also increased to 0.038 in 2017 from 0.007 in
2013. It states that the company is increasing its provision towards provision for loan losses
as against the total amount of loans over the last 10 years. ALL to total loan ratio of the bank
Secure Best Marks with AI Grader
Need help grading? Try our AI Grader for instant feedback on your assignments.

4BANKING
also increased for the bank keeping the pace with PLL. It has been increased to 0.044 in 2017
from 0.039 in the year 2013. It states that the company is increasing its allowance towards
provision for loan losses as against the total amount of loans over the last 5 years.
Comparison with HSBC
From the Table 3, it can be stated that net interest margin of as well as non-interest
margin of HSBC is better as compared to First ABU Dhabi Bank. However, return on equity
for First ABU Dhabi Bank is slightly better as compared to HSBC. ROA for both the banks
are same. Equity multiplier that indicates that financial leverage of the bank indicates that the
First ABU Dhabi Bank has higher EM as compared to HSBC. It reveals that First ABU
Dhabi Bank is highly leveraged as compared to HSBC (Hsbc.ae, 2018). Provision and
allowance both as compared to total loans of First ABU Dhabi Bank is higher as compared to
HSBC. However, both the banks did not have any non performing loans for last 5 years.
Standard deviation of First ABU Dhabi Bank
Standard deviation is the statistic measure used for measuring the dispersion of
dataset as compared to the means and is computed through square root of variance. From
Table 4 it can be found that Standard deviation for ROE as well as ROA is moderate and that
indicates the data dispersion is low. However, in case of EM the data dispersion is high as the
EM is 1.837.
Return on assets (ROA)
It indicates the profitability of the company as compared to total assets of the
company. It reveals the efficiency of the company with regard to management of the assets.
In other words, it measures total income that is produced by the bank’s total assets during the
period under consideration. In case of First ABU Dhabi Bank it can be stated that ROA of
1.40% indicates that for each dollar of asset it earns 0.14 dollar of income that is quite low
(Anugrah & Syaichu, 2017).

5BANKING
Reference
Al Nimer, M., Warrad, L., & Al Omari, R. (2015). The impact of liquidity on Jordanian
banks profitability through return on assets. European Journal of Business and
Management, 7(7), 229-232.
Anugrah, A., & Syaichu, M. (2017). Analisis Pengaruh Return On Equity, Debt To Equity
Ratio, Current Ratio, Dan Price To Book Value Terhadap Return Saham Syariah (Studi
Kasus Pada Perusahaan yang Terdaftar Dalam Jakarta Islamic Index Periode 2011-2015)
(Doctoral dissertation, Fakultas Ekonomika dan Bisnis).
Busch, R., & Memmel, C. (2017). Banks' net interest margin and the level of interest
rates. Credit and Capital Markets–Kredit und Kapital, 50(3), 363-392.
First Abu Dhabi Bank, U. (2018). [online] First Abu Dhabi Bank, UAE. Retrieved 22
October 2018, from https://www.bankfab.ae/
Heikal, M., Khaddafi, M., & Ummah, A. (2014). Influence analysis of return on assets
(ROA), return on equity (ROE), net profit margin (NPM), debt to equity ratio (DER), and
current ratio (CR), against corporate profit growth in automotive in Indonesia Stock
Exchange. International Journal of Academic Research in Business and Social
Sciences, 4(12), 101.
Hsbc.ae. (2018). Personal banking - Banks in UAE | HSBC UAE . [online] Retrieved 22
October 2018, from https://www.hsbc.ae/1/2/
Kamar, K. (2017). Analysis of The Effect of Return on Equity (ROE) and Debt to Equity
Ratio (DER) on Stock Price on Cement Industry Listed in Indonesia Stock Exchange (IDX)
in The Year of 2011-2015. IOSR Journal Of Business and Management, 19(5), 66-76.
Wani, A. A., Haque, S. I., & Raina, S. H. (2019). Impact of Macroeconomic and Bank-
Specific Indicators on Net Interest Margin: An Empirical Analysis. In Understanding the
Role of Business Analytics (pp. 45-64). Springer, Singapore.

6BANKING
Appendix
Total assets 668,968,295.00 100%
Total liabilities 566,758,882.00 84.72%
Total equity 102,209,413.00 15.28%
(Table 1 - Balance sheet component)
Total assets 668,968,295.00 100%
Net interest income 11,396,193.00 1.70%
Operating income 16,380,457.00 2.45%
Profit before tax 9,392,244.00 1.40%
Profit after tax 9,167,255.00 1.37%
(Table 2 - Income statement component)
(Figure 1 – Ratio computation)
Paraphrase This Document
Need a fresh take? Get an instant paraphrase of this document with our AI Paraphraser

7BANKING
2008 2009 2010 2011 2012 2013 2014 2015 2016 2017
0.000
2.000
4.000
6.000
8.000
10.000
12.000
FIRST ABU DHABI BANK
Net interest margin Net interest
income/average earning asset
Non-interest margin Non interest
incomes/average earning asset
Return on equity Net profits/
shareholder's average equity
Return on assets Net profits/total
assets
Equity multiplier ROE/ROA
PLL to total loans ratio Provision
for loan losses/total loans and
leases
ALL to Total loans ratio
Allowance for loan losses/total
loans and leases
NPL to Total loans ratio Non-
performing loans/total loans and
leases
(Figure 2 – Graph presentation)
FIRST ABU
DHABI
BANK
HSBC
Ratio Formula 2017 2017
Net interest margin Net interest income/average earning asset 0.089 0.336
Non-interest margin Non interest incomes/average earning asset 0.039 0.084
Return on equity Net profits/ shareholder's average equity 0.123 0.111
Return on assets Net profits/total assets 0.014 0.014
Equity multiplier ROE/ROA 8.992 8.160
PLL to total loans
ratio
Provision for loan losses/total loans and
leases
0.038 0.003
ALL to Total loans
ratio
Allowance for loan losses/total loans and
leases
0.044 0.006
NPL to Total loans
ratio
Non-performing loans/total loans and leases NA NA

8BANKING
(Table 3 – comparison with HSBC)
Return on equity 0.030
Return on assets 0.006
Equity multiplier 1.837
(Table 4 – Standard deviation)
Income Statement
(Table 3 – comparison with HSBC)
Return on equity 0.030
Return on assets 0.006
Equity multiplier 1.837
(Table 4 – Standard deviation)
Income Statement

9BANKING
Secure Best Marks with AI Grader
Need help grading? Try our AI Grader for instant feedback on your assignments.

10BANKING

11BANKING

12BANKING
Balance Sheet
Balance Sheet
Paraphrase This Document
Need a fresh take? Get an instant paraphrase of this document with our AI Paraphraser

13BANKING

14BANKING

15BANKING
Secure Best Marks with AI Grader
Need help grading? Try our AI Grader for instant feedback on your assignments.

16BANKING
1 out of 17
Related Documents

Your All-in-One AI-Powered Toolkit for Academic Success.
+13062052269
info@desklib.com
Available 24*7 on WhatsApp / Email
Unlock your academic potential
© 2024 | Zucol Services PVT LTD | All rights reserved.