Comprehensive Financial Ratio Analysis of Fiserv, Inc.
VerifiedAdded on 2020/04/01
|21
|2627
|208
AI Summary
The task requires conducting an extensive ratio analysis on Fiserv, Inc.'s financial statements from 2014 to 2016 to assess its operational efficiency, liquidity position, asset management, debt utilization, shareholder returns, and market valuation. The student must interpret the calculated ratios to determine trends in profitability, liquidity, activity levels, coverage capacity, and market performance. This analysis will aid in understanding Fiserv's capability to meet short-term obligations, efficiently use long-term financing, and generate adequate returns for shareholders.

RUNNING HEAD: ACCOUNTING AND FINANCIAL REPORTING
accounting and financial reporting
accounting and financial reporting
Paraphrase This Document
Need a fresh take? Get an instant paraphrase of this document with our AI Paraphraser
ACCOUNTING AND FINANCIAL REPORTING 1
Contents
PROJECT C..........................................................................................................................................2
1.........................................................................................................................................................2
2.........................................................................................................................................................3
3.........................................................................................................................................................4
4.........................................................................................................................................................7
5.......................................................................................................................................................15
6.......................................................................................................................................................17
7.......................................................................................................................................................18
8.......................................................................................................................................................18
9.......................................................................................................................................................18
10.....................................................................................................................................................19
11.....................................................................................................................................................19
REFERENCES........................................................................................................................................20
ACCOUNTING AND FINANCIAL REPORTING 2
PROJECT C
1.
a. Link of Fiserv:
http://files.shareholder.com/downloads/FISV/5348753300x0x929748/A530F2BE-5974-
477E-A825-8F8F910218EC/FISV_12.31.2016_10-K_FINAL_with_Exhibits_.pdf
b. The main point that are particularly important to understanding the company's prospects are
business overview, financial information and director’s report and the auditor’s report.
c. Business overview of Fiserv:
Fiserv is the leading company in providing services in technology. The company is publicly listed
in NASDAQ (NASDAQ : FISV). The main business operations are located in US. The main
services are account processing systems, electronic payments processing products and services like
bill payments, card based transaction processing and network services. In other words, company
operates data and transaction processing centres, provide technology support, software
development and providing payment solutions and consulting services.
d. The recent development of Fiserv is that the company has launched “cardvalet’ mobile card
management application.
e. Future direction of the company is to serve more and more clients in many countries plus recently
the company has just issued 140+ patents and many more are pending.
f. The position of this company within the industry is sound.
g. The recent stock price (2016) of the company is $ 109.11. The expectation of the next year’s stock
price will be higher in $ 120.
h. The major competitors are:
i. Jack Henry & Associates, Inc.
ii. ACI Worldwide, Inc.
iii. Fidelity National Information Services, Inc.
i. It is shown from the recent trend is that the net income of the company is increasing every year
and the company is also investing in fixed assets every year.
⊘ This is a preview!⊘
Do you want full access?
Subscribe today to unlock all pages.
Trusted by 1+ million students worldwide
ACCOUNTING AND FINANCIAL REPORTING 3
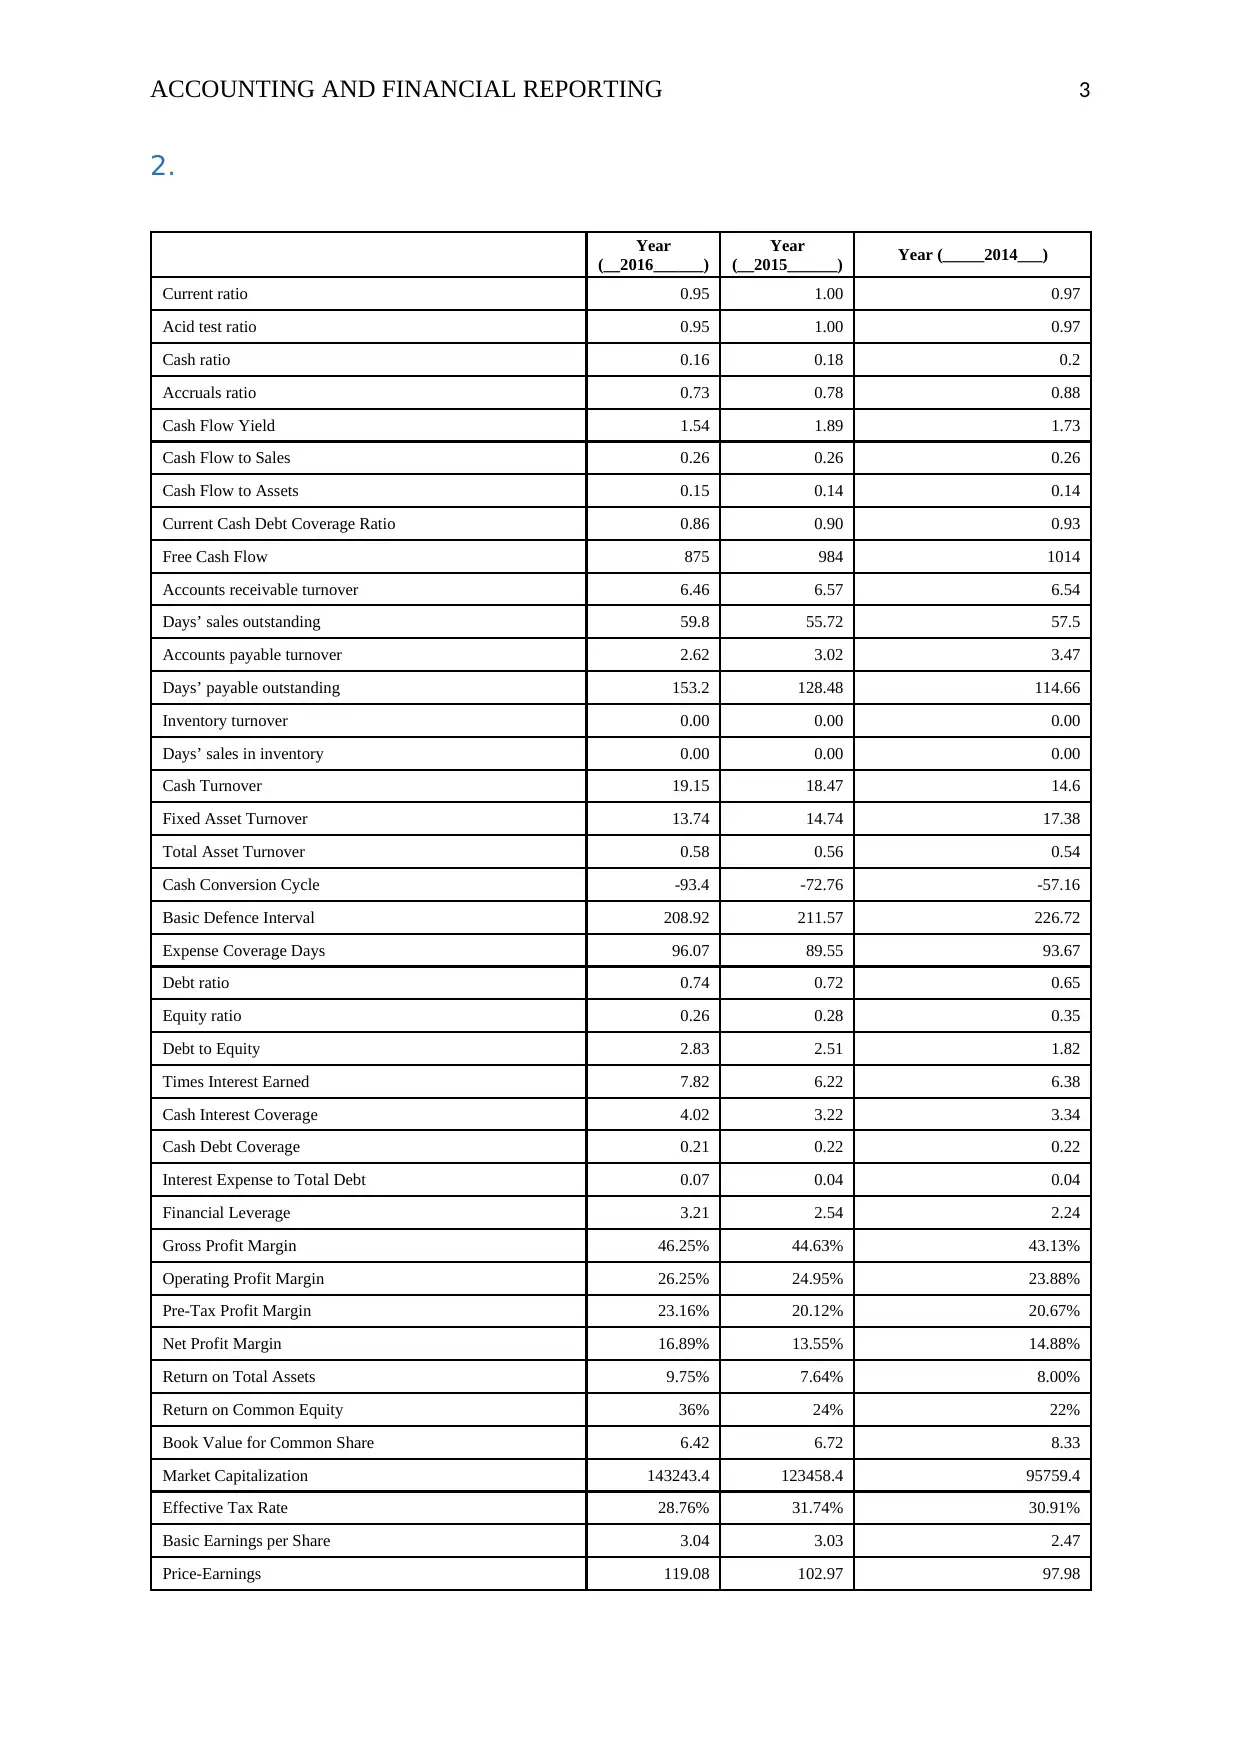
2.
Year
(__2016______)
Year
(__2015______) Year (_____2014___)
Current ratio 0.95 1.00 0.97
Acid test ratio 0.95 1.00 0.97
Cash ratio 0.16 0.18 0.2
Accruals ratio 0.73 0.78 0.88
Cash Flow Yield 1.54 1.89 1.73
Cash Flow to Sales 0.26 0.26 0.26
Cash Flow to Assets 0.15 0.14 0.14
Current Cash Debt Coverage Ratio 0.86 0.90 0.93
Free Cash Flow 875 984 1014
Accounts receivable turnover 6.46 6.57 6.54
Days’ sales outstanding 59.8 55.72 57.5
Accounts payable turnover 2.62 3.02 3.47
Days’ payable outstanding 153.2 128.48 114.66
Inventory turnover 0.00 0.00 0.00
Days’ sales in inventory 0.00 0.00 0.00
Cash Turnover 19.15 18.47 14.6
Fixed Asset Turnover 13.74 14.74 17.38
Total Asset Turnover 0.58 0.56 0.54
Cash Conversion Cycle -93.4 -72.76 -57.16
Basic Defence Interval 208.92 211.57 226.72
Expense Coverage Days 96.07 89.55 93.67
Debt ratio 0.74 0.72 0.65
Equity ratio 0.26 0.28 0.35
Debt to Equity 2.83 2.51 1.82
Times Interest Earned 7.82 6.22 6.38
Cash Interest Coverage 4.02 3.22 3.34
Cash Debt Coverage 0.21 0.22 0.22
Interest Expense to Total Debt 0.07 0.04 0.04
Financial Leverage 3.21 2.54 2.24
Gross Profit Margin 46.25% 44.63% 43.13%
Operating Profit Margin 26.25% 24.95% 23.88%
Pre-Tax Profit Margin 23.16% 20.12% 20.67%
Net Profit Margin 16.89% 13.55% 14.88%
Return on Total Assets 9.75% 7.64% 8.00%
Return on Common Equity 36% 24% 22%
Book Value for Common Share 6.42 6.72 8.33
Market Capitalization 143243.4 123458.4 95759.4
Effective Tax Rate 28.76% 31.74% 30.91%
Basic Earnings per Share 3.04 3.03 2.47
Price-Earnings 119.08 102.97 97.98
Paraphrase This Document
Need a fresh take? Get an instant paraphrase of this document with our AI Paraphraser
ACCOUNTING AND FINANCIAL REPORTING 4
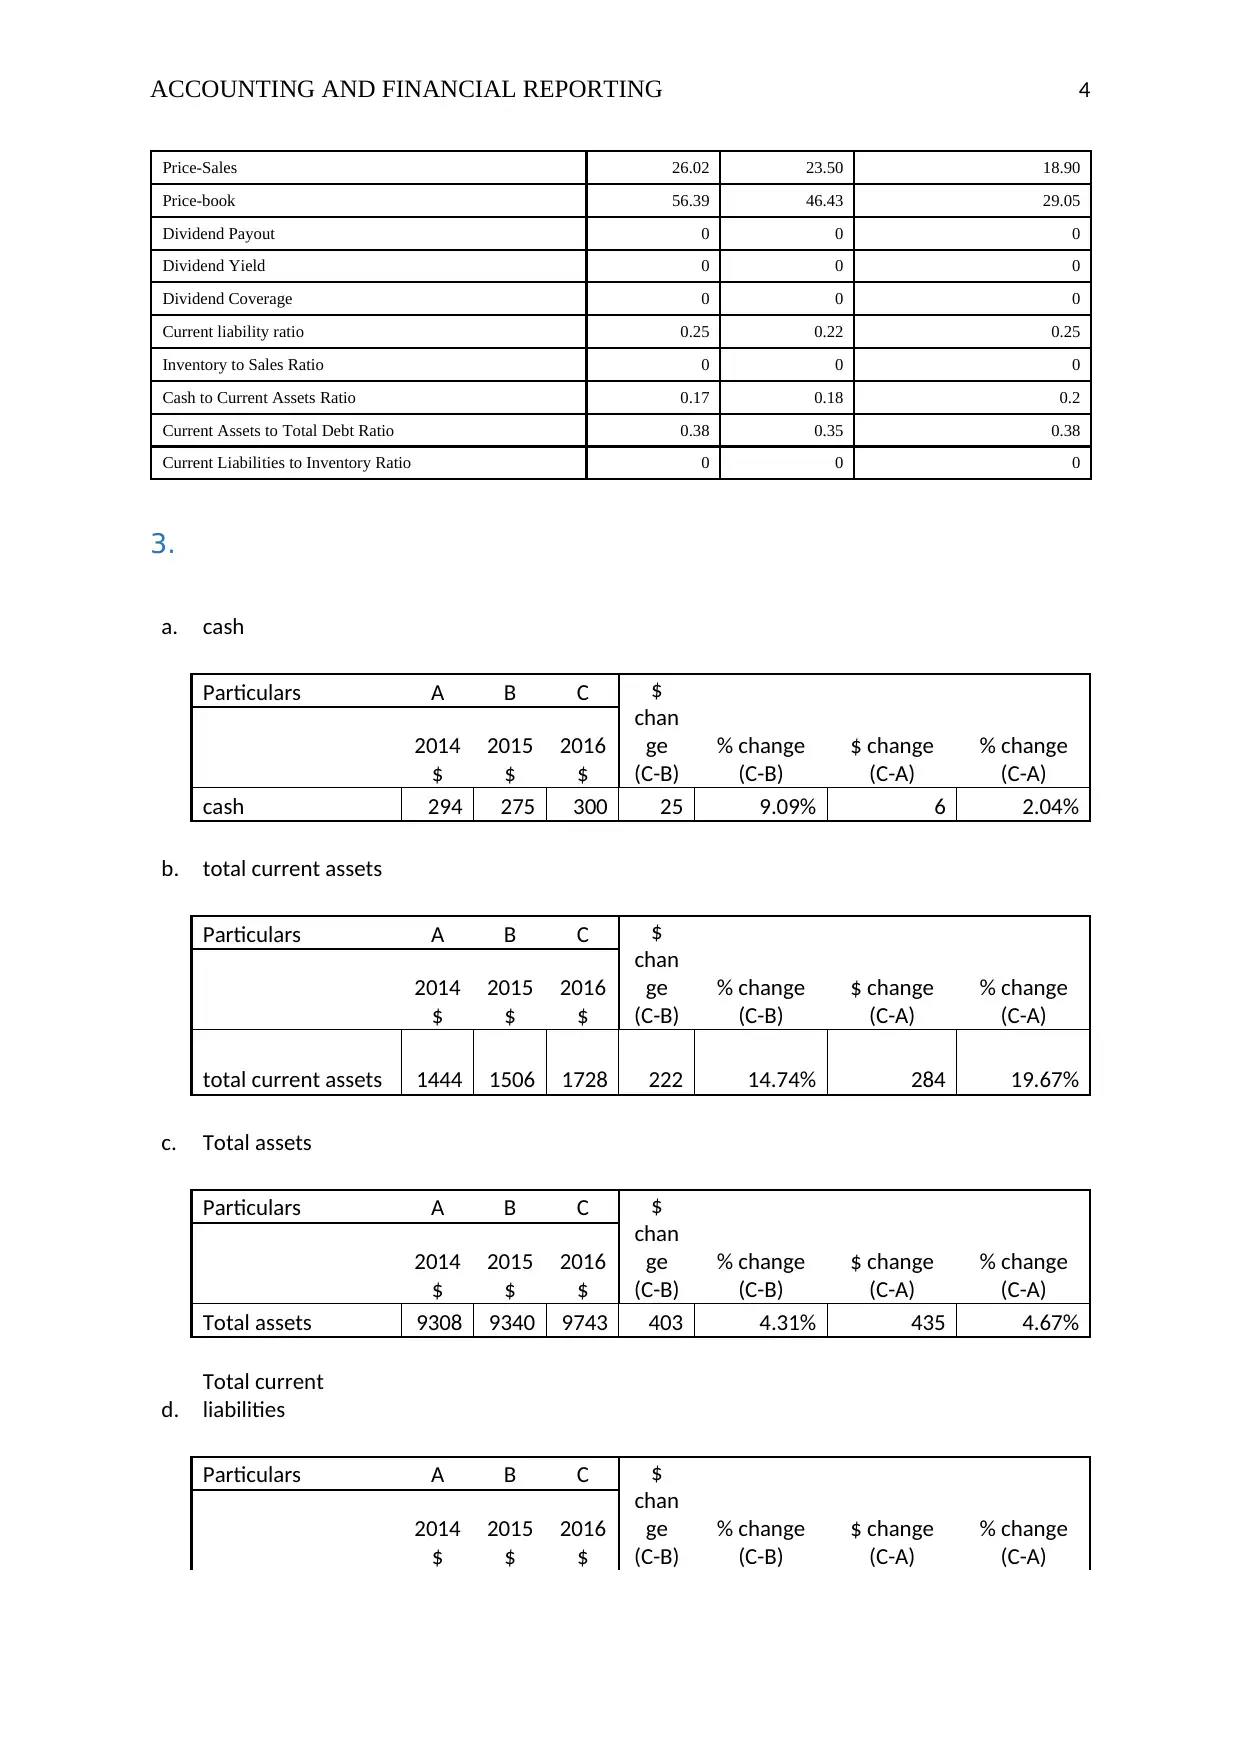
Price-Sales 26.02 23.50 18.90
Price-book 56.39 46.43 29.05
Dividend Payout 0 0 0
Dividend Yield 0 0 0
Dividend Coverage 0 0 0
Current liability ratio 0.25 0.22 0.25
Inventory to Sales Ratio 0 0 0
Cash to Current Assets Ratio 0.17 0.18 0.2
Current Assets to Total Debt Ratio 0.38 0.35 0.38
Current Liabilities to Inventory Ratio 0 0 0
3.
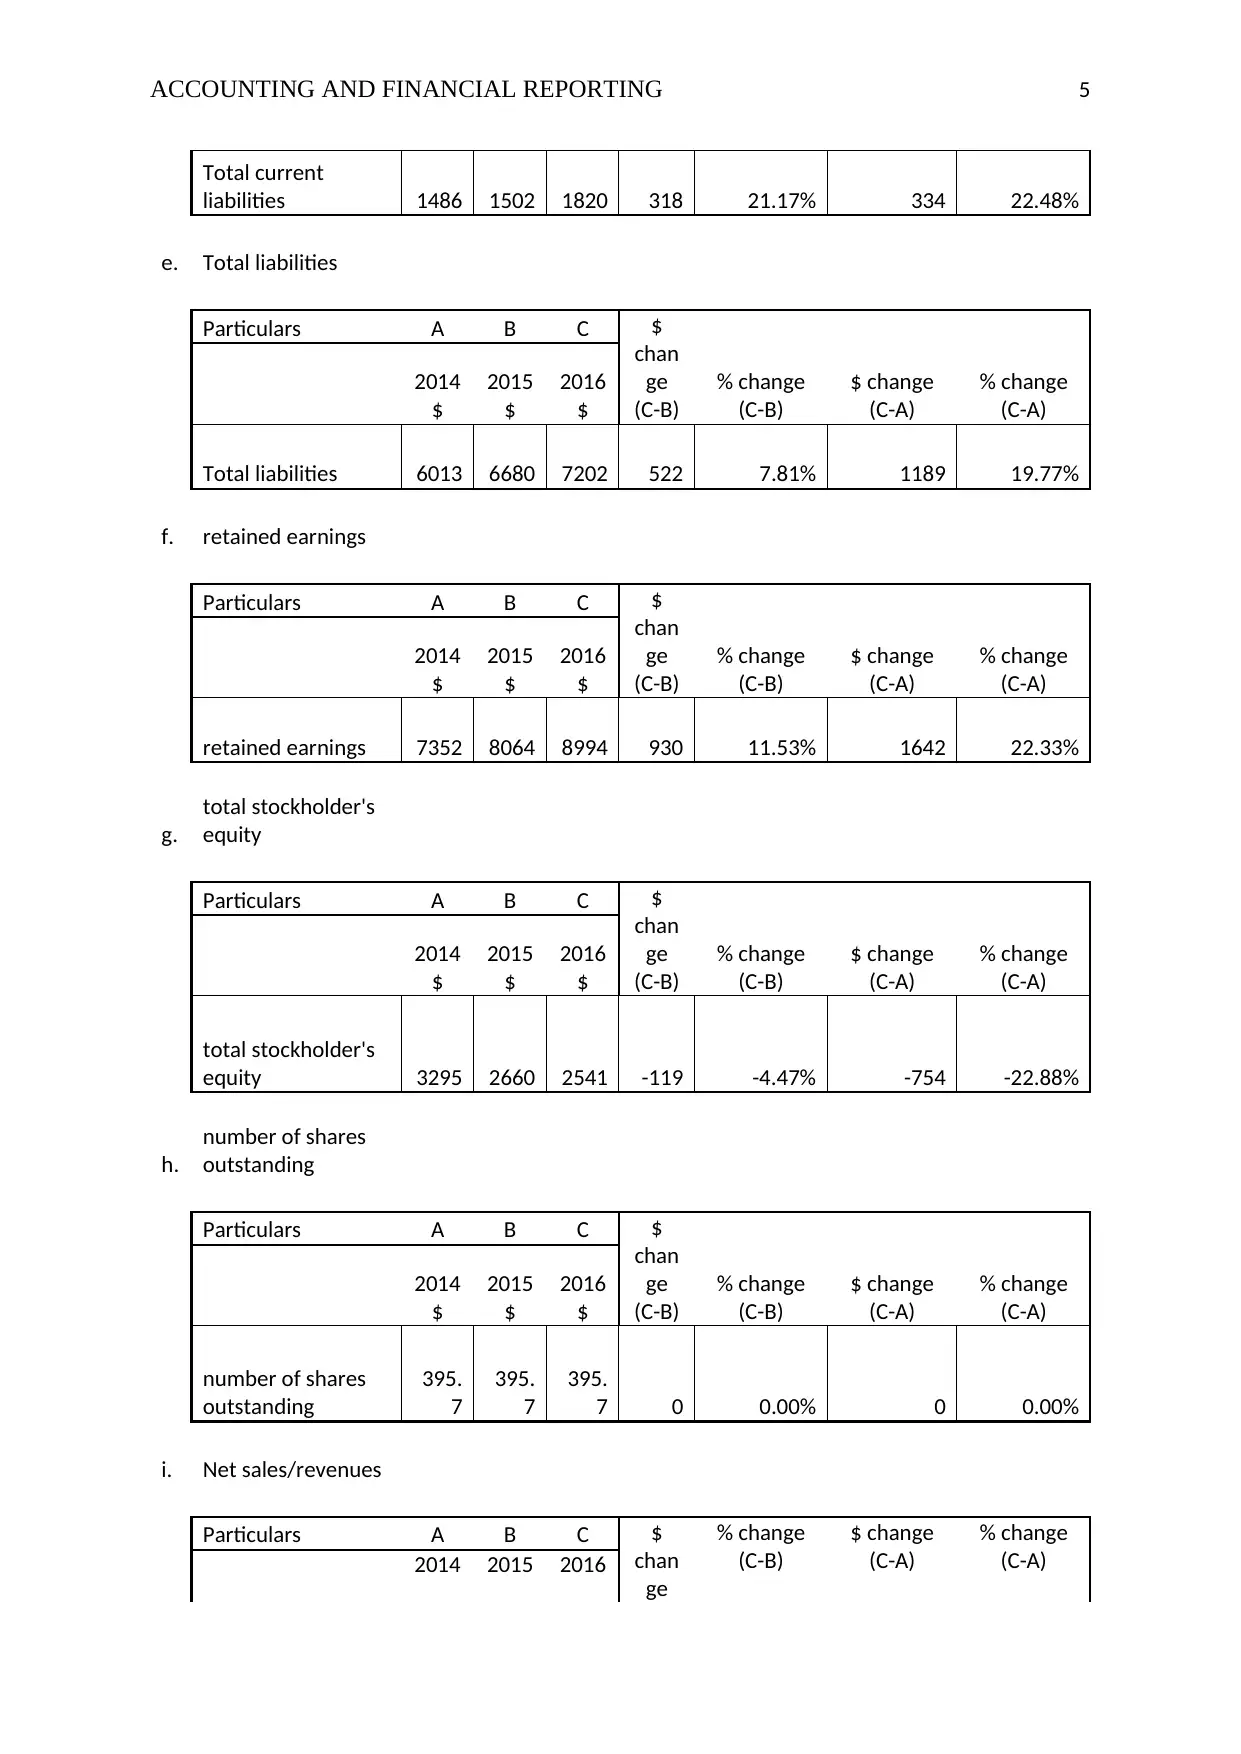
a. cash
Particulars A B C $
chan
ge
(C-B)
% change
(C-B)
$ change
(C-A)
% change
(C-A)
2014
$
2015
$
2016
$
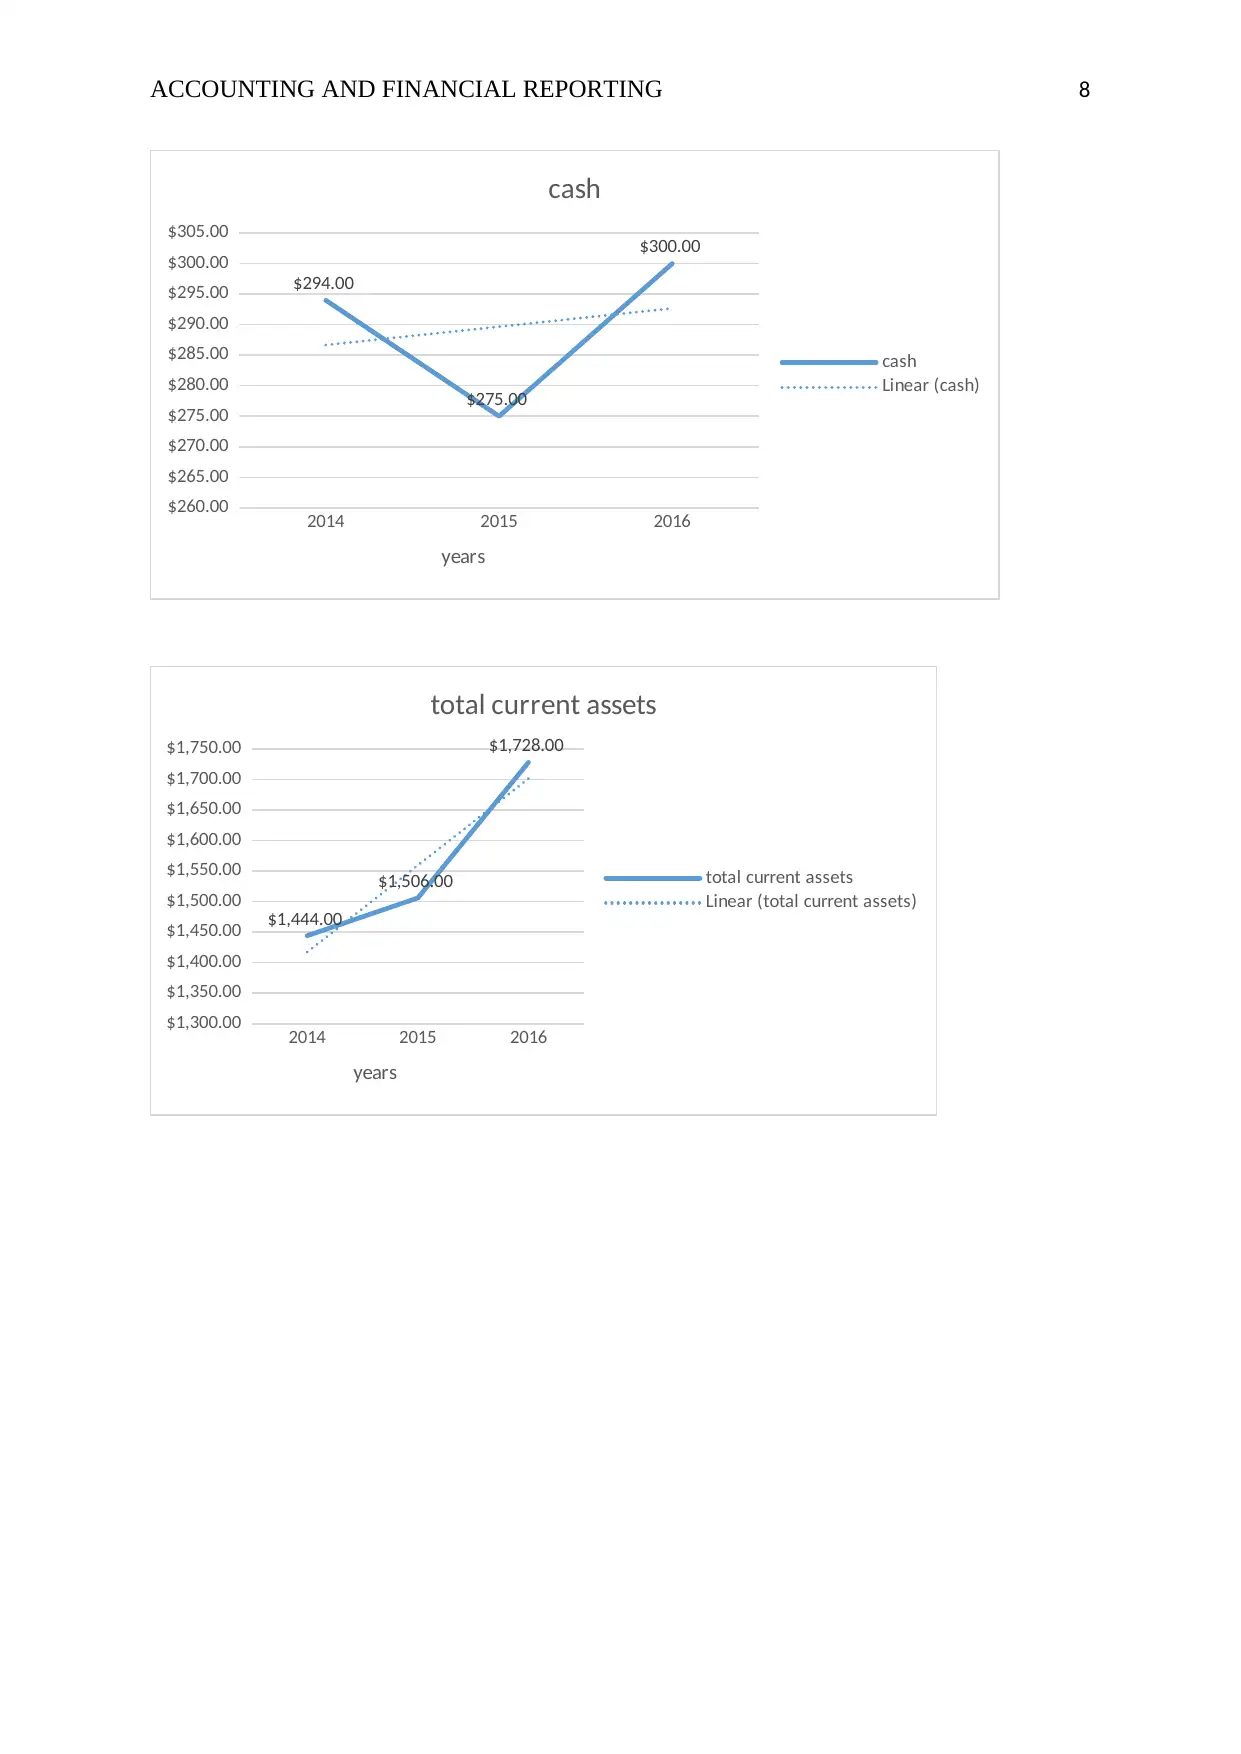
cash 294 275 300 25 9.09% 6 2.04%
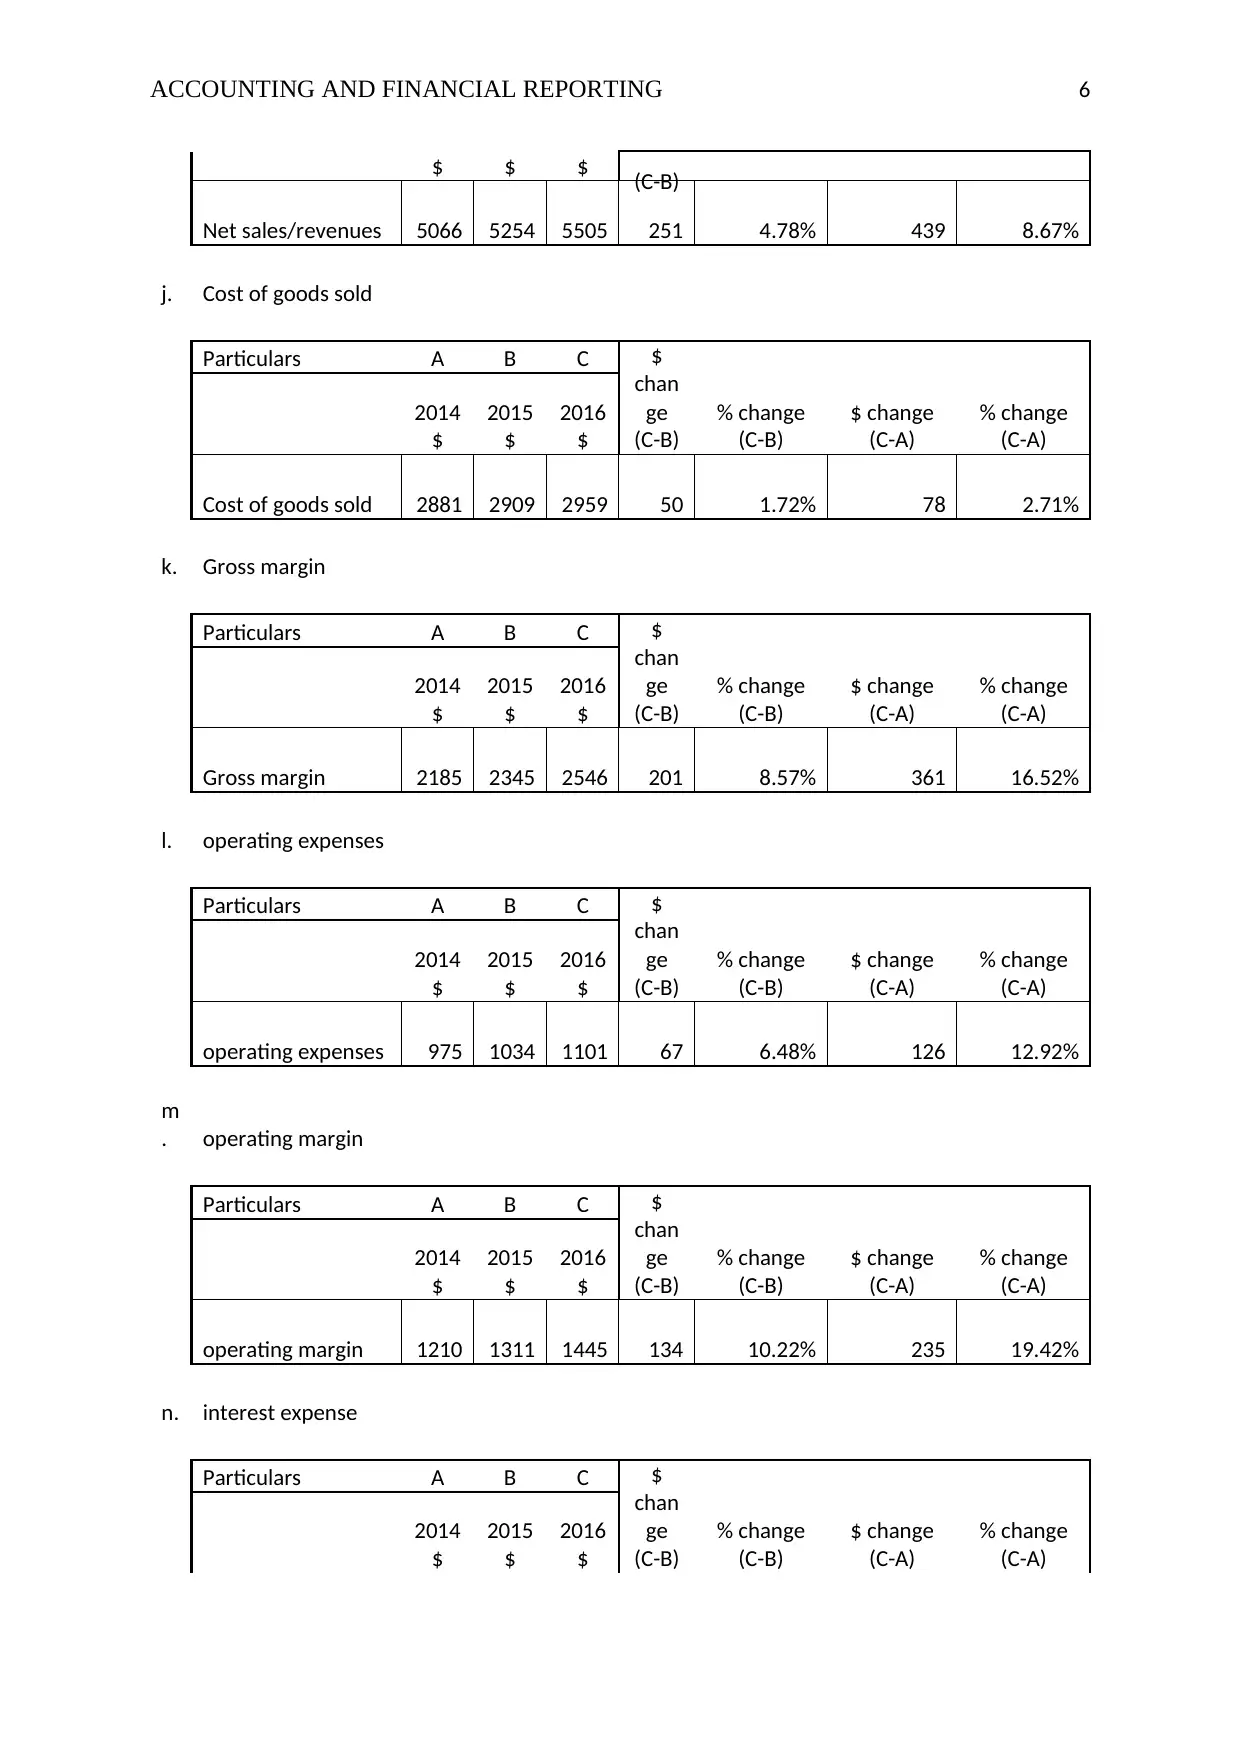
b. total current assets
Particulars A B C $
chan
ge
(C-B)
% change
(C-B)
$ change
(C-A)
% change
(C-A)
2014
$
2015
$
2016
$
total current assets 1444 1506 1728 222 14.74% 284 19.67%
c. Total assets
Particulars A B C $
chan
ge
(C-B)
% change
(C-B)
$ change
(C-A)
% change
(C-A)
2014
$
2015
$
2016
$
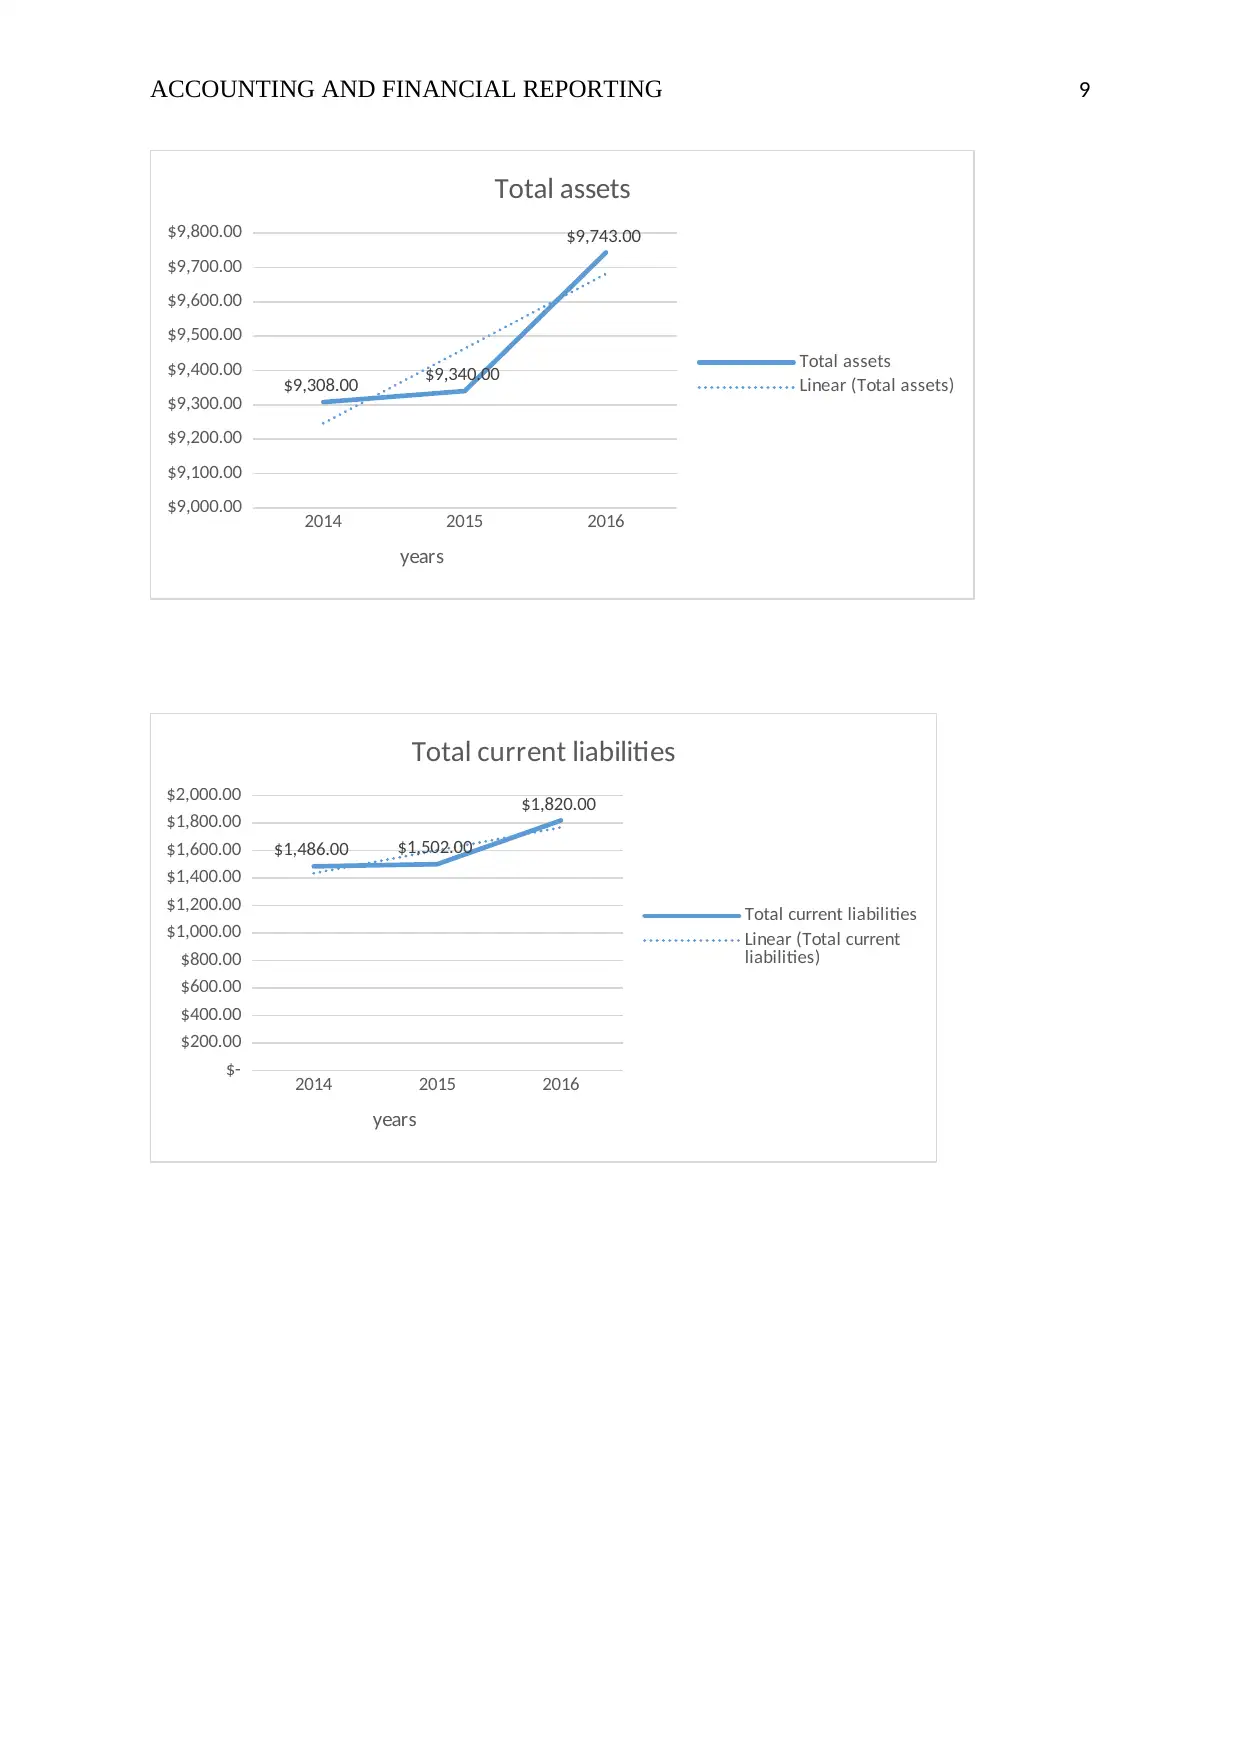
Total assets 9308 9340 9743 403 4.31% 435 4.67%
d.
Total current
liabilities
Particulars A B C $
chan
ge
(C-B)
% change
(C-B)
$ change
(C-A)
% change
(C-A)
2014
$
2015
$
2016
$
Price-Sales 26.02 23.50 18.90
Price-book 56.39 46.43 29.05
Dividend Payout 0 0 0
Dividend Yield 0 0 0
Dividend Coverage 0 0 0
Current liability ratio 0.25 0.22 0.25
Inventory to Sales Ratio 0 0 0
Cash to Current Assets Ratio 0.17 0.18 0.2
Current Assets to Total Debt Ratio 0.38 0.35 0.38
Current Liabilities to Inventory Ratio 0 0 0
3.
a. cash
Particulars A B C $
chan
ge
(C-B)
% change
(C-B)
$ change
(C-A)
% change
(C-A)
2014
$
2015
$
2016
$
cash 294 275 300 25 9.09% 6 2.04%
b. total current assets
Particulars A B C $
chan
ge
(C-B)
% change
(C-B)
$ change
(C-A)
% change
(C-A)
2014
$
2015
$
2016
$
total current assets 1444 1506 1728 222 14.74% 284 19.67%
c. Total assets
Particulars A B C $
chan
ge
(C-B)
% change
(C-B)
$ change
(C-A)
% change
(C-A)
2014
$
2015
$
2016
$
Total assets 9308 9340 9743 403 4.31% 435 4.67%
d.
Total current
liabilities
Particulars A B C $
chan
ge
(C-B)
% change
(C-B)
$ change
(C-A)
% change
(C-A)
2014
$
2015
$
2016
$
ACCOUNTING AND FINANCIAL REPORTING 5
Total current
liabilities 1486 1502 1820 318 21.17% 334 22.48%
e. Total liabilities
Particulars A B C $
chan
ge
(C-B)
% change
(C-B)
$ change
(C-A)
% change
(C-A)
2014
$
2015
$
2016
$
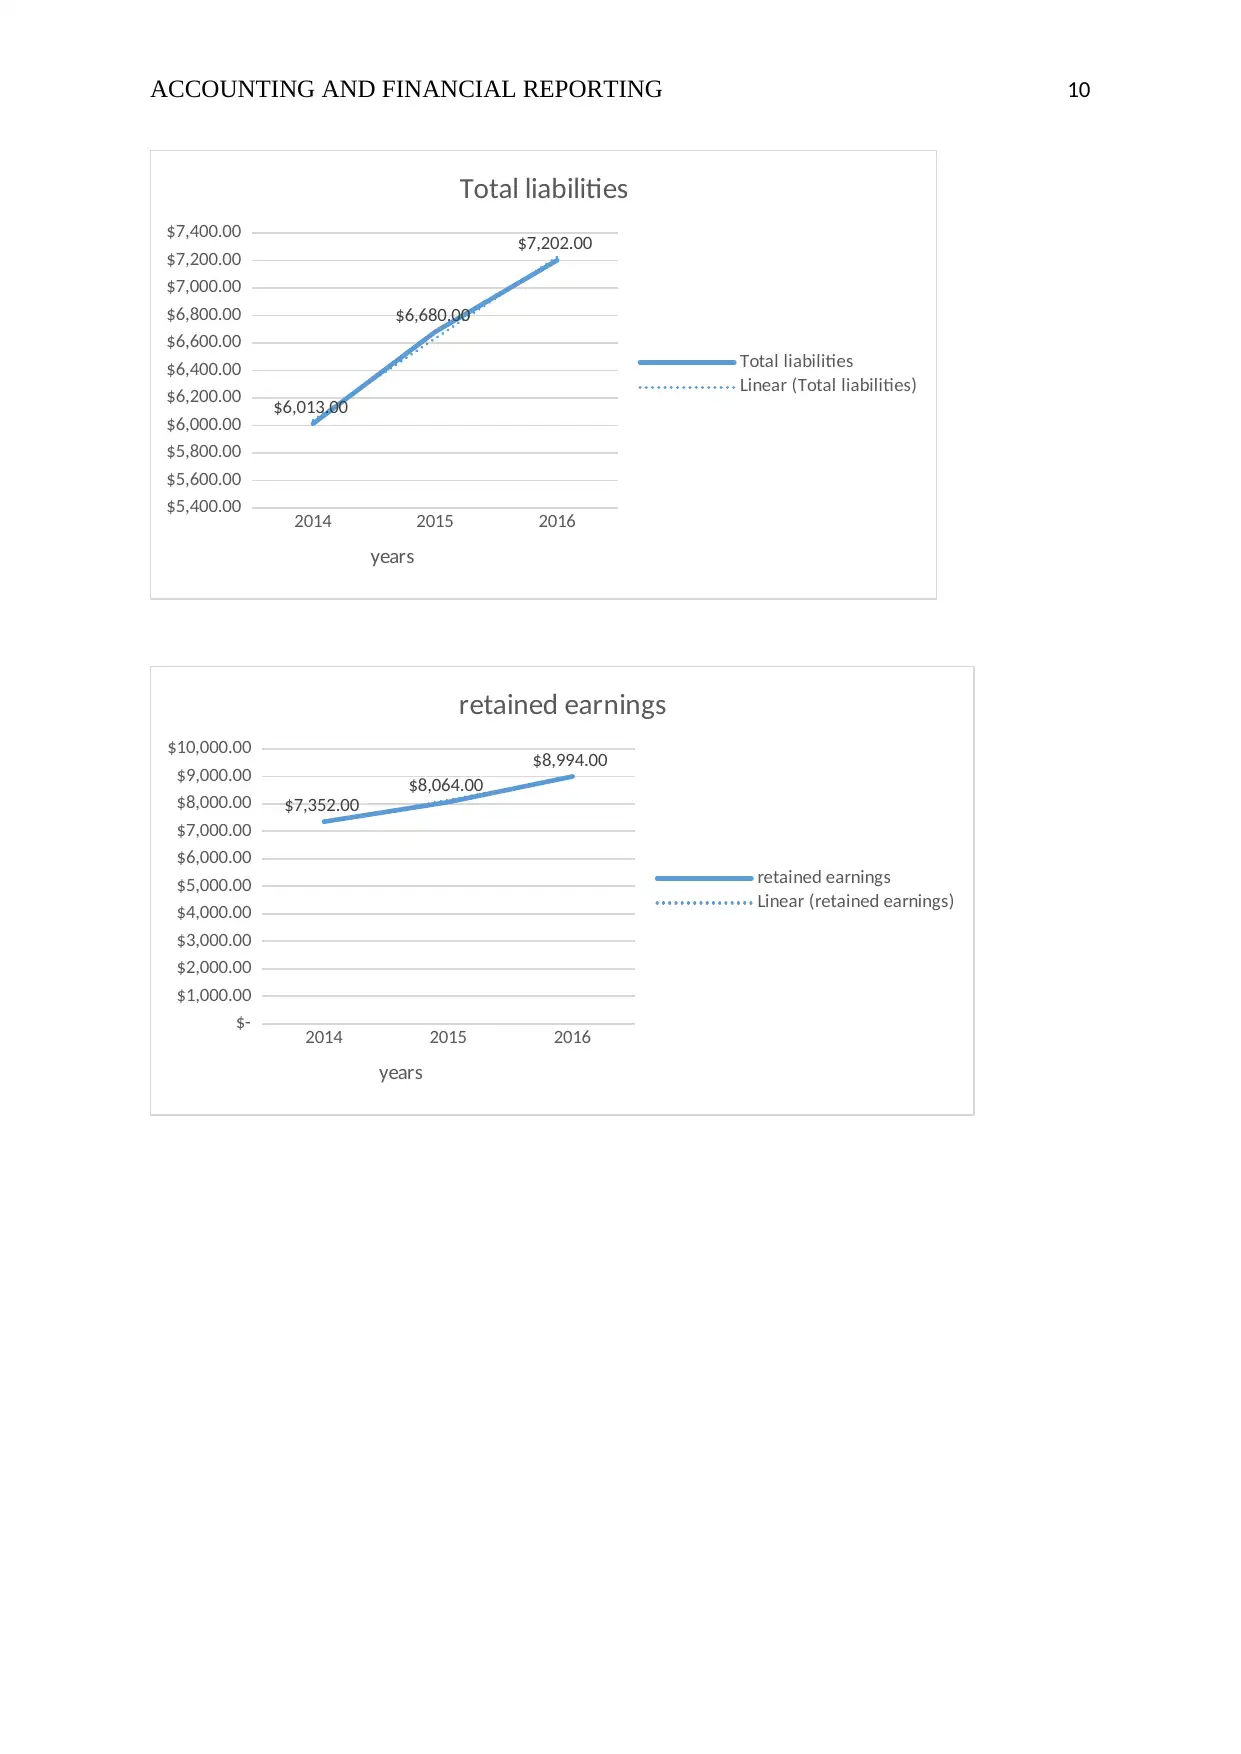
Total liabilities 6013 6680 7202 522 7.81% 1189 19.77%
f. retained earnings
Particulars A B C $
chan
ge
(C-B)
% change
(C-B)
$ change
(C-A)
% change
(C-A)
2014
$
2015
$
2016
$
retained earnings 7352 8064 8994 930 11.53% 1642 22.33%
g.
total stockholder's
equity
Particulars A B C $
chan
ge
(C-B)
% change
(C-B)
$ change
(C-A)
% change
(C-A)
2014
$
2015
$
2016
$
total stockholder's
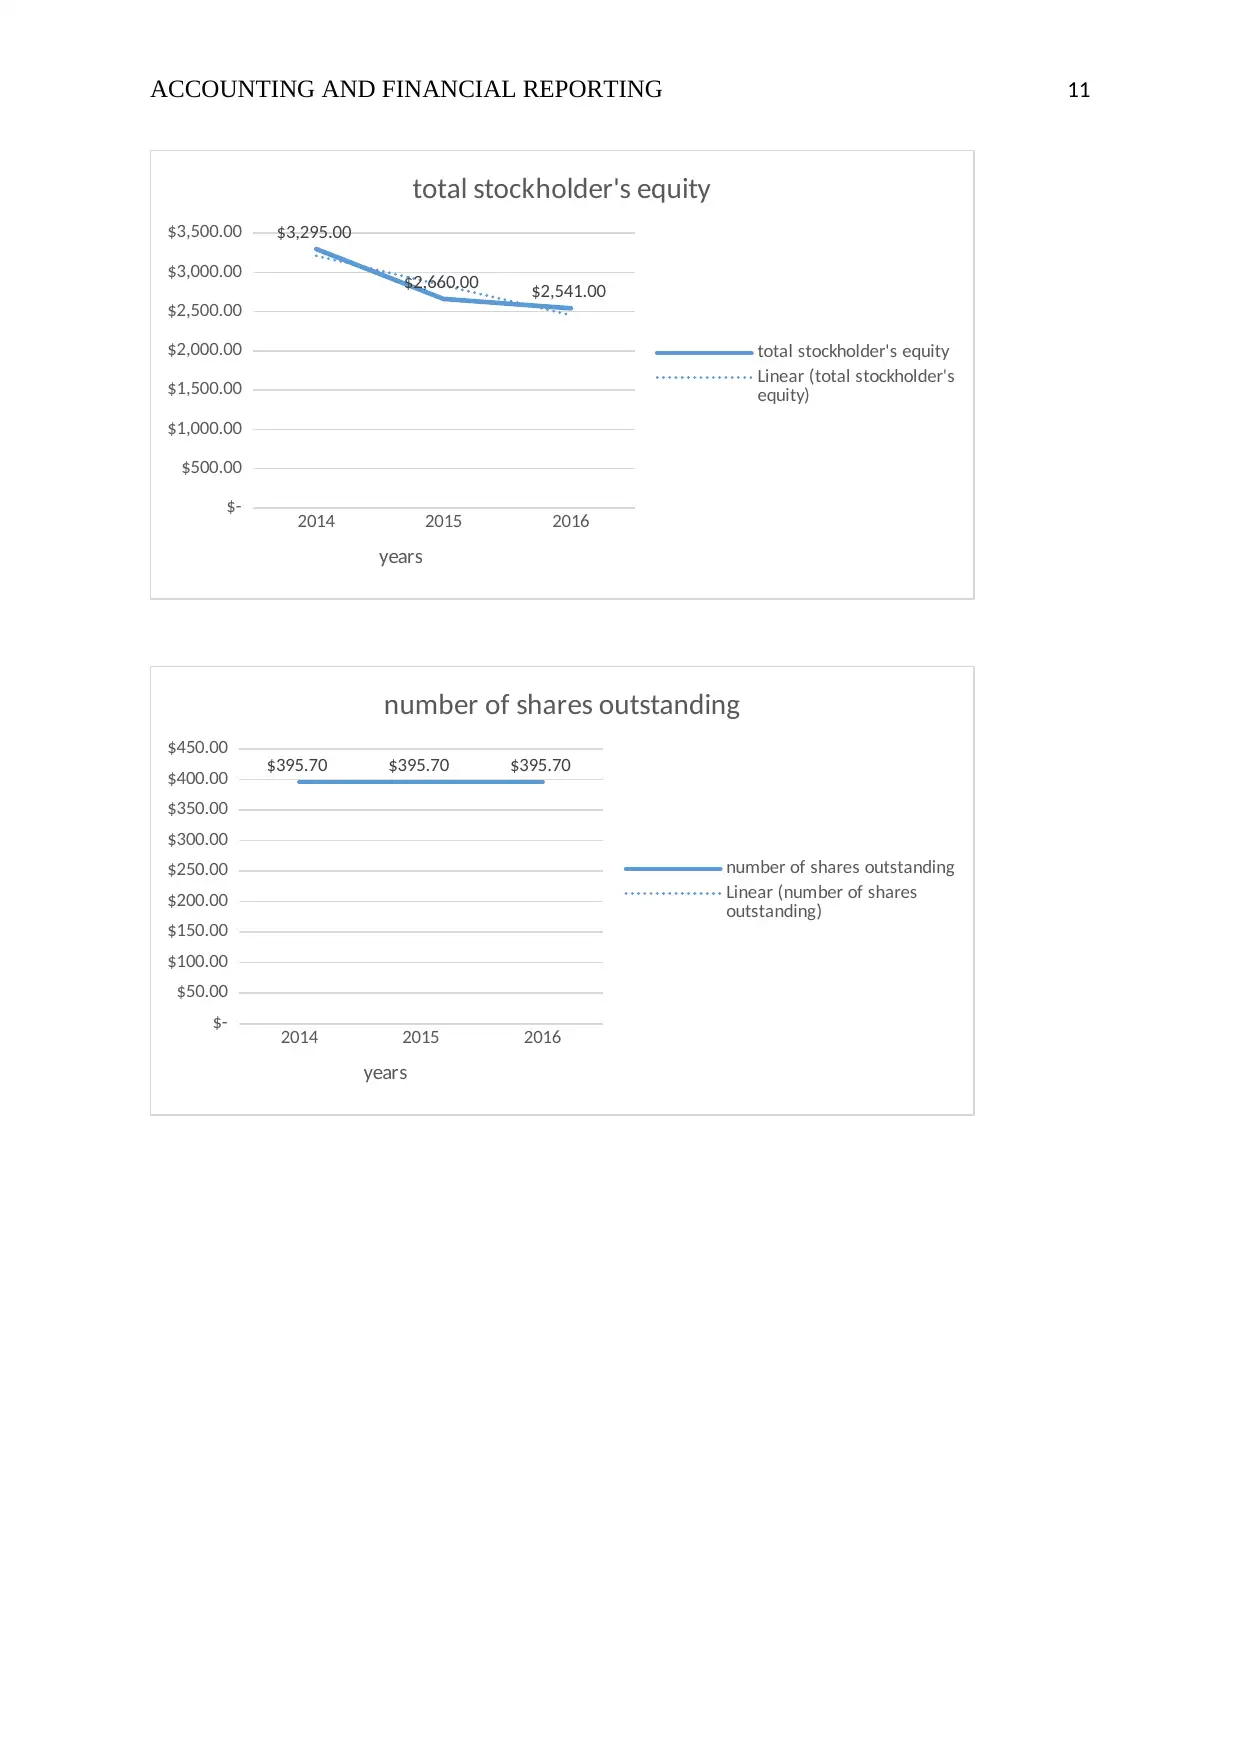
equity 3295 2660 2541 -119 -4.47% -754 -22.88%
h.
number of shares
outstanding
Particulars A B C $
chan
ge
(C-B)
% change
(C-B)
$ change
(C-A)
% change
(C-A)
2014
$
2015
$
2016
$
number of shares
outstanding
395.
7
395.
7
395.
7 0 0.00% 0 0.00%
i. Net sales/revenues
Particulars A B C $
chan
ge
% change
(C-B)
$ change
(C-A)
% change
(C-A)2014 2015 2016
Total current
liabilities 1486 1502 1820 318 21.17% 334 22.48%
e. Total liabilities
Particulars A B C $
chan
ge
(C-B)
% change
(C-B)
$ change
(C-A)
% change
(C-A)
2014
$
2015
$
2016
$
Total liabilities 6013 6680 7202 522 7.81% 1189 19.77%
f. retained earnings
Particulars A B C $
chan
ge
(C-B)
% change
(C-B)
$ change
(C-A)
% change
(C-A)
2014
$
2015
$
2016
$
retained earnings 7352 8064 8994 930 11.53% 1642 22.33%
g.
total stockholder's
equity
Particulars A B C $
chan
ge
(C-B)
% change
(C-B)
$ change
(C-A)
% change
(C-A)
2014
$
2015
$
2016
$
total stockholder's
equity 3295 2660 2541 -119 -4.47% -754 -22.88%
h.
number of shares
outstanding
Particulars A B C $
chan
ge
(C-B)
% change
(C-B)
$ change
(C-A)
% change
(C-A)
2014
$
2015
$
2016
$
number of shares
outstanding
395.
7
395.
7
395.
7 0 0.00% 0 0.00%
i. Net sales/revenues
Particulars A B C $
chan
ge
% change
(C-B)
$ change
(C-A)
% change
(C-A)2014 2015 2016
⊘ This is a preview!⊘
Do you want full access?
Subscribe today to unlock all pages.
Trusted by 1+ million students worldwide
ACCOUNTING AND FINANCIAL REPORTING 6
$ $ $ (C-B)
Net sales/revenues 5066 5254 5505 251 4.78% 439 8.67%
j. Cost of goods sold
Particulars A B C $
chan
ge
(C-B)
% change
(C-B)
$ change
(C-A)
% change
(C-A)
2014
$
2015
$
2016
$
Cost of goods sold 2881 2909 2959 50 1.72% 78 2.71%
k. Gross margin
Particulars A B C $
chan
ge
(C-B)
% change
(C-B)
$ change
(C-A)
% change
(C-A)
2014
$
2015
$
2016
$
Gross margin 2185 2345 2546 201 8.57% 361 16.52%
l. operating expenses
Particulars A B C $
chan
ge
(C-B)
% change
(C-B)
$ change
(C-A)
% change
(C-A)
2014
$
2015
$
2016
$
operating expenses 975 1034 1101 67 6.48% 126 12.92%
m
. operating margin
Particulars A B C $
chan
ge
(C-B)
% change
(C-B)
$ change
(C-A)
% change
(C-A)
2014
$
2015
$
2016
$
operating margin 1210 1311 1445 134 10.22% 235 19.42%
n. interest expense
Particulars A B C $
chan
ge
(C-B)
% change
(C-B)
$ change
(C-A)
% change
(C-A)
2014
$
2015
$
2016
$
Paraphrase This Document
Need a fresh take? Get an instant paraphrase of this document with our AI Paraphraser
ACCOUNTING AND FINANCIAL REPORTING 7
interest expense 164 170 163 -7 -4.12% -1 -0.61%
o. Net income
Particulars A B C $
chan
ge
(C-B)
% change
(C-B)
$ change
(C-A)
% change
(C-A)
2014
$
2015
$
2016
$
Net income 754 712 930 218 30.62% 176 23.34%
p. earnings per share
Particulars A B C $
chan
ge
(C-B)
% change
(C-B)
$ change
(C-A)
% change
(C-A)
2014
$
2015
$
2016
$
earnings per share 3.03 3.04 4.22 1.18 38.82% 1.19 39.27%
q.
Executive
compensation
Particulars A B C $
chan
ge
(C-B)
% change
(C-B)
$ change
(C-A)
% change
(C-A)
2014
$
2015
$
2016
$
Executive
compensation 0 0 0 0 #DIV/0! 0 #DIV/0!
4.
ACCOUNTING AND FINANCIAL REPORTING 8
2014 2015 2016
$260.00
$265.00
$270.00
$275.00
$280.00
$285.00
$290.00
$295.00
$300.00
$305.00
$294.00
$275.00
$300.00
cash
cash
Linear (cash)
years
2014 2015 2016
$1,300.00
$1,350.00
$1,400.00
$1,450.00
$1,500.00
$1,550.00
$1,600.00
$1,650.00
$1,700.00
$1,750.00
$1,444.00
$1,506.00
$1,728.00
total current assets
total current assets
Linear (total current assets)
years
2014 2015 2016
$260.00
$265.00
$270.00
$275.00
$280.00
$285.00
$290.00
$295.00
$300.00
$305.00
$294.00
$275.00
$300.00
cash
cash
Linear (cash)
years
2014 2015 2016
$1,300.00
$1,350.00
$1,400.00
$1,450.00
$1,500.00
$1,550.00
$1,600.00
$1,650.00
$1,700.00
$1,750.00
$1,444.00
$1,506.00
$1,728.00
total current assets
total current assets
Linear (total current assets)
years
⊘ This is a preview!⊘
Do you want full access?
Subscribe today to unlock all pages.
Trusted by 1+ million students worldwide
ACCOUNTING AND FINANCIAL REPORTING 9
2014 2015 2016
$9,000.00
$9,100.00
$9,200.00
$9,300.00
$9,400.00
$9,500.00
$9,600.00
$9,700.00
$9,800.00
$9,308.00 $9,340.00
$9,743.00
Total assets
Total assets
Linear (Total assets)
years
2014 2015 2016
$-
$200.00
$400.00
$600.00
$800.00
$1,000.00
$1,200.00
$1,400.00
$1,600.00
$1,800.00
$2,000.00
$1,486.00 $1,502.00
$1,820.00
Total current liabilities
Total current liabilities
Linear (Total current
liabilities)
years
2014 2015 2016
$9,000.00
$9,100.00
$9,200.00
$9,300.00
$9,400.00
$9,500.00
$9,600.00
$9,700.00
$9,800.00
$9,308.00 $9,340.00
$9,743.00
Total assets
Total assets
Linear (Total assets)
years
2014 2015 2016
$-
$200.00
$400.00
$600.00
$800.00
$1,000.00
$1,200.00
$1,400.00
$1,600.00
$1,800.00
$2,000.00
$1,486.00 $1,502.00
$1,820.00
Total current liabilities
Total current liabilities
Linear (Total current
liabilities)
years
Paraphrase This Document
Need a fresh take? Get an instant paraphrase of this document with our AI Paraphraser
ACCOUNTING AND FINANCIAL REPORTING 10
2014 2015 2016
$5,400.00
$5,600.00
$5,800.00
$6,000.00
$6,200.00
$6,400.00
$6,600.00
$6,800.00
$7,000.00
$7,200.00
$7,400.00
$6,013.00
$6,680.00
$7,202.00
Total liabilities
Total liabilities
Linear (Total liabilities)
years
2014 2015 2016
$-
$1,000.00
$2,000.00
$3,000.00
$4,000.00
$5,000.00
$6,000.00
$7,000.00
$8,000.00
$9,000.00
$10,000.00
$7,352.00
$8,064.00
$8,994.00
retained earnings
retained earnings
Linear (retained earnings)
years
2014 2015 2016
$5,400.00
$5,600.00
$5,800.00
$6,000.00
$6,200.00
$6,400.00
$6,600.00
$6,800.00
$7,000.00
$7,200.00
$7,400.00
$6,013.00
$6,680.00
$7,202.00
Total liabilities
Total liabilities
Linear (Total liabilities)
years
2014 2015 2016
$-
$1,000.00
$2,000.00
$3,000.00
$4,000.00
$5,000.00
$6,000.00
$7,000.00
$8,000.00
$9,000.00
$10,000.00
$7,352.00
$8,064.00
$8,994.00
retained earnings
retained earnings
Linear (retained earnings)
years
ACCOUNTING AND FINANCIAL REPORTING 11
2014 2015 2016
$-
$500.00
$1,000.00
$1,500.00
$2,000.00
$2,500.00
$3,000.00
$3,500.00 $3,295.00
$2,660.00 $2,541.00
total stockholder's equity
total stockholder's equity
Linear (total stockholder's
equity)
years
2014 2015 2016
$-
$50.00
$100.00
$150.00
$200.00
$250.00
$300.00
$350.00
$400.00
$450.00 $395.70 $395.70 $395.70
number of shares outstanding
number of shares outstanding
Linear (number of shares
outstanding)
years
2014 2015 2016
$-
$500.00
$1,000.00
$1,500.00
$2,000.00
$2,500.00
$3,000.00
$3,500.00 $3,295.00
$2,660.00 $2,541.00
total stockholder's equity
total stockholder's equity
Linear (total stockholder's
equity)
years
2014 2015 2016
$-
$50.00
$100.00
$150.00
$200.00
$250.00
$300.00
$350.00
$400.00
$450.00 $395.70 $395.70 $395.70
number of shares outstanding
number of shares outstanding
Linear (number of shares
outstanding)
years
⊘ This is a preview!⊘
Do you want full access?
Subscribe today to unlock all pages.
Trusted by 1+ million students worldwide
1 out of 21
Related Documents


Your All-in-One AI-Powered Toolkit for Academic Success.
+13062052269
info@desklib.com
Available 24*7 on WhatsApp / Email
![[object Object]](/_next/static/media/star-bottom.7253800d.svg)
Unlock your academic potential
Copyright © 2020–2026 A2Z Services. All Rights Reserved. Developed and managed by ZUCOL.