Economic Modeling: Optimizing Fish Harvest Time for Maximum Weight

Verified

Added on  2023/06/10

|4
|638
|181
Homework Assignment
AI Summary
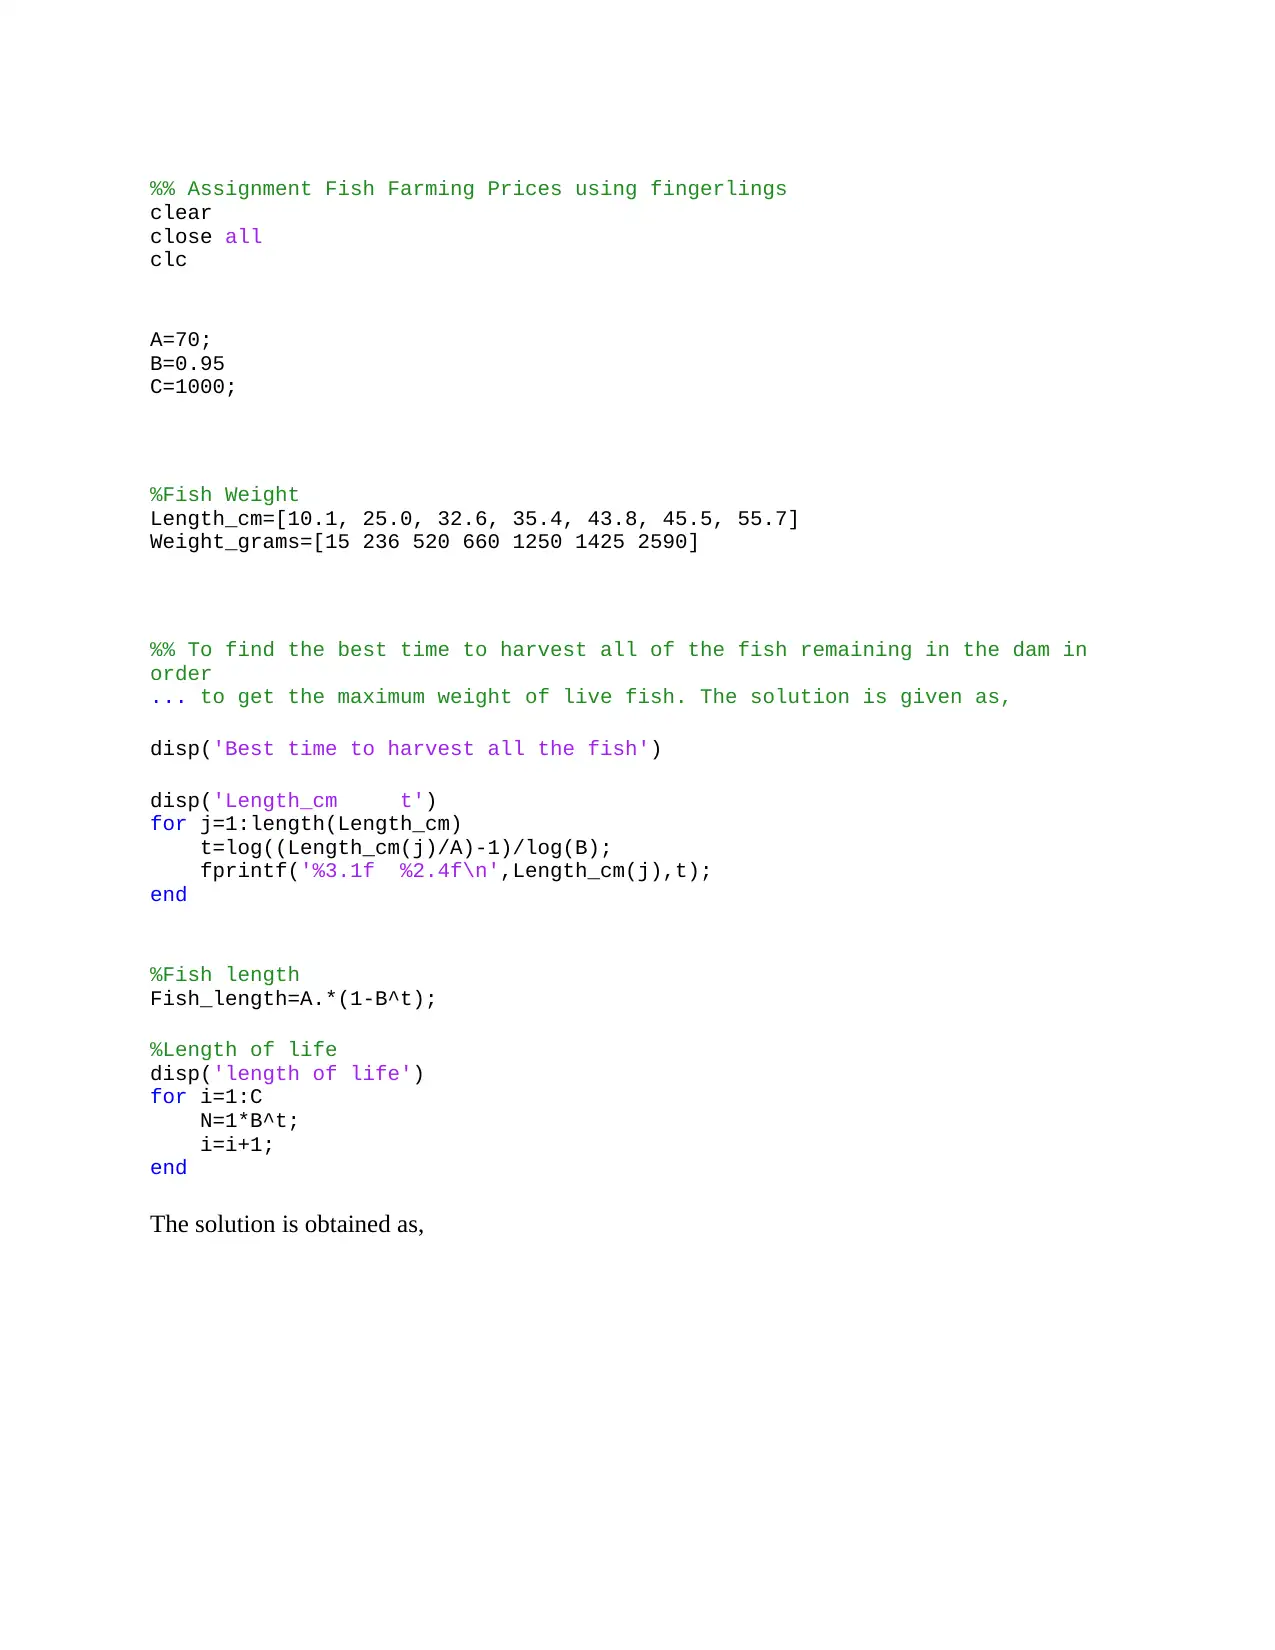
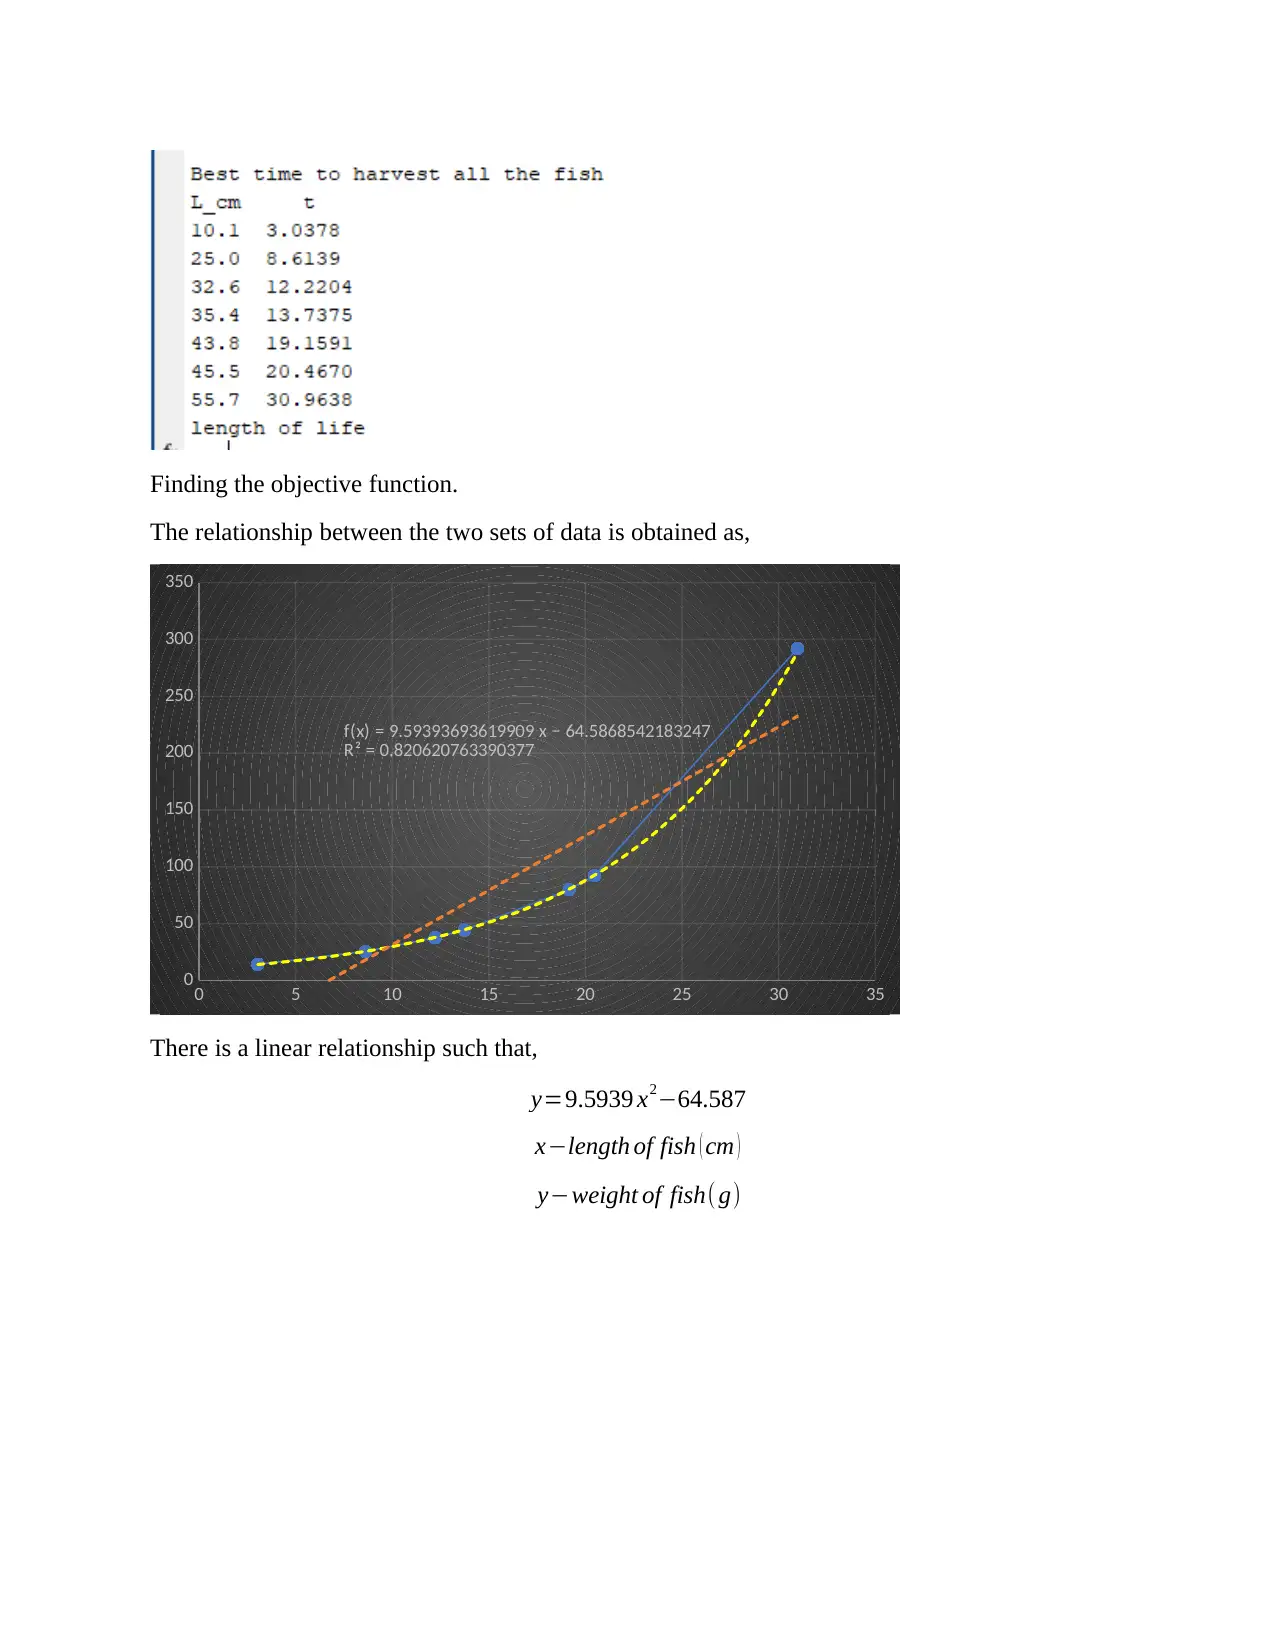
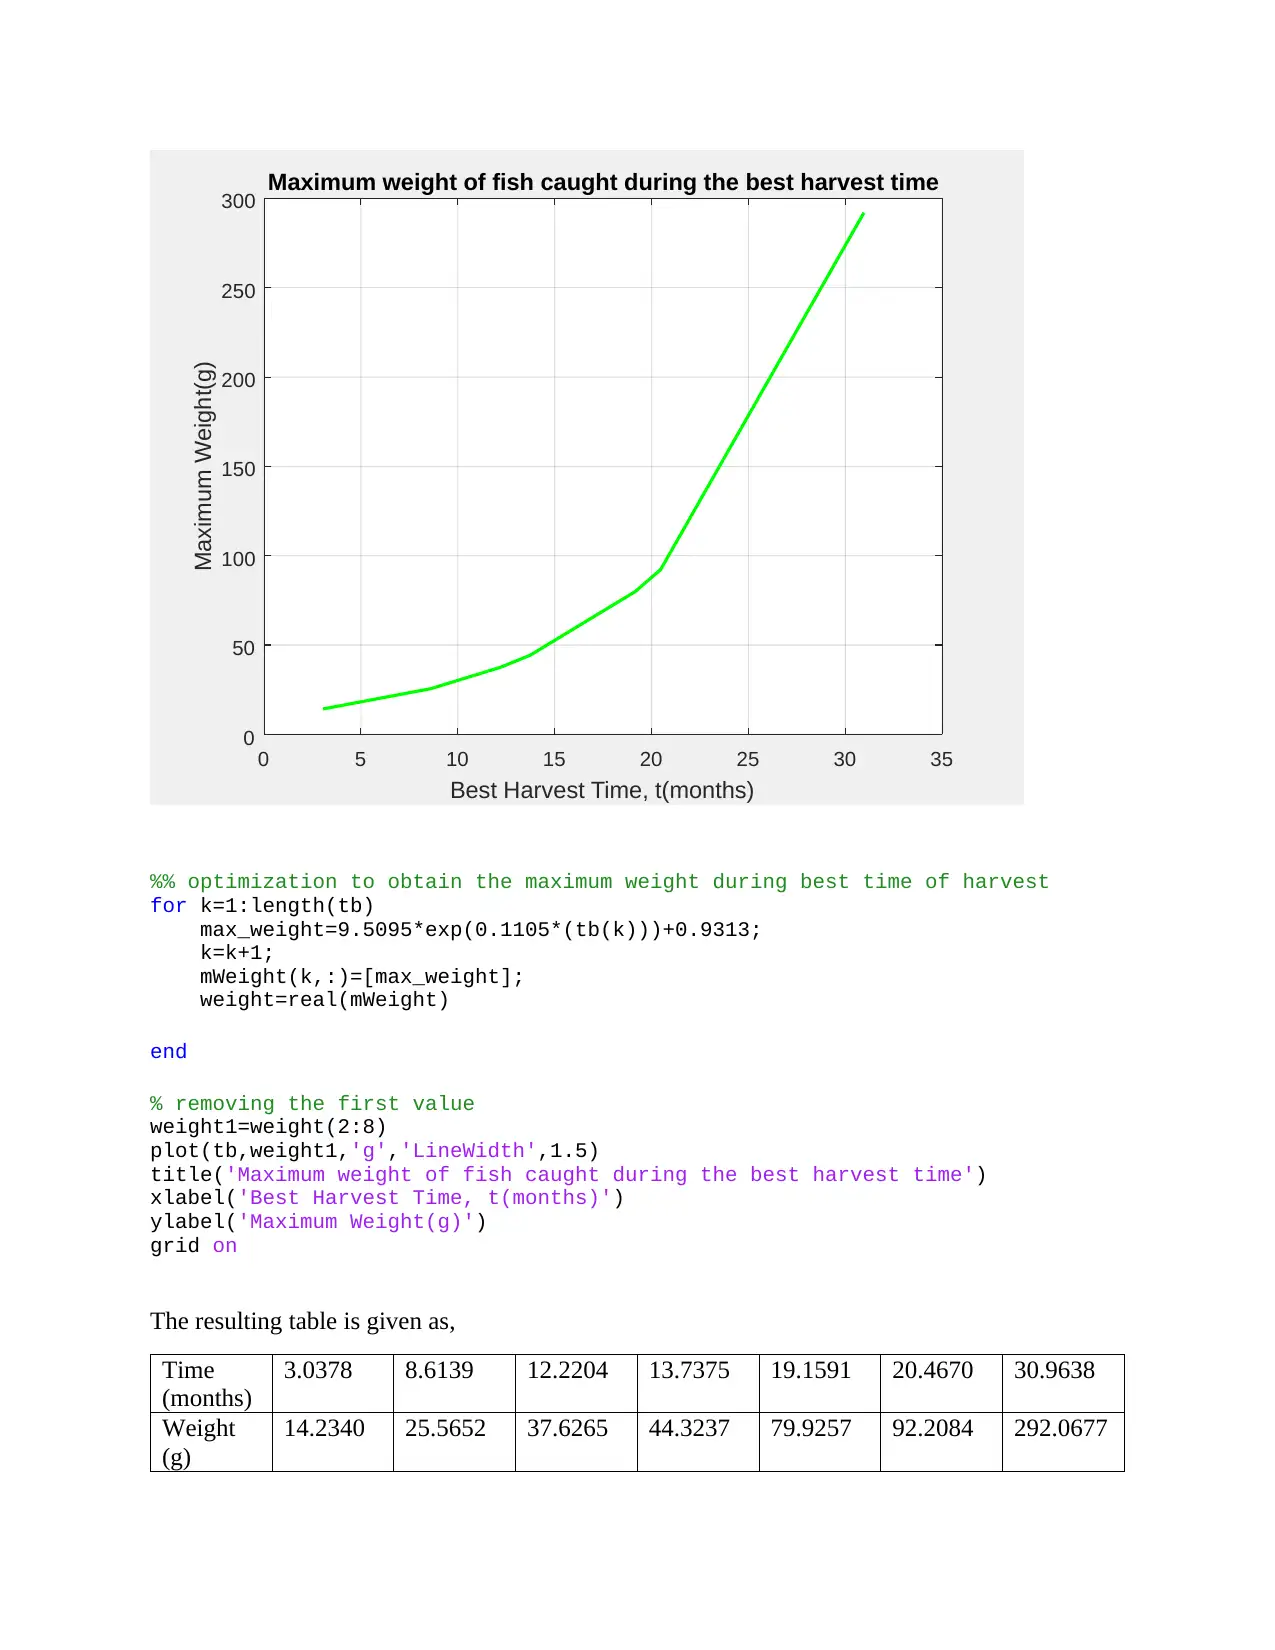
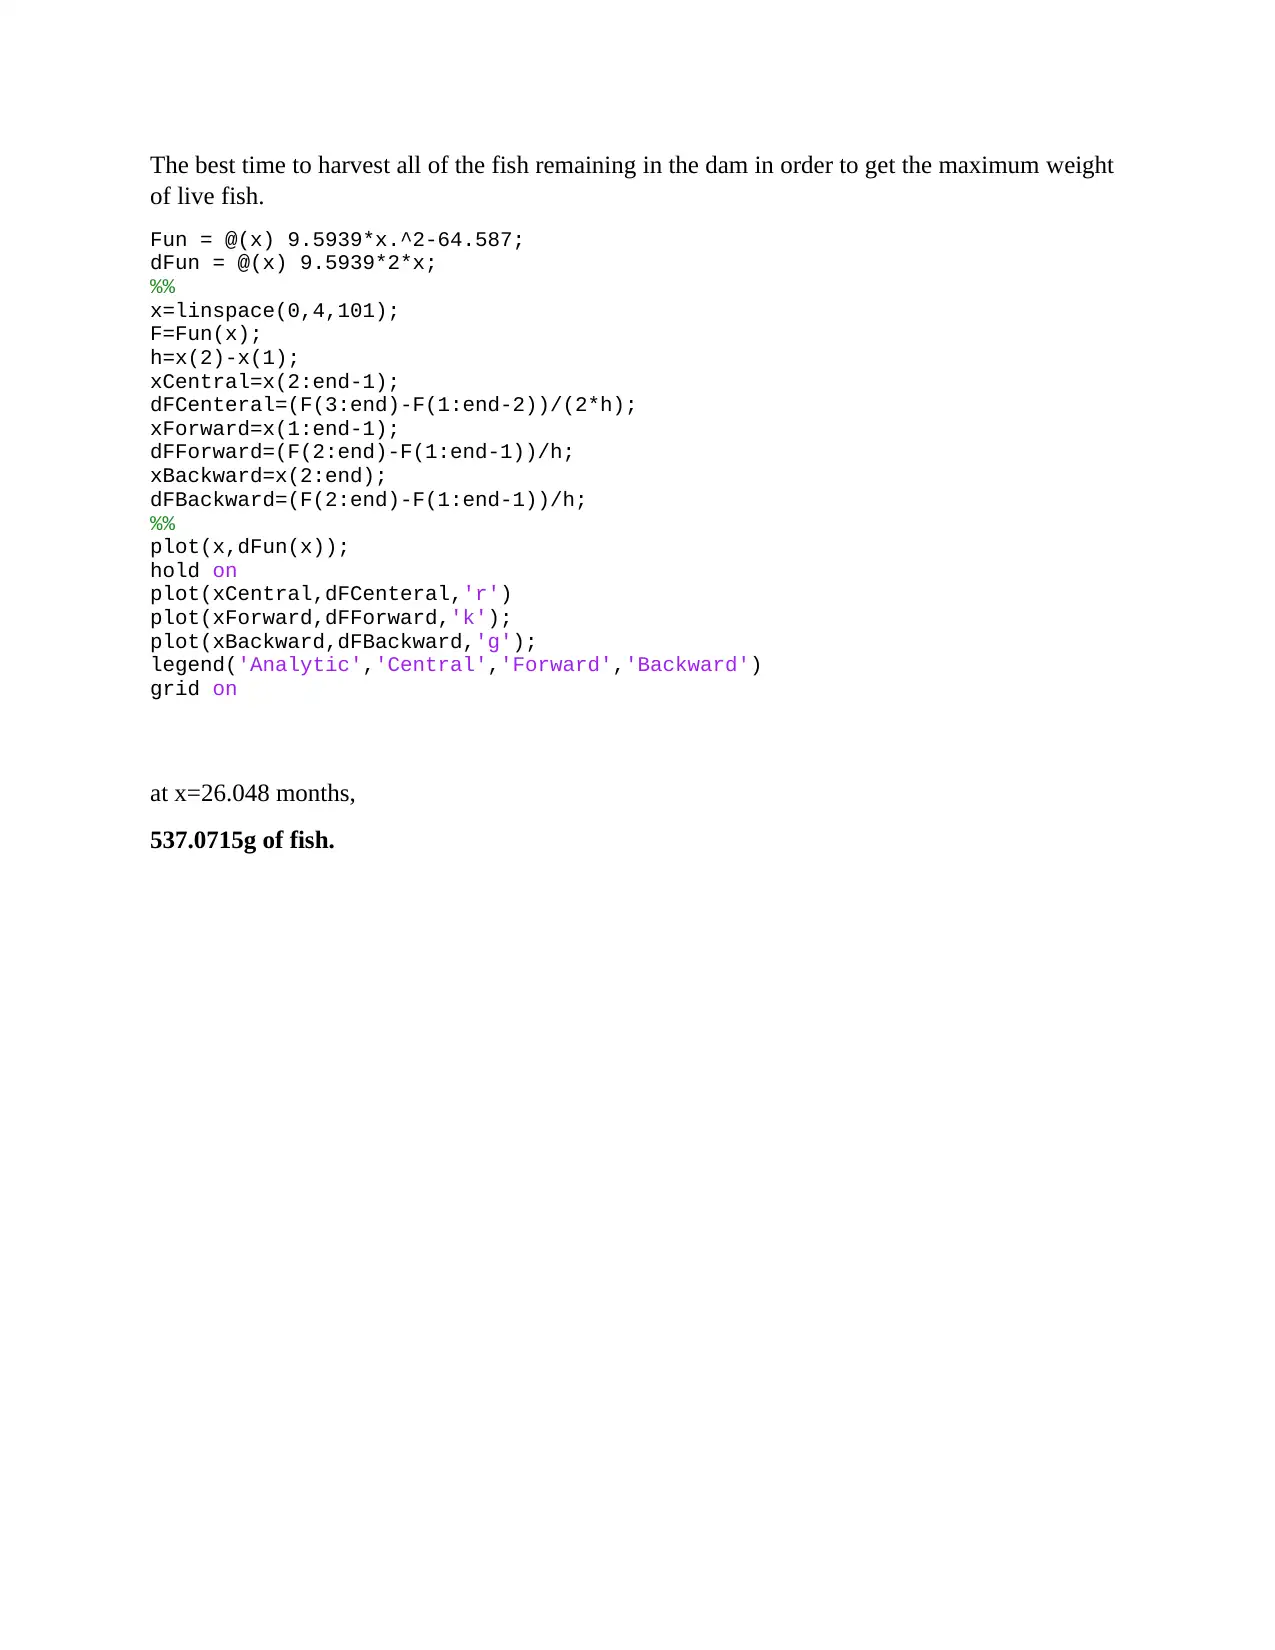
This assignment focuses on optimizing the harvest time in fish farming to achieve the maximum weight of live fish. It utilizes a given formula relating fish length to time elapsed since the fingerlings were placed in the dam, as well as weight-length data for a specific fish species. The assignment aims to determine the best time to harvest the fish by considering both the growth rate and the mortality rate of the fish population. It establishes a relationship between fish length and weight, finding a linear equation to model this relationship. The solution involves finding the time at which the fish should be harvested to maximize their weight, taking into account the decreasing number of live fish over time. The assignment also incorporates optimization techniques to determine the maximum weight during the best harvest time, providing a table of time versus weight and a plot visualizing this relationship. The study concludes with an estimation of fish weight at a specific time using numerical methods.
Document Page
%% Assignment Fish Farming Prices using fingerlings
clear
close all
clc
A=70;
B=0.95
C=1000;
%Fish Weight
Length_cm=[10.1, 25.0, 32.6, 35.4, 43.8, 45.5, 55.7]
Weight_grams=[15 236 520 660 1250 1425 2590]
%% To find the best time to harvest all of the fish remaining in the dam in
order
... to get the maximum weight of live fish. The solution is given as,
disp('Best time to harvest all the fish')
disp('Length_cm t')
for j=1:length(Length_cm)
t=log((Length_cm(j)/A)-1)/log(B);
fprintf('%3.1f %2.4f\n',Length_cm(j),t);
end
%Fish length
Fish_length=A.*(1-B^t);
%Length of life
disp('length of life')
for i=1:C
N=1*B^t;
i=i+1;
end
The solution is obtained as,
tabler-icon-diamond-filled.svg

Secure Best Marks with AI Grader

Need help grading? Try our AI Grader for instant feedback on your assignments.
Document Page
Finding the objective function.
The relationship between the two sets of data is obtained as,
0 5 10 15 20 25 30 35
0
50
100
150
200
250
300
350
f(x) = 9.59393693619909 x − 64.5868542183247
R² = 0.820620763390377
There is a linear relationship such that,
y=9.5939 x264.587
xlength of fish ( cm )
yweight of fish( g)
Document Page
0 5 10 15 20 25 30 35
Best Harvest Time, t(months)
0
50
100
150
200
250
300
Maximum Weight(g)
Maximum weight of fish caught during the best harvest time
%% optimization to obtain the maximum weight during best time of harvest
for k=1:length(tb)
max_weight=9.5095*exp(0.1105*(tb(k)))+0.9313;
k=k+1;
mWeight(k,:)=[max_weight];
weight=real(mWeight)
end
% removing the first value
weight1=weight(2:8)
plot(tb,weight1,'g','LineWidth',1.5)
title('Maximum weight of fish caught during the best harvest time')
xlabel('Best Harvest Time, t(months)')
ylabel('Maximum Weight(g)')
grid on
The resulting table is given as,
Time
(months)
3.0378 8.6139 12.2204 13.7375 19.1591 20.4670 30.9638
Weight
(g)
14.2340 25.5652 37.6265 44.3237 79.9257 92.2084 292.0677
Document Page
The best time to harvest all of the fish remaining in the dam in order to get the maximum weight
of live fish.
Fun = @(x) 9.5939*x.^2-64.587;
dFun = @(x) 9.5939*2*x;
%%
x=linspace(0,4,101);
F=Fun(x);
h=x(2)-x(1);
xCentral=x(2:end-1);
dFCenteral=(F(3:end)-F(1:end-2))/(2*h);
xForward=x(1:end-1);
dFForward=(F(2:end)-F(1:end-1))/h;
xBackward=x(2:end);
dFBackward=(F(2:end)-F(1:end-1))/h;
%%
plot(x,dFun(x));
hold on
plot(xCentral,dFCenteral,'r')
plot(xForward,dFForward,'k');
plot(xBackward,dFBackward,'g');
legend('Analytic','Central','Forward','Backward')
grid on
at x=26.048 months,
537.0715g of fish.
chevron_up_icon
1 out of 4
circle_padding
hide_on_mobile
zoom_out_icon
[object Object]