Statistical Analysis: Fish Parasite Prevalence and Depth Relationship

Verified

Added on  2019/12/28

|16
|2055
|294
Report
AI Summary
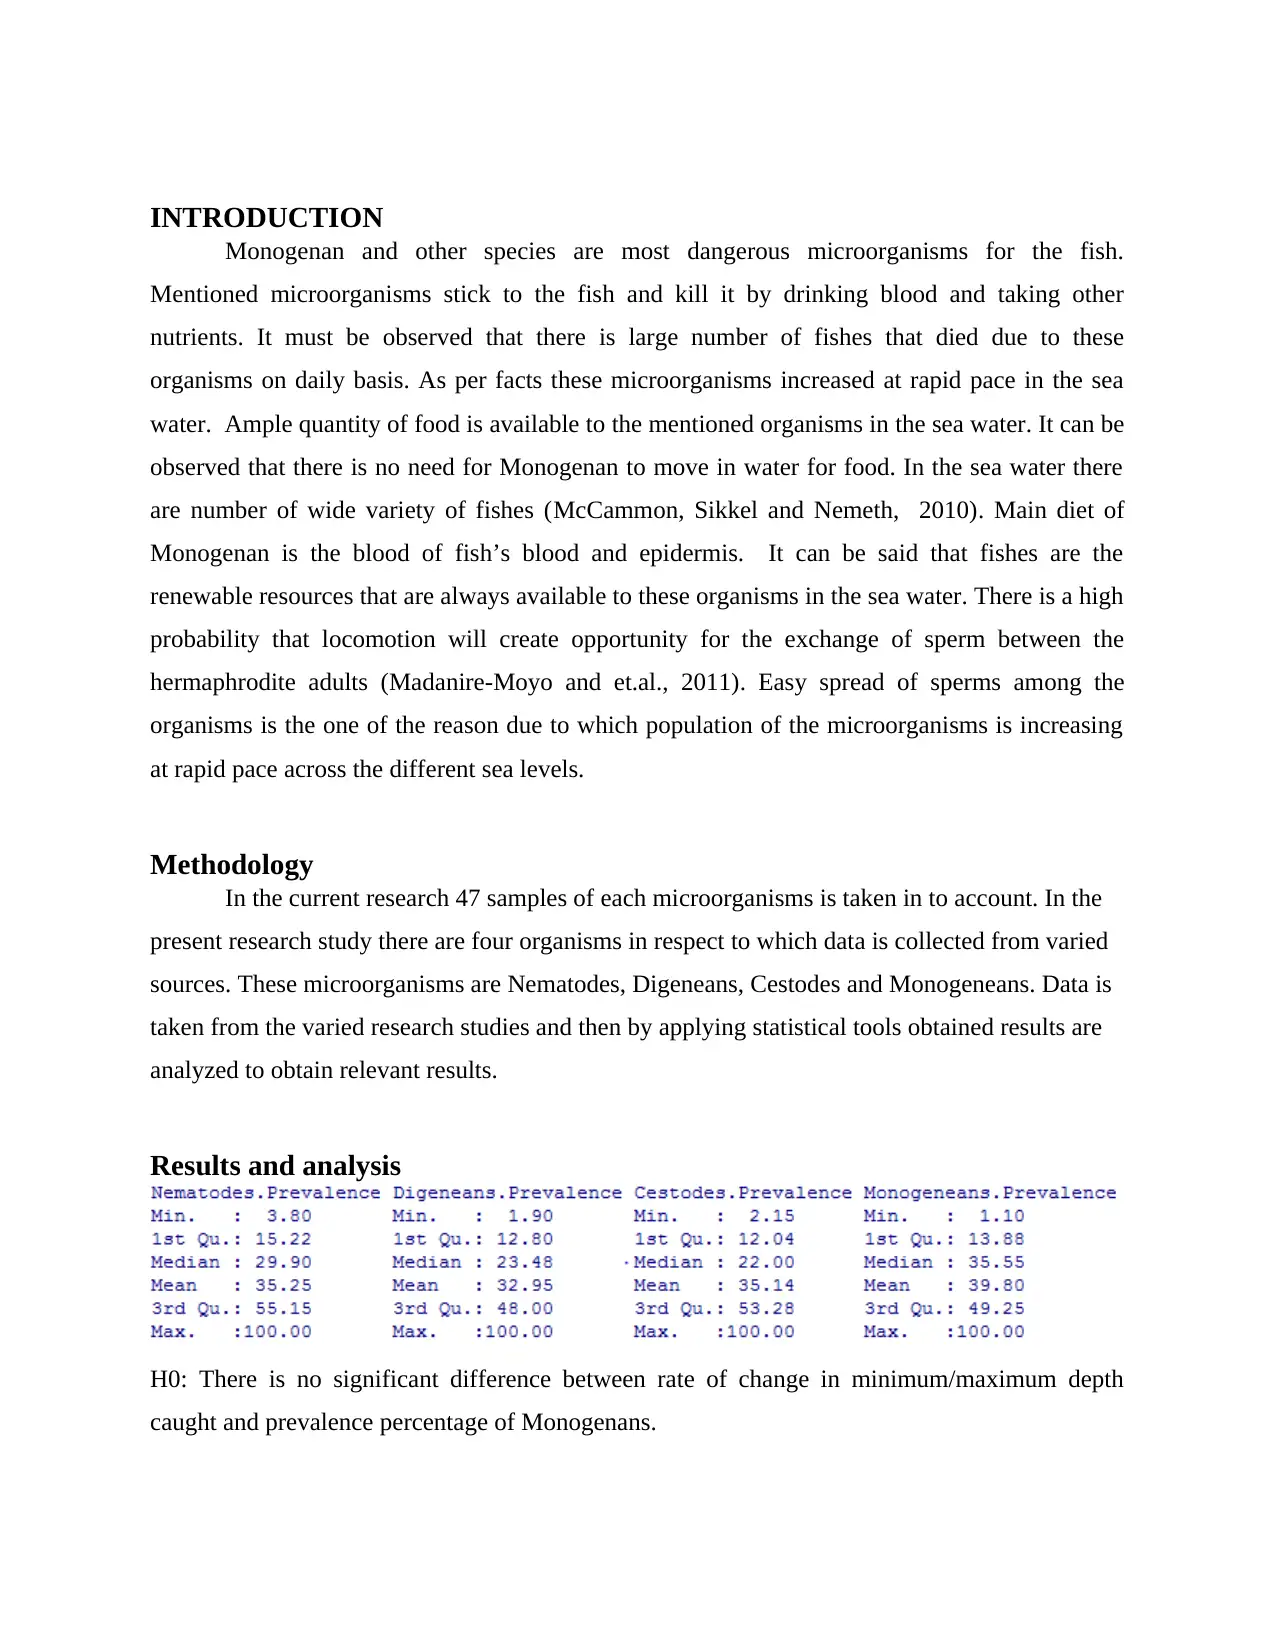
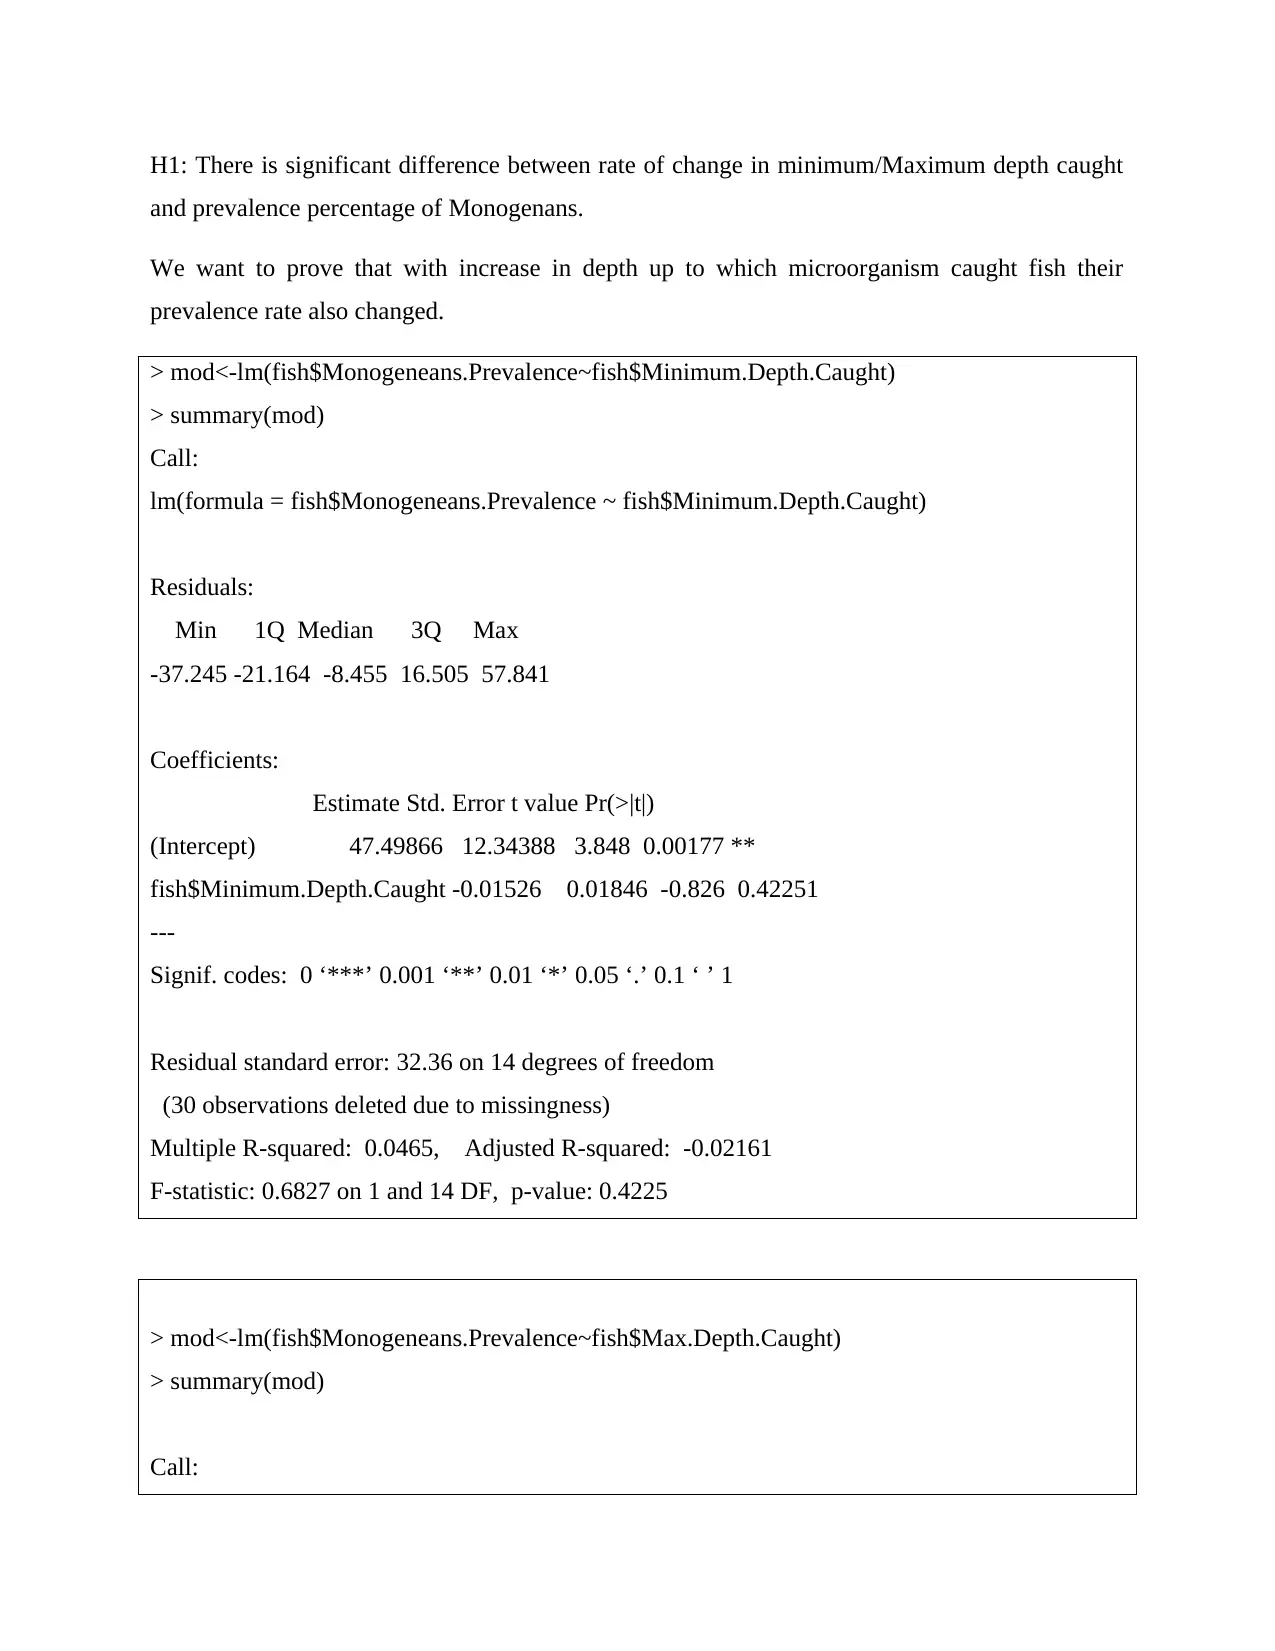
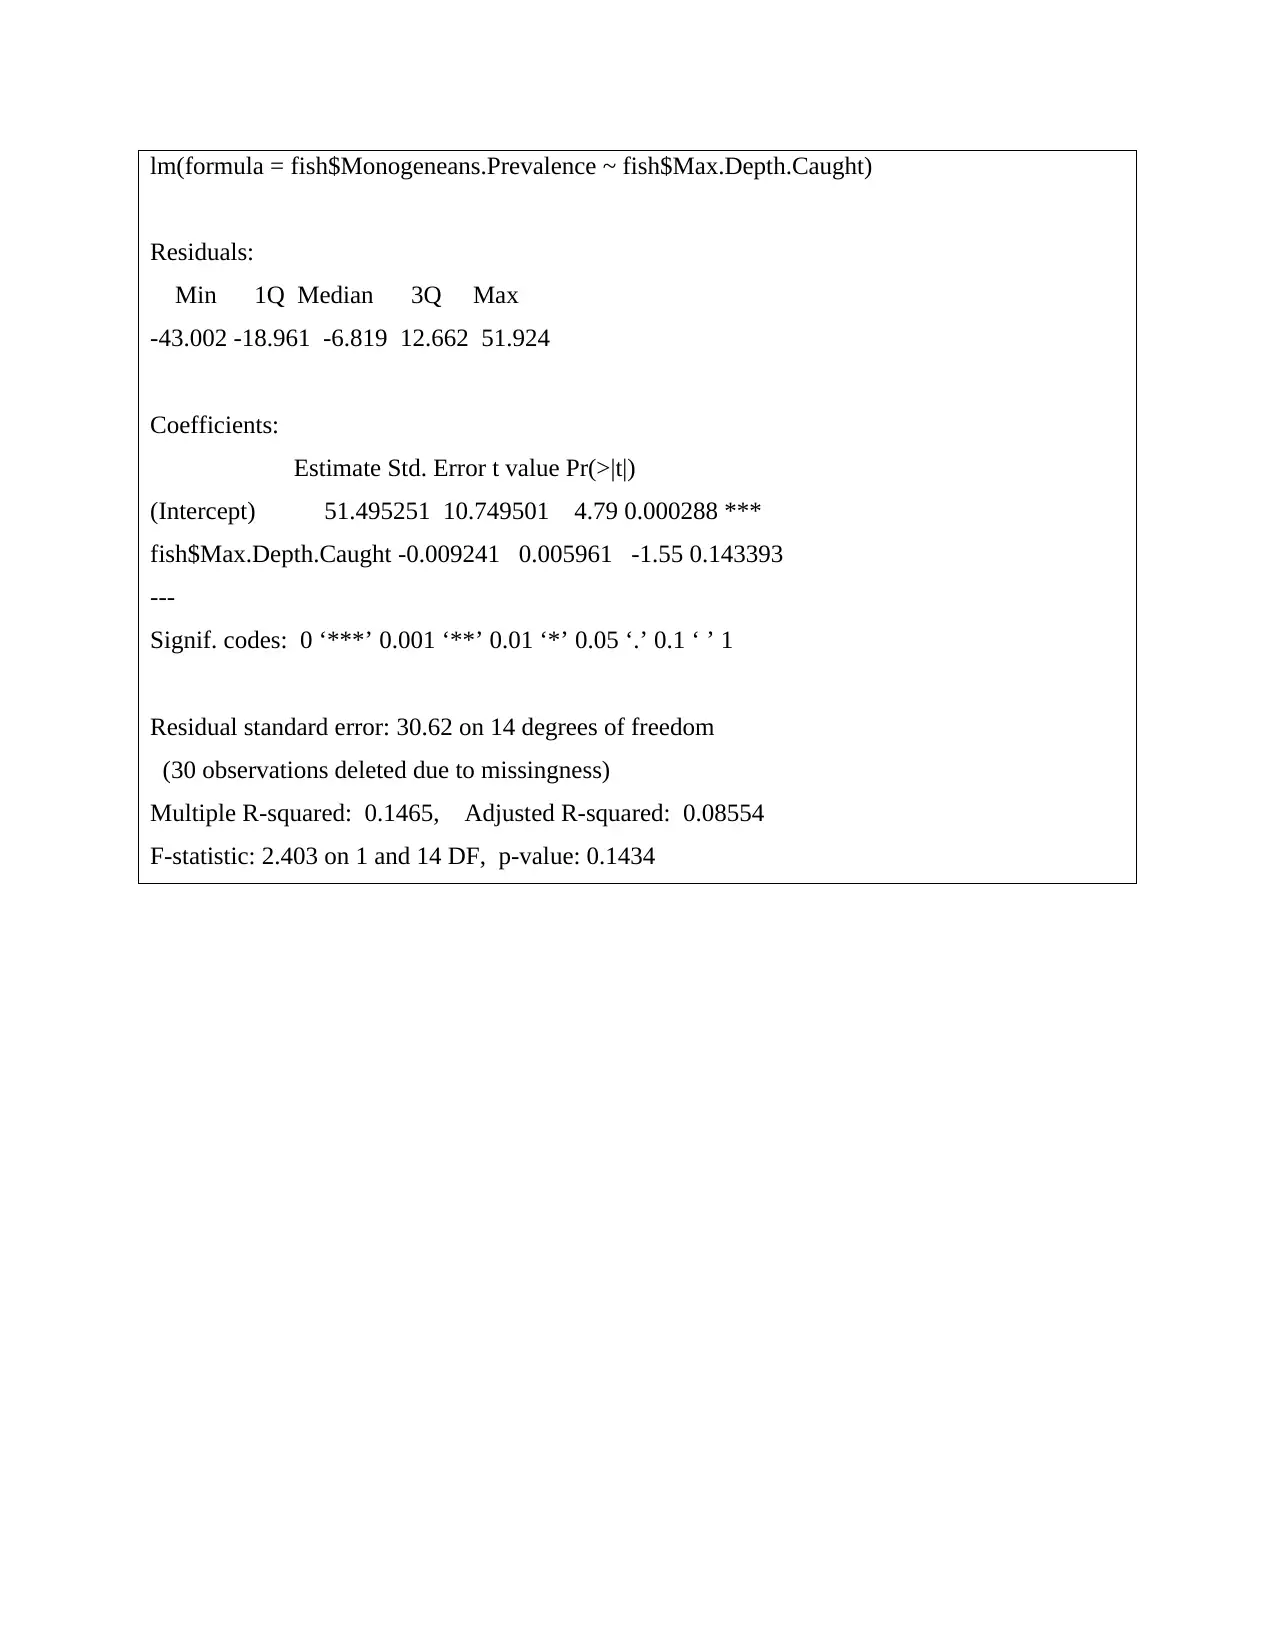
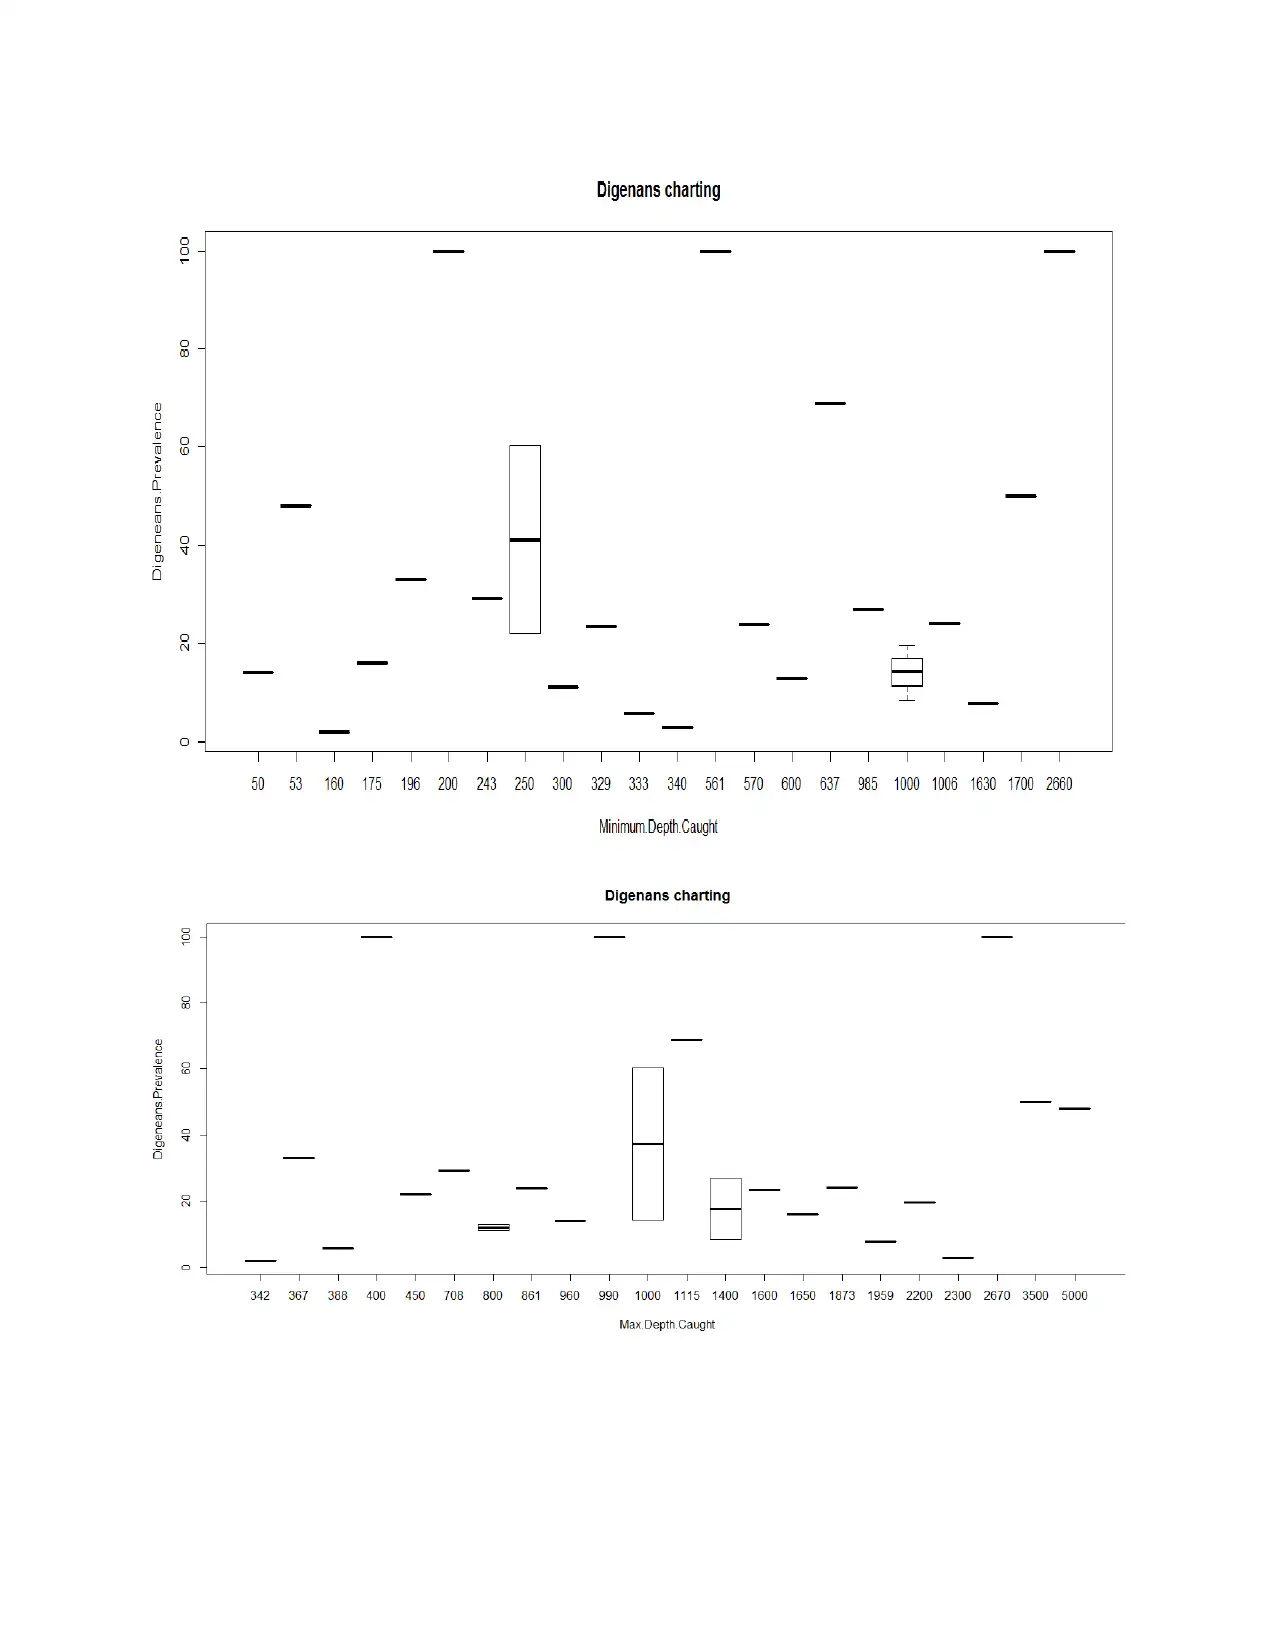
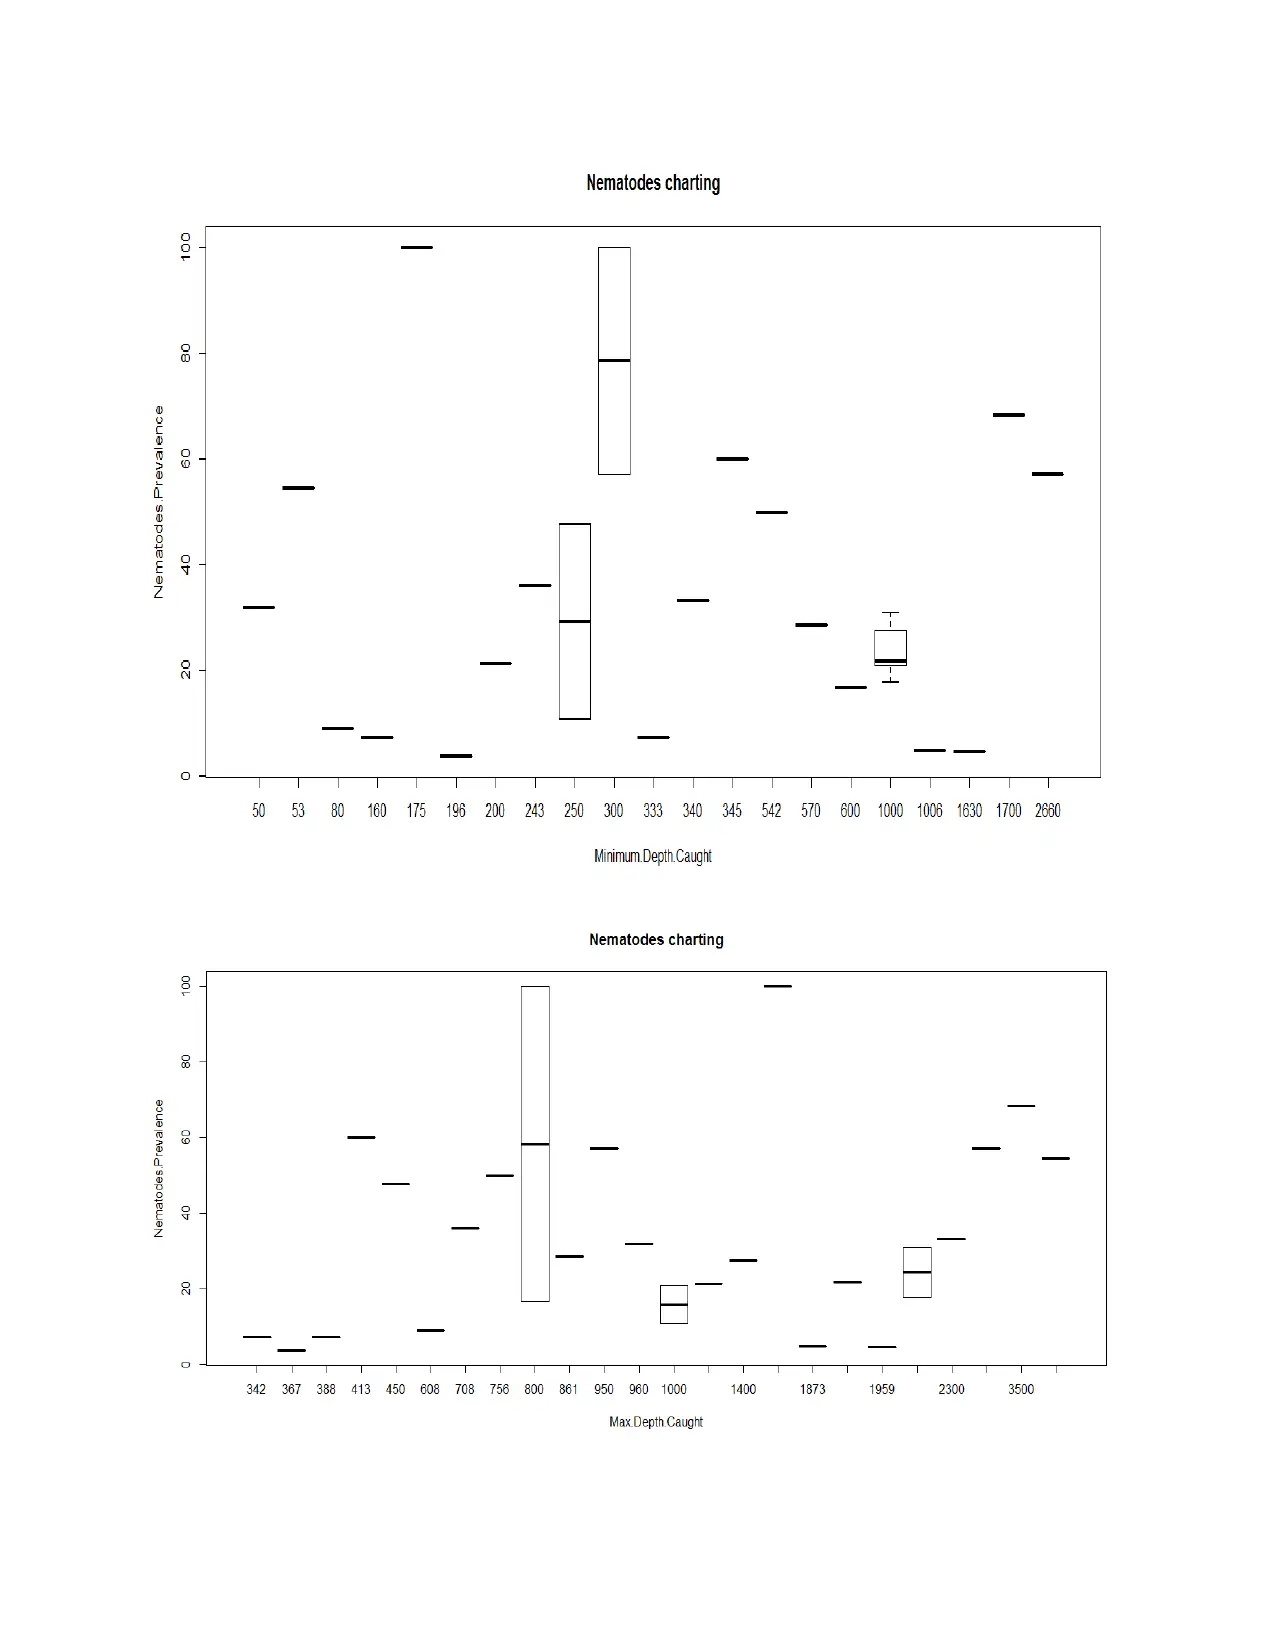
This report investigates the prevalence of several fish parasites, including Monogenans, Digeneans, Cestodes, and Nematodes, and their relationship with minimum and maximum water depths. The methodology involves analyzing data from research studies using statistical tools, specifically linear regression models. The results, presented through statistical output, indicate that the rate of prevalence increase for all microorganisms is consistent with changes in both minimum and maximum depth levels. The study concludes that while the rate of enhancement is similar across the different parasite types, their presence varies at different water depths. The analysis includes the calculation of p-values and coefficients to determine the significance of the relationship between depth and parasite prevalence, highlighting that the prevalence rate changes at the same rate with increase in maximum catching limit.
Document Page
STATISTICS
tabler-icon-diamond-filled.svg

Paraphrase This Document

Need a fresh take? Get an instant paraphrase of this document with our AI Paraphraser
Document Page
TABLE OF CONTENTS
INTRODUCTION.......................................................................................................................................3
Methodology...............................................................................................................................................3
Results and analysis.....................................................................................................................................3
CONCLUSION.........................................................................................................................................16
REFERENCES..........................................................................................................................................17
Document Page
INTRODUCTION
Monogenan and other species are most dangerous microorganisms for the fish.
Mentioned microorganisms stick to the fish and kill it by drinking blood and taking other
nutrients. It must be observed that there is large number of fishes that died due to these
organisms on daily basis. As per facts these microorganisms increased at rapid pace in the sea
water. Ample quantity of food is available to the mentioned organisms in the sea water. It can be
observed that there is no need for Monogenan to move in water for food. In the sea water there
are number of wide variety of fishes (McCammon, Sikkel and Nemeth, 2010). Main diet of
Monogenan is the blood of fish’s blood and epidermis. It can be said that fishes are the
renewable resources that are always available to these organisms in the sea water. There is a high
probability that locomotion will create opportunity for the exchange of sperm between the
hermaphrodite adults (Madanire-Moyo and et.al., 2011). Easy spread of sperms among the
organisms is the one of the reason due to which population of the microorganisms is increasing
at rapid pace across the different sea levels.
Methodology
In the current research 47 samples of each microorganisms is taken in to account. In the
present research study there are four organisms in respect to which data is collected from varied
sources. These microorganisms are Nematodes, Digeneans, Cestodes and Monogeneans. Data is
taken from the varied research studies and then by applying statistical tools obtained results are
analyzed to obtain relevant results.
Results and analysis
H0: There is no significant difference between rate of change in minimum/maximum depth
caught and prevalence percentage of Monogenans.
Document Page
H1: There is significant difference between rate of change in minimum/Maximum depth caught
and prevalence percentage of Monogenans.
We want to prove that with increase in depth up to which microorganism caught fish their
prevalence rate also changed.
> mod<-lm(fish$Monogeneans.Prevalence~fish$Minimum.Depth.Caught)
> summary(mod)
Call:
lm(formula = fish$Monogeneans.Prevalence ~ fish$Minimum.Depth.Caught)
Residuals:
Min 1Q Median 3Q Max
-37.245 -21.164 -8.455 16.505 57.841
Coefficients:
Estimate Std. Error t value Pr(>|t|)
(Intercept) 47.49866 12.34388 3.848 0.00177 **
fish$Minimum.Depth.Caught -0.01526 0.01846 -0.826 0.42251
---
Signif. codes: 0 ‘***’ 0.001 ‘**’ 0.01 ‘*’ 0.05 ‘.’ 0.1 ‘ ’ 1
Residual standard error: 32.36 on 14 degrees of freedom
(30 observations deleted due to missingness)
Multiple R-squared: 0.0465, Adjusted R-squared: -0.02161
F-statistic: 0.6827 on 1 and 14 DF, p-value: 0.4225
> mod<-lm(fish$Monogeneans.Prevalence~fish$Max.Depth.Caught)
> summary(mod)
Call:
tabler-icon-diamond-filled.svg

Paraphrase This Document

Need a fresh take? Get an instant paraphrase of this document with our AI Paraphraser
Document Page
lm(formula = fish$Monogeneans.Prevalence ~ fish$Max.Depth.Caught)
Residuals:
Min 1Q Median 3Q Max
-43.002 -18.961 -6.819 12.662 51.924
Coefficients:
Estimate Std. Error t value Pr(>|t|)
(Intercept) 51.495251 10.749501 4.79 0.000288 ***
fish$Max.Depth.Caught -0.009241 0.005961 -1.55 0.143393
---
Signif. codes: 0 ‘***’ 0.001 ‘**’ 0.01 ‘*’ 0.05 ‘.’ 0.1 ‘ ’ 1
Residual standard error: 30.62 on 14 degrees of freedom
(30 observations deleted due to missingness)
Multiple R-squared: 0.1465, Adjusted R-squared: 0.08554
F-statistic: 2.403 on 1 and 14 DF, p-value: 0.1434
Document Page
H0: There is no significant difference between rate of change in minimum/maximum depth
caught and prevalence percentage of Digeneans.
Document Page
H1: There is significant difference between rate of change in minimum/maximum depth caught
and prevalence percentage of Digeneans
> mod<-lm(fish$Digeneans.Prevalence~fish$Minimum.Depth.Caught)
> summary(mod)
Call:
lm(formula = fish$Digeneans.Prevalence ~ fish$Minimum.Depth.Caught)
Residuals:
Min 1Q Median 3Q Max
-37.639 -19.525 -10.327 5.819 72.769
Coefficients:
Estimate Std. Error t value Pr(>|t|)
(Intercept) 24.68492 8.81868 2.799 0.0102 *
fish$Minimum.Depth.Caught 0.01273 0.00992 1.284 0.2121
---
Signif. codes: 0 ‘***’ 0.001 ‘**’ 0.01 ‘*’ 0.05 ‘.’ 0.1 ‘ ’ 1
Residual standard error: 30.13 on 23 degrees of freedom
(21 observations deleted due to missingness)
Multiple R-squared: 0.06685, Adjusted R-squared: 0.02628
F-statistic: 1.648 on 1 and 23 DF, p-value: 0.2121
> mod<-lm(fish$Digeneans.Prevalence~fish$Max.Depth.Caught)
> summary(mod)
Call:
lm(formula = fish$Digeneans.Prevalence ~ fish$Max.Depth.Caught)
tabler-icon-diamond-filled.svg

Paraphrase This Document

Need a fresh take? Get an instant paraphrase of this document with our AI Paraphraser
Document Page
Residuals:
Min 1Q Median 3Q Max
-33.630 -17.857 -10.172 4.418 71.282
Coefficients:
Estimate Std. Error t value Pr(>|t|)
(Intercept) 27.072869 10.320276 2.623 0.0152 *
fish$Max.Depth.Caught 0.004112 0.005788 0.710 0.4846
---
Signif. codes: 0 ‘***’ 0.001 ‘**’ 0.01 ‘*’ 0.05 ‘.’ 0.1 ‘ ’ 1
Residual standard error: 30.85 on 23 degrees of freedom
(21 observations deleted due to missingness)
Multiple R-squared: 0.02147, Adjusted R-squared: -0.02107
F-statistic: 0.5047 on 1 and 23 DF, p-value: 0.4846
Document Page
Document Page
H0: There is no significant difference between rate of change in minimum/maximum depth
caught and prevalence percentage of Nematodes.
H1: There is significant difference between rate of change in minimum/maximum depth caught
and prevalence percentage of Nematodes.
> mod<-lm(fish$Nematodes.Prevalence~fish$Minimum.Depth.Caught)
> summary(mod)
Call:
lm(formula = fish$Nematodes.Prevalence ~ fish$Minimum.Depth.Caught)
Residuals:
Min 1Q Median 3Q Max
-33.722 -19.460 -5.636 15.193 66.547
Coefficients:
Estimate Std. Error t value Pr(>|t|)
(Intercept) 32.855508 7.257385 4.527 0.000117 ***
fish$Minimum.Depth.Caught 0.003415 0.007317 0.467 0.644568
---
Signif. codes: 0 ‘***’ 0.001 ‘**’ 0.01 ‘*’ 0.05 ‘.’ 0.1 ‘ ’ 1
Residual standard error: 27.15 on 26 degrees of freedom
(18 observations deleted due to missingness)
Multiple R-squared: 0.008309, Adjusted R-squared: -0.02983
F-statistic: 0.2179 on 1 and 26 DF, p-value: 0.6446
> mod<-lm(fish$Nematodes.Prevalence~fish$Max.Depth.Caught)
tabler-icon-diamond-filled.svg

Paraphrase This Document

Need a fresh take? Get an instant paraphrase of this document with our AI Paraphraser
Document Page
> summary(mod)
Call:
lm(formula = fish$Nematodes.Prevalence ~ fish$Max.Depth.Caught)
Residuals:
Min 1Q Median 3Q Max
-33.723 -20.777 -7.325 15.354 68.993
Coefficients:
Estimate Std. Error t value Pr(>|t|)
(Intercept) 25.888038 8.453305 3.062 0.00505 **
fish$Max.Depth.Caught 0.006398 0.004670 1.370 0.18237
---
Signif. codes: 0 ‘***’ 0.001 ‘**’ 0.01 ‘*’ 0.05 ‘.’ 0.1 ‘ ’ 1
Residual standard error: 26.33 on 26 degrees of freedom
(18 observations deleted due to missingness)
Multiple R-squared: 0.06734, Adjusted R-squared: 0.03147
F-statistic: 1.877 on 1 and 26 DF, p-value: 0.1824
Document Page
chevron_up_icon
1 out of 16
circle_padding
hide_on_mobile
zoom_out_icon
[object Object]