Analyzing Macroeconomic Theories: Fisher Effect and Purchasing Parity

Verified

Added on  2023/04/20

|6
|869
|306
Essay
AI Summary
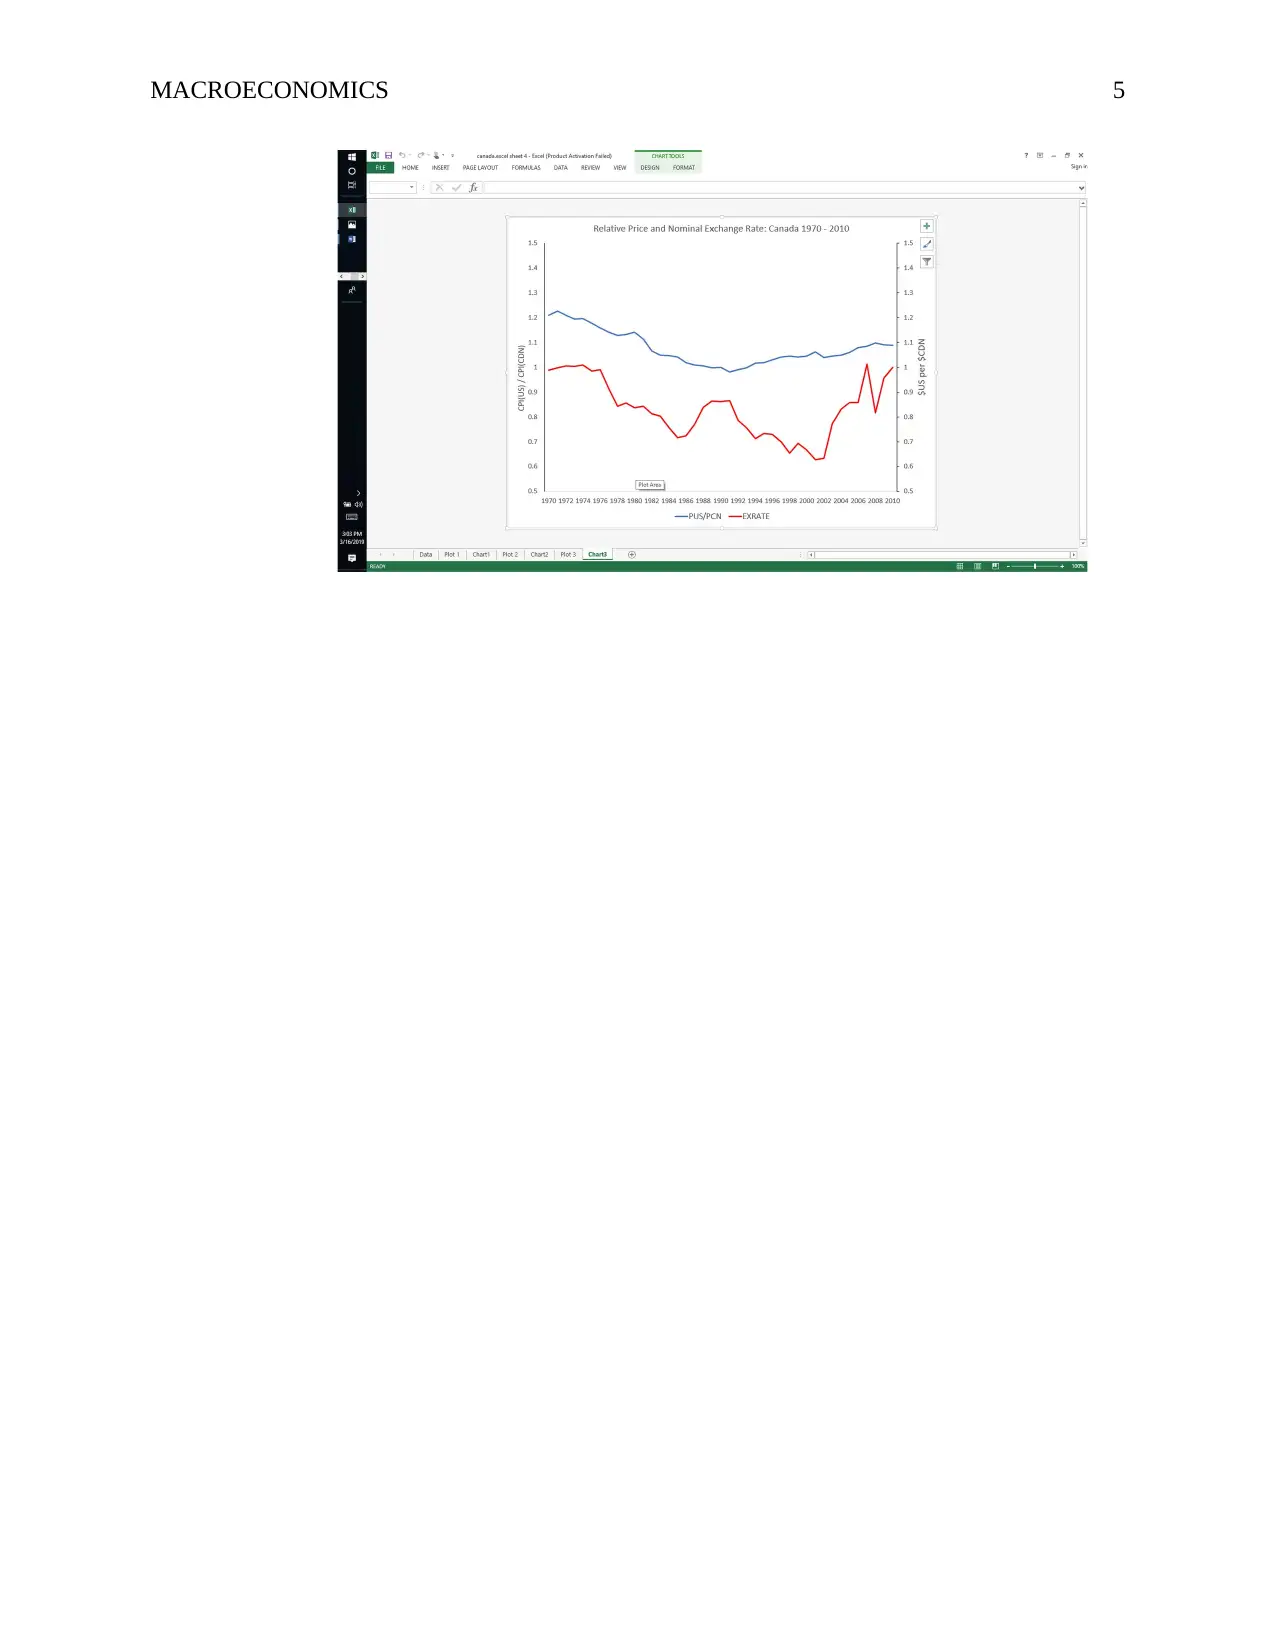
This essay delves into two key macroeconomic concepts: the Fisher Effect and Purchasing Power Parity (PPP). The analysis of the Fisher Effect examines the relationship between inflation, nominal interest rates, and real interest rates, supported by Canadian data illustrating the correlation between money supply growth and inflation. The essay confirms the consistency of the provided data with the Fisher Effect, noting the proportional impact of monetary policy changes on inflation and nominal interest rates. Furthermore, the study explores Purchasing Power Parity, assessing the equilibrium between currencies of different nations using a 'basket of goods' approach. The presented data aligns with PPP theory, demonstrating equilibrium in currency values based on the pricing of goods. The essay references various academic sources to support its analysis and conclusions. Desklib provides access to similar solved assignments and past papers for students.
Document Page
Running head: MACROECONOMICS 1
Macroeconomics
Name
Institution
tabler-icon-diamond-filled.svg

Secure Best Marks with AI Grader

Need help grading? Try our AI Grader for instant feedback on your assignments.
Document Page
MACROECONOMICS 2
Macroeconomics
1. Fisher Effect is a theory in economics, which describes the association
between inflation, and between nominal and real interest. (Katharina Knoll et al.
2016). It asserts that the actual rate of interest is equivalent to the rate of nominal
interest subtracted the rate of inflation. The Effect has been stretched to the
examination of the international currency trading and the money supply. Yes, my
figure is consistent with the view that the growth of money is a determinant of
inflation. The growth of money affects both the inflation rate and the nominal interest
rate. For instance, if there is an adjustment in Canadian central bank monetary policy,
this would result in Canada’s rate of inflation to increase by 10% and a similar 10%
increase in the nominal interest rate (Moritz & Alan. 2013).
The graph below shows the narrow money and the CPI in Canada from 1970-
2010. There is a direct proportion of growth with each increase in the growth of
money. As the growth of money increases each year, the rate of inflation also
increases correspondingly. Between 2003 and 2004, there is a convergence of the
inflation rate and the nominal interest rate in the graph. Therefore, the growth of
money is a significant determinant in the rate of inflation in a country.
Document Page
MACROECONOMICS 3
2. Yes, my figure is consistent with the Fischer’s effect which asserts that the actual rate
interest is correspondent to the rate of nominal interest subtracted the rate of inflation (Manuel et
al. 2016). The growth of money affects both the inflation rate and the nominal interest rate. A
slight increase in the monetary policy in Canada would result in a similar rise in the inflation rate
and the nominal interest rate (Òscar et al.2013). The graph below demonstrates a graph of the
long-term interest rate and the inflation rate of Canada between 1970- 2010. The long-term
interest rate is directly proportional to the inflation rate. This graph is consistent with Fischer's
effect since an increase in the long-term interest rate results in a similar rise in the inflation rate.
Document Page
MACROECONOMICS 4
3 Purchasing power parity is a theory in economics that compares diverse
nation's currency through a "basket of goods" tactic. The rate of exchange must be
priced the same in the two nations (Òscar et al. 2016). This concept states that two
nation's currencies are at par or in equilibrium when a basket of goods is priced the
same in both nations while taking into account the rate of exchange. Yes, my figure is
consistent with the concept of purchasing power parity (Òscar et al. 2015). The graph
below shows the relative price and nominal exchange rate of Canada from 1970 –
2010. The two nation’s currencies in this graph are at par or in equilibrium when a
basket of goods is priced the same in both nations. The exchange rate is taken into
account in this instance. Between 1970 and 2010, the graph shows equilibrium in the
two currencies indicating that the basket of goods was priced the same leading to the
equilibrium in the two nation’s currencies.
tabler-icon-diamond-filled.svg

Secure Best Marks with AI Grader

Need help grading? Try our AI Grader for instant feedback on your assignments.
Document Page
MACROECONOMICS 5
Document Page
MACROECONOMICS 6
References
Katharina Knoll, Moritz Schularick, and Thomas Steger. (2016). No Price Like Home: Global
House Prices. American Economic Review 107(2): 331-353.
Manuel Funke, Moritz Schularick, and Christoph Trebesch. (2016). Going to Extremes: Politics
after Financial Crises, European Economic Review 88: 227-260.
Moritz Schularick and Alan M. Taylor. (2013). Credit Booms Gone Bust: Monetary Policy,
Leverage Cycles, and Financial Crises. American Economic Review 102(2): 1029-1061.
Òscar Jordà, Moritz Schularick, and Alan M. Taylor. (2015). Betting the House, Journal of
International Economics 96(S1): S2-S18.
Òscar Jordà, Moritz Schularick, and Alan M. Taylor. (2015). Leveraged Bubbles, Journal of
Monetary Economics 76: S1-S20.
Òscar Jordà, Moritz Schularick, and Alan M. Taylor. (2016). Sovereigns versus Banks: Credit,
Crises, and Consequences, Journal of the European Economic Association 14(1): 45-79.
Òscar Jordà, Moritz Schularick, and Alan M. Taylor. (2016). The Great Mortgaging: Housing
Finance, Crises, and Business Cycles, Economic Policy 31(85): 107-115.
Òscar Jordà, Moritz Schularick, and Alan M. Taylor. (2013). When Credit Bites Back, Journal of
Money, Credit and Banking 45(s2): 3-28.
chevron_up_icon
1 out of 6
circle_padding
hide_on_mobile
zoom_out_icon
logo.png

Your All-in-One AI-Powered Toolkit for Academic Success.

Available 24*7 on WhatsApp / Email

[object Object]