Numerical Analysis: Settlement & Bearing Capacity of Ring Footing
VerifiedAdded on 2023/04/21
|26
|6506
|214
Report
AI Summary
This report presents a numerical analysis of the ultimate bearing capacity of an isolated ring footing on geogrid-reinforced sand using FLAC3D software. The study validates the numerical model against previous laboratory results and investigates the impact of various parameters such as the number of geogrid layers, the ratio between inner and outer diameters of the ring footing, and the effective depth of reinforcement. The results confirm that utilizing geogrid reinforcement significantly improves the ultimate bearing capacity of ring footings, with optimal performance achieved with specific geometric properties. The analysis highlights the importance of numerical modeling in determining appropriate design parameters for ring footings and demonstrates the effectiveness of geogrid reinforcement in enhancing soil stability.
Numerical analysis of settlement and bearing capacity of ring footing on geogrid-
reinforced sand
Haidar Hosamo1, Iyad Sliteen2, Songxiong Ding1
∗
ABSTRACT
This paper presents an analysis of the ultimate bearing capacity of an isolated ring footing on the
geogrid-reinforced sand. A numerical investigation was first carried out then Code FLAC 3D was
used to obtain model test results, where a simple Mohr-Coulomb frictional law was implemented as a
failure criterion to represent the property of geogrid-reinforced sand. Results from the numerical
modeling were then obtained and compared with those obtained from a previous laboratory study
carried out by different researchers on a soil-reinforced sand. This was to ensure that the results from
the numerical study are correct. Moreover, some analyses were performed to determine the most
critically important parameters affecting the ring footing design. The result confirmed that utilizing
enough geogrid reinforcement layers at a proper position led to an improvement in the ultimate
bearing capacity of ring footing on the reinforced sand by 10-40%. Increasing the ratio between ring
footing’s inner and outer diameter was found to increase the bearing capacity up to an optimum
value of 0.6 beyond which bearing capacity started decreasing with increase in the ratio as it
approached 1. The bearing capacity also increased with increase in number of geogrid rinforcement
layers up to 4 layers. The effective depth was found to be 0.87D. The numerical analysis performed
in this study is very essential in determining appropriate design parameters (geometric properties) of
a ring footing and has shown that geogrid reinforcement significantly increases bearing capacity of a
ring footing.
Keywords: Ring footing, Geogrid, Bearing Capacity, Settlements, FLAC3D.
1
Paraphrase This Document
Need a fresh take? Get an instant paraphrase of this document with our AI Paraphraser
Abbreviations:
BCR: Bearing capacity ratio.
c: Soil cohesion.
d: Effective depth of reinforcement.
Di: Internal diameter of the ring footing.
Df : Depth of footing base below the ground surface.
D: External diameter of the ring footing.
u: Vertical distance between the first reinforcement layer and footing base.
h: Vertical distance between reinforcement layers.
N: Number of reinforcement layers.
qur: The ultimate bearing capacity of the reinforced soil.
qu: The ultimate bearing capacity of the unreinforced soil.
2
1. Introduction
One of the effective techniques used to prevent soil collapse under loads is strengthening the soil
with polymeric reinforcements such as geogrids, geotextiles, etc. This increases the bearing capacity
of the soil. However, bearing capacity of shallow foundations largely depends on the shape of the
foundation. Ring footings are one of the several types of shallow foundations and its use has
increased over the past years mainly because these foundations give support for symmetrical
constructions like silos, bridge piers, chimneys, transmission towers, cooling towers, and oil
storages, among others, and they are economical for these structures.
Soil reinforcement was introduced by the French engineer Vidal in 1963 [1]. Since then several
studies have been conducted focusing on investigating the behavior of reinforced soil foundations,
and the influences of the different property parameters of the reinforced soil on its bearing capacity
[2]. Reinforced soil has been widely used to strengthen installations such as retaining walls, bridge
foundations and slopes utilizing reinforced soil elements only. Results from these studies have
confirmed that the application of reinforced soil leads to a significant safety factor in such
installations [3].
Experimental investigations have revealed that reinforcing the soil with geogrid provides an apparent
clear improvement in the soil bearing capacity [4] and [5]. Javad and Nader conducted an
experimental study on the bearing capacity of a circular and ring footing above reinforced sand and
found that an increase in number of reinforcement layers of sand resulted to a corresponding increase
in bearing capacity [6]. Amin et al. (2017) carried out a study on ring footing using the stress
characteristics method and concluded that the bearing capacity becomes maximum when ri/ro is
between 0.1-0.5 [7]. Ravindra Budania et al. (2017) observed that the optimum depth of the first
layer of geogrid is 0.5 B (B is the width of the rectangular footing) [8].
Recently, some numerical studies were also carried out to investigate the behavior of ring footing
and the reinforced sand. Hataf and Razavi (2003) suggested that the maximum bearing capacity of
the ring foundation could be expected when the ratio of internal to the outer diameter (n) of ring
footing was between 0.2-0.4 [9]. In 2010, Chopbasti et al. conducted a numerical study using Plaxis
2D to investigate the bearing and displacement of the ring footing. They found that the ring footing
behavior tends towards that of strip foundation with an increase of n, especially after 0.6, where it
becomes the same as that of the strip foundation [11]. Vaibhav sharma and Arvind Kumar (2017)
performed a study and found out that the stress-strain response of fiber-reinforced and unreinforced
sand under ring footing with radius ratio n of 0.4 to be more than that of circular footing for same
3
⊘ This is a preview!⊘
Do you want full access?
Subscribe today to unlock all pages.
Trusted by 1+ million students worldwide
testing conditions [14]. PK Basudhar et al. (2008) reported that as the number of reinforcing layers
increased, the value of BCR improved [10]. John and Asha (2013) studied the behavior of ring
footing on sand soil reinforced with woven and non-woven geotextiles and their result thus obtained
confirmed that no further improvement in soil bearing capacity after using three layers [12]. Litha
and Joe (2017) conducted studies on ring footing resting on geonet reinforced sand and concluded
that the bearing capacity increased as the number of reinforcements increased but would decrease
while the depth increased [13].
The above mentioned are some of the parametric studies that have been conducted to investigate the
behaviour of ring footings on reinforced sand soil. However, it should be acknowledged that research
resources available for the behavior of ring footings are still limited in comparison with the literature
available on the strip or circular footings. In this regard, any study that is aimed at exploring the
behavior of ring footings on reinforced sand is worthwhile in the civil engineering field.
In the present study, the effort would be made to report the behavior of the ring footing (especially
its bearing capacity and settlement) on geogrid-reinforced sand) using a numerical modeling
software FLAC3D (Itasca Group). Geogrid layers were modeled with particular elements (structural
elements) and used to investigate the interaction between the building and soil.
To facilitate investigation on the influence of soil reinforcement on ultimate bearing capacity of ring
footing, a non-dimensional factor, called the bearing capacity ratio (BCR) is defined. In this context,
BCR equals the ratio of the ultimate bearing capacity of the ring footing with reinforcement (qur) to
the ultimate bearing capacity of the footing without reinforcement (qu). Thus:
BCR =
qur
qu
2. Numerical study
Figure 1 shows a ring footing that was used in the present investigation. The ring footing has an
internal diameter Diof 60 mm and an outer diameter D of 150 mm. It has been modelled as a solid,
very stiff and rough surface. The model is a quarter of the entire geometry of the ring footing, and
this was decided so as to reduce the calculation time.
The ring footing is rested on sandy soil. The soil was measured to have an internal friction angle of
38 degrees and could be classified as SW according to the Unified Soil Classification System. For
simplicity, Mohr-Coulomb failure criteria are adopted to model the stress-strain behavior of the soil.
4
Paraphrase This Document
Need a fresh take? Get an instant paraphrase of this document with our AI Paraphraser
A non-associative flow rule and the shape of the soil failure (in shear) could be thus considered.
More advanced constitutive could have been implemented (Hashmi and Desai, 1989) [15].
Erickson and Drescher (2002) [16], Frydman and Burd (1997) [17] showed that the dilation angle of
the soil had an apparent effect on the load carrying capacity of the soil and on the mechanism of
collapse for a foundation based on sandy soil. In general, if the dilation angle is low, a punching
shear occurs; and as the dilation angle increases, the collapse of sand becomes local. Based on that,
the most realistic value of the bearing capacity of the soil and the collapse mechanism of the base on
a medium to dense sand is obtained from the following relationship:
1
4 ∅ <¿ 1
3 ∅ ;=∅ −30
Table 1below shows the soil parameters adopted in the model for calibration.
Table 1 : The soil properties used in FLAC 3D
Table SOIL PARAMETERS
6.667 ×10³ KpaBulk modulus
3.076 ×10³ KpaShear modulus
0,5 KpaCohesion
38°
Friction
8°
Dilation
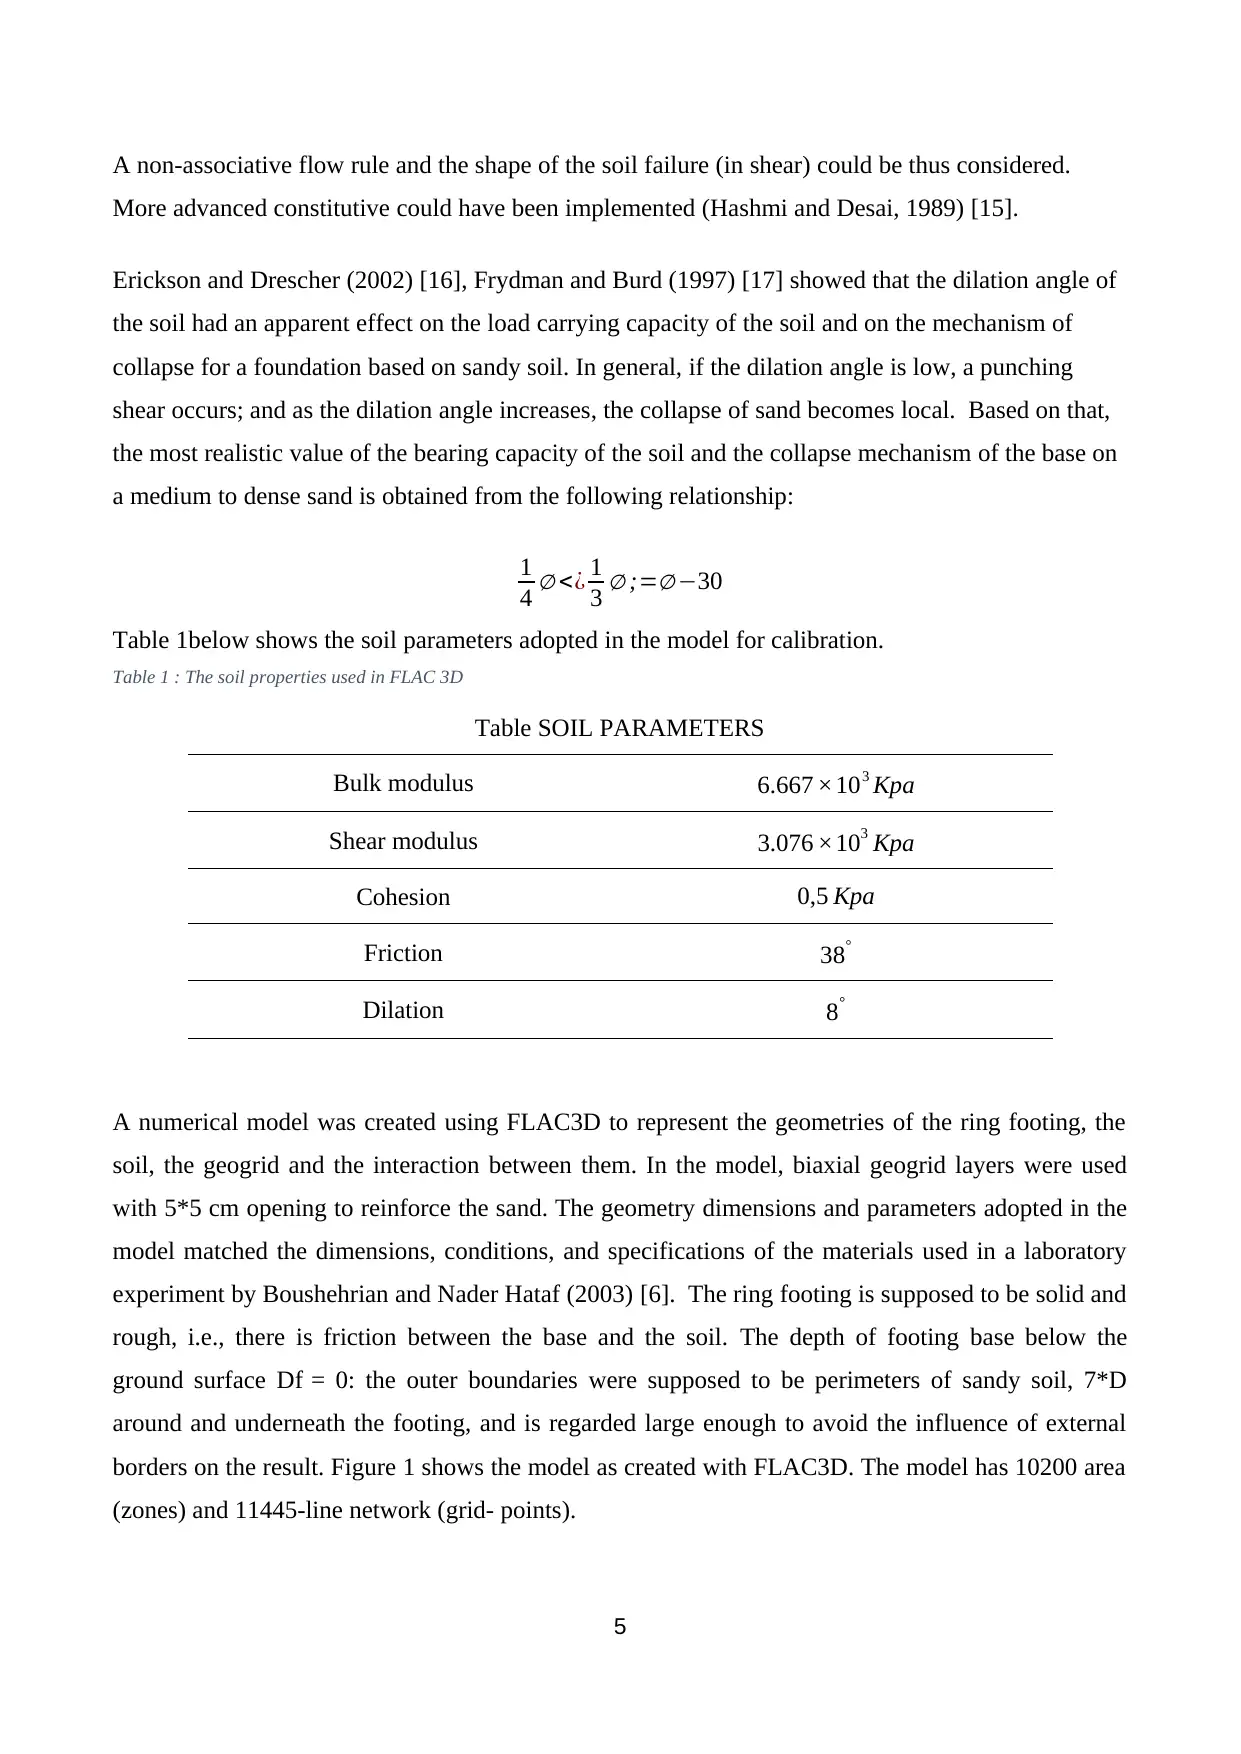
A numerical model was created using FLAC3D to represent the geometries of the ring footing, the
soil, the geogrid and the interaction between them. In the model, biaxial geogrid layers were used
with 5*5 cm opening to reinforce the sand. The geometry dimensions and parameters adopted in the
model matched the dimensions, conditions, and specifications of the materials used in a laboratory
experiment by Boushehrian and Nader Hataf (2003) [6]. The ring footing is supposed to be solid and
rough, i.e., there is friction between the base and the soil. The depth of footing base below the
ground surface Df = 0: the outer boundaries were supposed to be perimeters of sandy soil, 7*D
around and underneath the footing, and is regarded large enough to avoid the influence of external
borders on the result. Figure 1 shows the model as created with FLAC3D. The model has 10200 area
(zones) and 11445-line network (grid- points).
5
More advanced constitutive could have been implemented (Hashmi and Desai, 1989) [15].
Erickson and Drescher (2002) [16], Frydman and Burd (1997) [17] showed that the dilation angle of
the soil had an apparent effect on the load carrying capacity of the soil and on the mechanism of
collapse for a foundation based on sandy soil. In general, if the dilation angle is low, a punching
shear occurs; and as the dilation angle increases, the collapse of sand becomes local. Based on that,
the most realistic value of the bearing capacity of the soil and the collapse mechanism of the base on
a medium to dense sand is obtained from the following relationship:
1
4 ∅ <¿ 1
3 ∅ ;=∅ −30
Table 1below shows the soil parameters adopted in the model for calibration.
Table 1 : The soil properties used in FLAC 3D
Table SOIL PARAMETERS
6.667 ×10³ KpaBulk modulus
3.076 ×10³ KpaShear modulus
0,5 KpaCohesion
38°
Friction
8°
Dilation
A numerical model was created using FLAC3D to represent the geometries of the ring footing, the
soil, the geogrid and the interaction between them. In the model, biaxial geogrid layers were used
with 5*5 cm opening to reinforce the sand. The geometry dimensions and parameters adopted in the
model matched the dimensions, conditions, and specifications of the materials used in a laboratory
experiment by Boushehrian and Nader Hataf (2003) [6]. The ring footing is supposed to be solid and
rough, i.e., there is friction between the base and the soil. The depth of footing base below the
ground surface Df = 0: the outer boundaries were supposed to be perimeters of sandy soil, 7*D
around and underneath the footing, and is regarded large enough to avoid the influence of external
borders on the result. Figure 1 shows the model as created with FLAC3D. The model has 10200 area
(zones) and 11445-line network (grid- points).
5
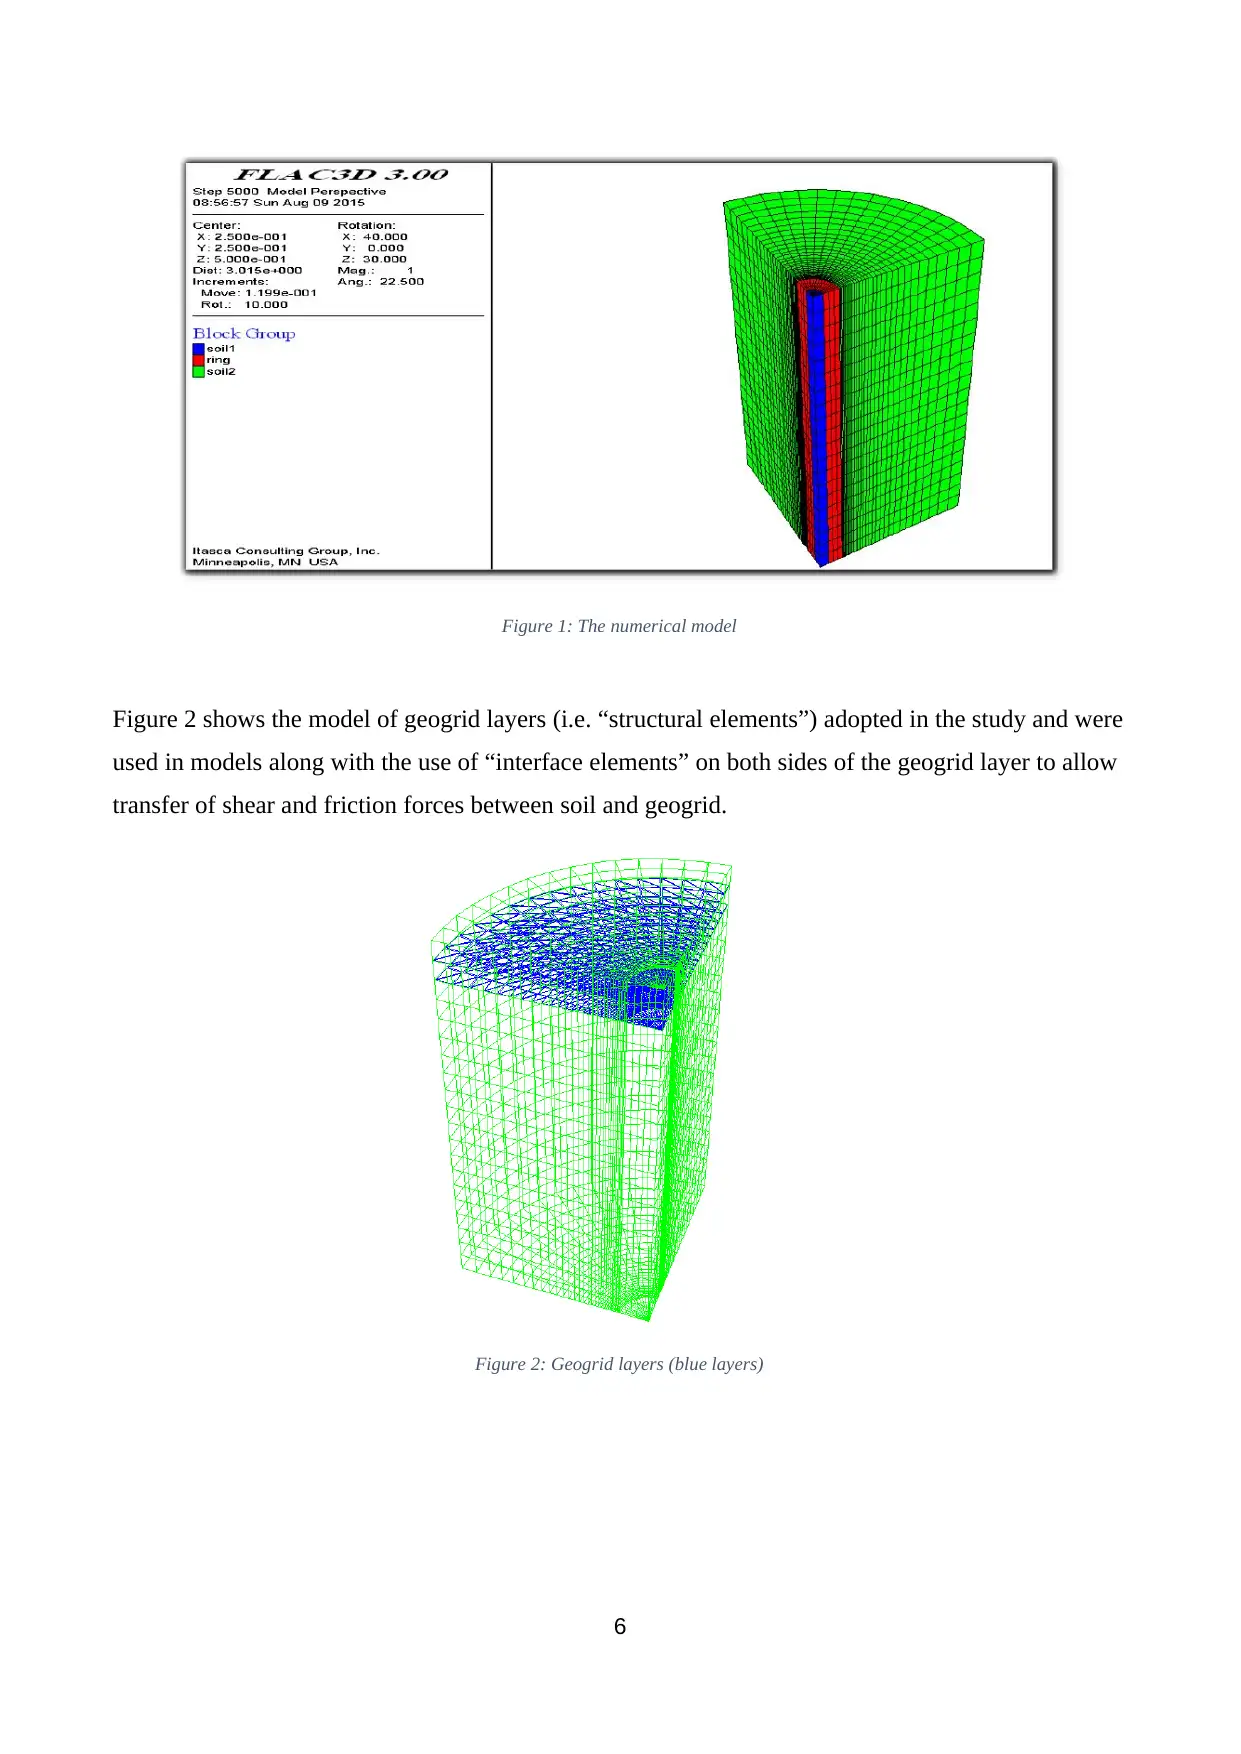
Figure 1: The numerical model
Figure 2 shows the model of geogrid layers (i.e. “structural elements”) adopted in the study and were
used in models along with the use of “interface elements” on both sides of the geogrid layer to allow
transfer of shear and friction forces between soil and geogrid.
Figure 2: Geogrid layers (blue layers)
6
⊘ This is a preview!⊘
Do you want full access?
Subscribe today to unlock all pages.
Trusted by 1+ million students worldwide
An elastic-perfect plastic model was applied to give plasticity limit of the shearing force resulting
from the soil-reinforcement friction surface. The reaction of the geogrid to the shear forces
transmitted by the contact surfaces is controlled by the properties of elements called coupling spring,
which include: stiffness per unit area, cohesive and friction angle.
Table 2 below shows the geogrid properties as used in the model
Table 2: Geogrid properties used in FLAC 3D
Table Geogrid parameters
26 ×103 KpaElasticity modulus
0.3Poisson ratio
Interface parameters
2.3 ×10³ KN /mStiffness per unit area
0 KpaCohesion
2 8°
Friction
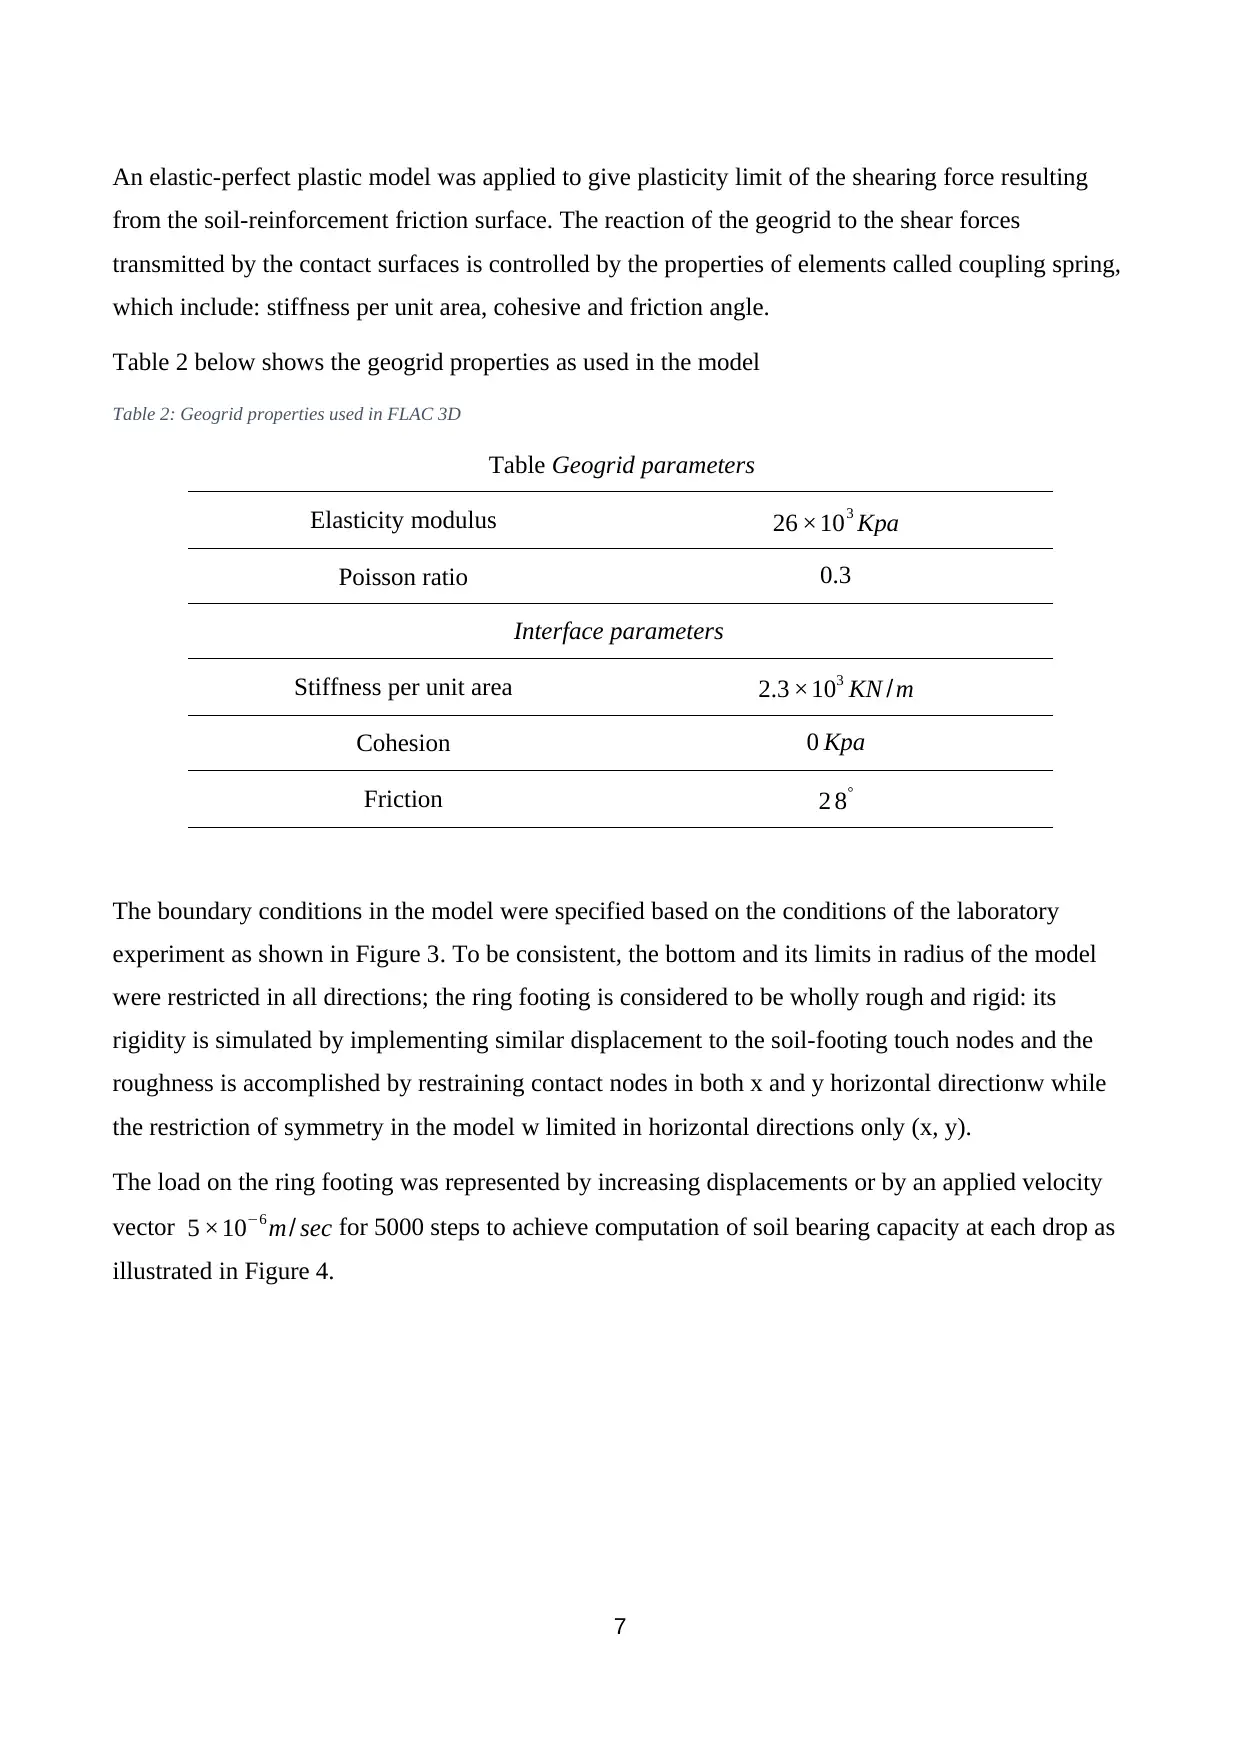
The boundary conditions in the model were specified based on the conditions of the laboratory
experiment as shown in Figure 3. To be consistent, the bottom and its limits in radius of the model
were restricted in all directions; the ring footing is considered to be wholly rough and rigid: its
rigidity is simulated by implementing similar displacement to the soil-footing touch nodes and the
roughness is accomplished by restraining contact nodes in both x and y horizontal directionw while
the restriction of symmetry in the model w limited in horizontal directions only (x, y).
The load on the ring footing was represented by increasing displacements or by an applied velocity
vector 5 ×10⁻⁶ m/ sec for 5000 steps to achieve computation of soil bearing capacity at each drop as
illustrated in Figure 4.
7
from the soil-reinforcement friction surface. The reaction of the geogrid to the shear forces
transmitted by the contact surfaces is controlled by the properties of elements called coupling spring,
which include: stiffness per unit area, cohesive and friction angle.
Table 2 below shows the geogrid properties as used in the model
Table 2: Geogrid properties used in FLAC 3D
Table Geogrid parameters
26 ×103 KpaElasticity modulus
0.3Poisson ratio
Interface parameters
2.3 ×10³ KN /mStiffness per unit area
0 KpaCohesion
2 8°
Friction
The boundary conditions in the model were specified based on the conditions of the laboratory
experiment as shown in Figure 3. To be consistent, the bottom and its limits in radius of the model
were restricted in all directions; the ring footing is considered to be wholly rough and rigid: its
rigidity is simulated by implementing similar displacement to the soil-footing touch nodes and the
roughness is accomplished by restraining contact nodes in both x and y horizontal directionw while
the restriction of symmetry in the model w limited in horizontal directions only (x, y).
The load on the ring footing was represented by increasing displacements or by an applied velocity
vector 5 ×10⁻⁶ m/ sec for 5000 steps to achieve computation of soil bearing capacity at each drop as
illustrated in Figure 4.
7
Paraphrase This Document
Need a fresh take? Get an instant paraphrase of this document with our AI Paraphraser
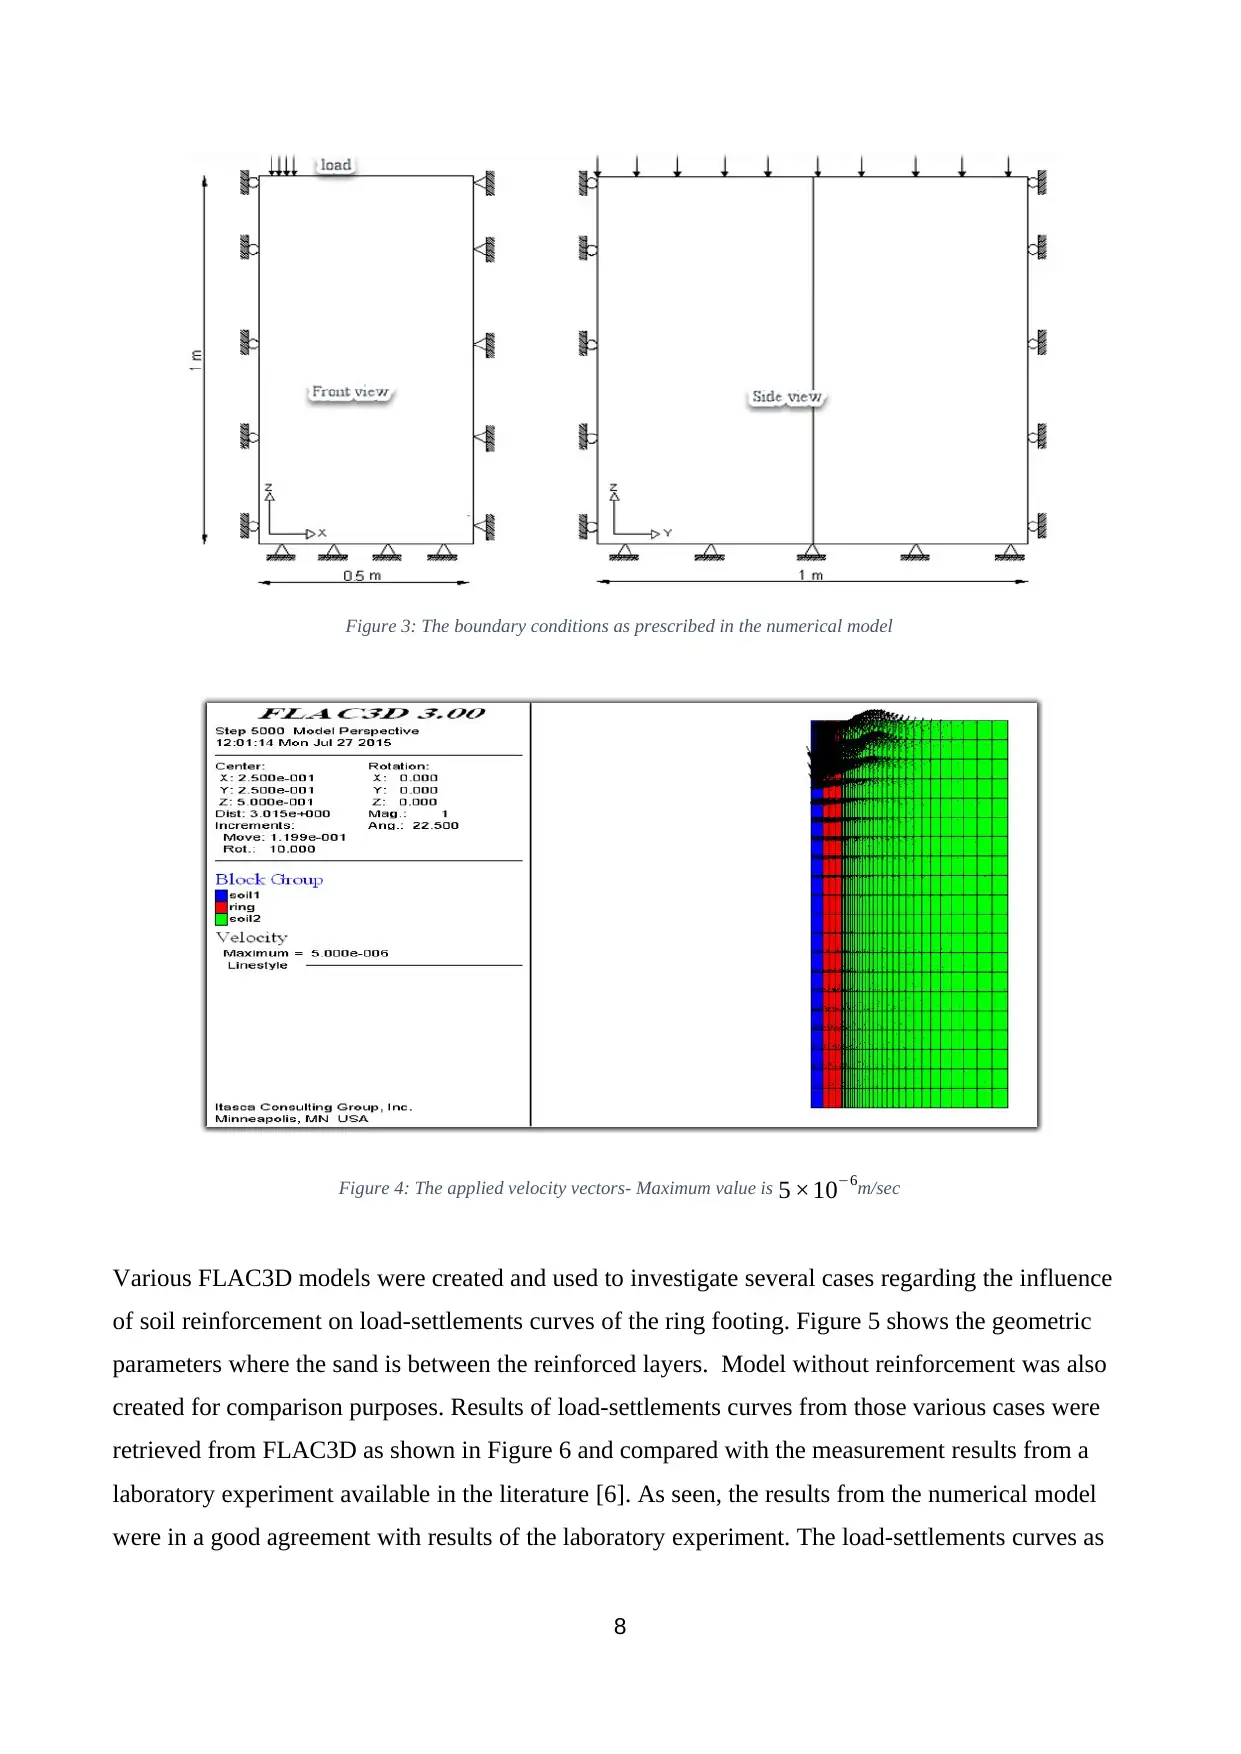
Figure 3: The boundary conditions as prescribed in the numerical model
Figure 4: The applied velocity vectors- Maximum value is 5 ×10⁻⁶m/sec
Various FLAC3D models were created and used to investigate several cases regarding the influence
of soil reinforcement on load-settlements curves of the ring footing. Figure 5 shows the geometric
parameters where the sand is between the reinforced layers. Model without reinforcement was also
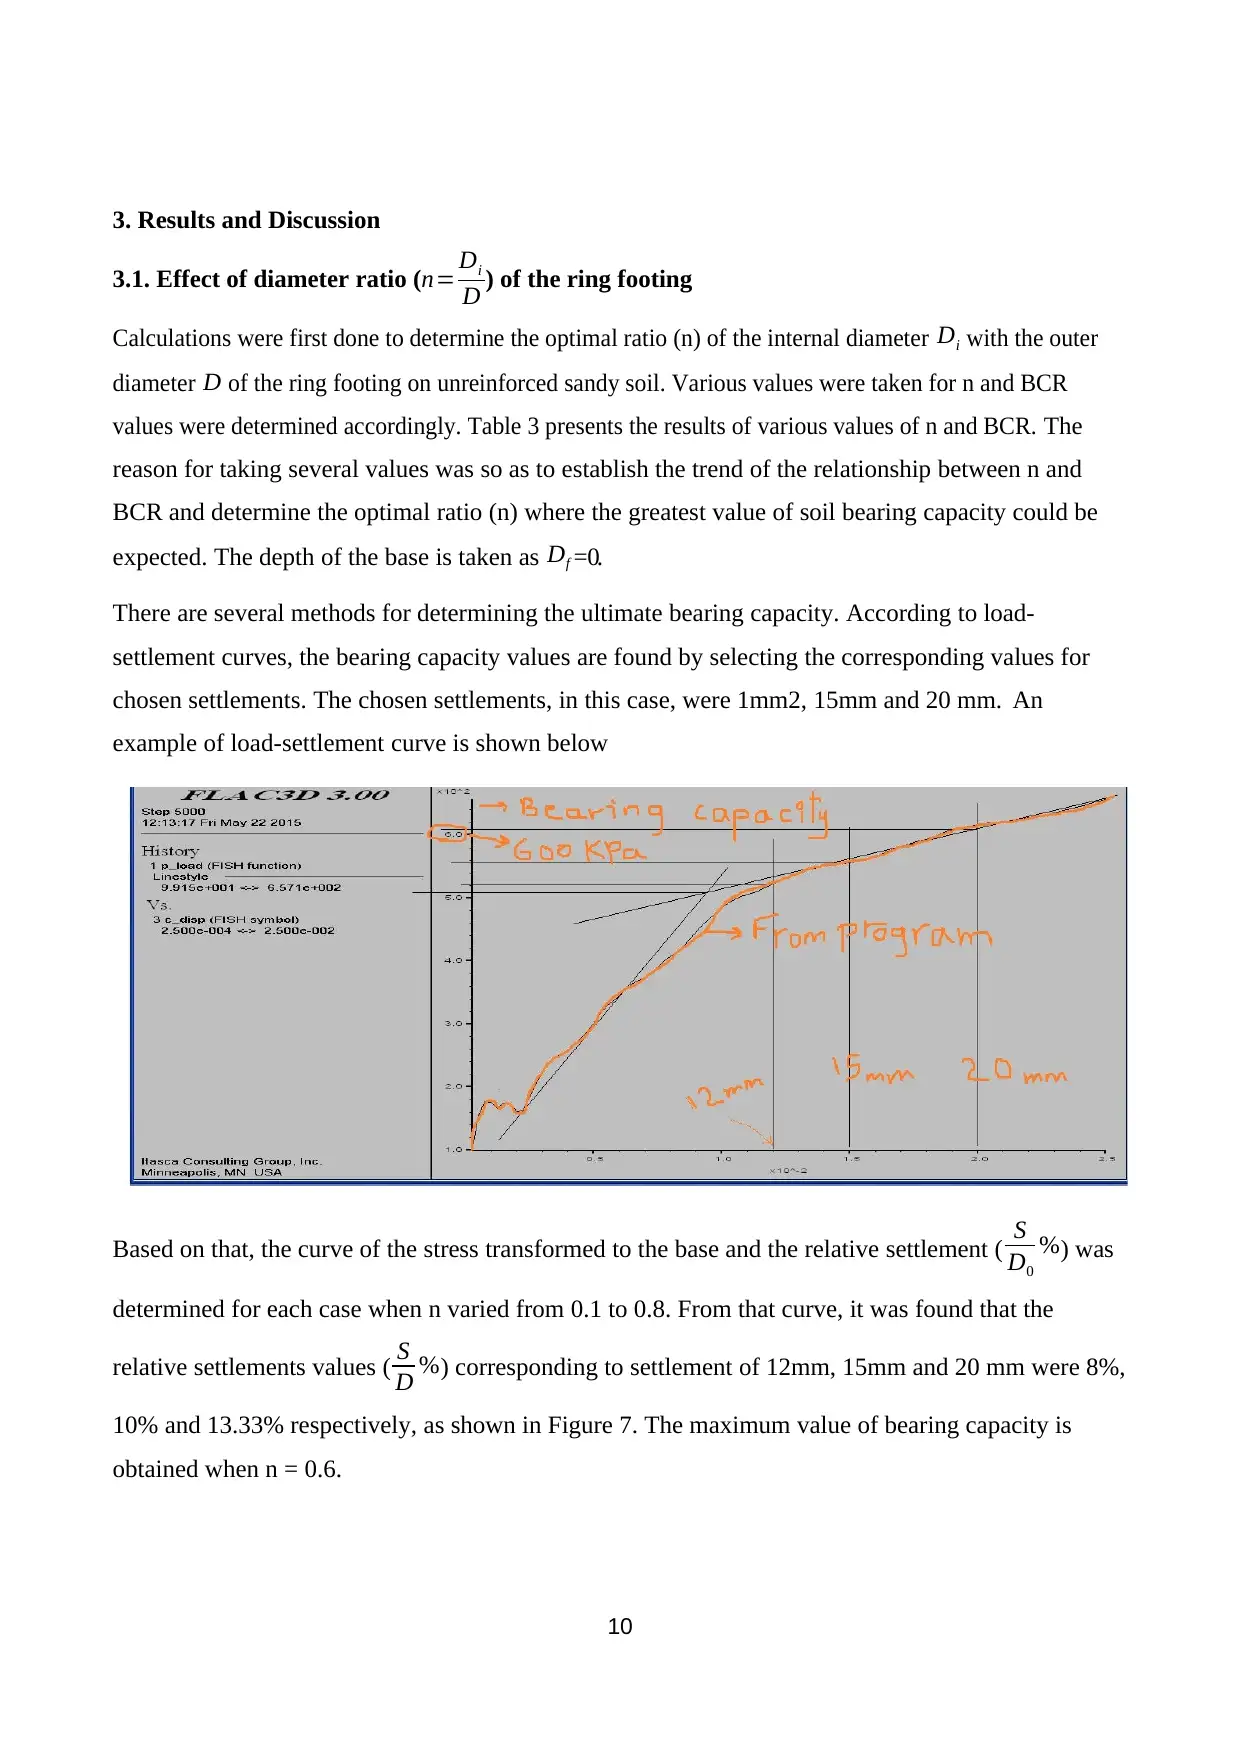
created for comparison purposes. Results of load-settlements curves from those various cases were
retrieved from FLAC3D as shown in Figure 6 and compared with the measurement results from a
laboratory experiment available in the literature [6]. As seen, the results from the numerical model
were in a good agreement with results of the laboratory experiment. The load-settlements curves as
8
Figure 4: The applied velocity vectors- Maximum value is 5 ×10⁻⁶m/sec
Various FLAC3D models were created and used to investigate several cases regarding the influence
of soil reinforcement on load-settlements curves of the ring footing. Figure 5 shows the geometric
parameters where the sand is between the reinforced layers. Model without reinforcement was also
created for comparison purposes. Results of load-settlements curves from those various cases were
retrieved from FLAC3D as shown in Figure 6 and compared with the measurement results from a
laboratory experiment available in the literature [6]. As seen, the results from the numerical model
were in a good agreement with results of the laboratory experiment. The load-settlements curves as
8
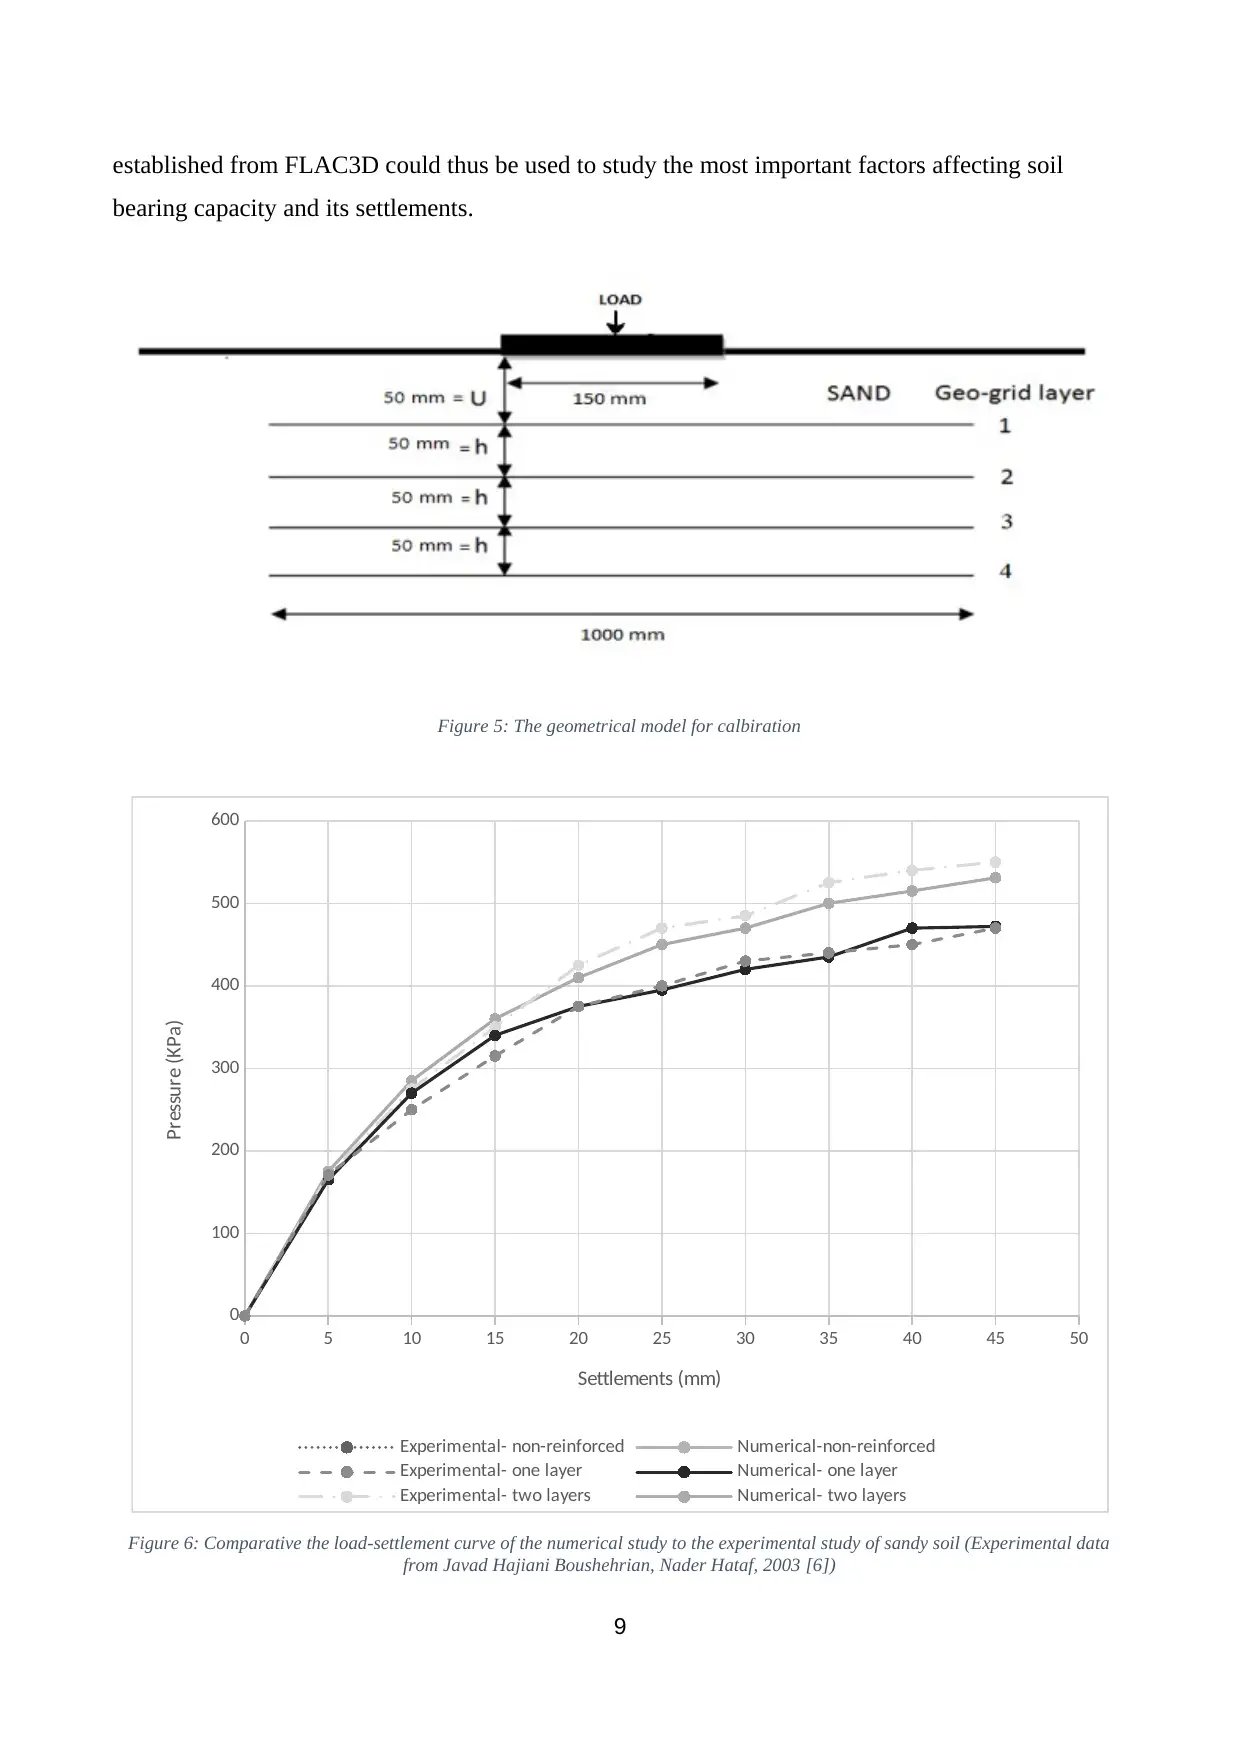
established from FLAC3D could thus be used to study the most important factors affecting soil
bearing capacity and its settlements.
Figure 5: The geometrical model for calbiration
0 5 10 15 20 25 30 35 40 45 50
0
100
200
300
400
500
600
Experimental- non-reinforced Numerical-non-reinforced
Experimental- one layer Numerical- one layer
Experimental- two layers Numerical- two layers
Settlements (mm)
Pressure (KPa)
Figure 6: Comparative the load-settlement curve of the numerical study to the experimental study of sandy soil (Experimental data
from Javad Hajiani Boushehrian, Nader Hataf, 2003 [6])
9
⊘ This is a preview!⊘
Do you want full access?
Subscribe today to unlock all pages.
Trusted by 1+ million students worldwide
3. Results and Discussion
3.1. Effect of diameter ratio (n= Di
D ) of the ring footing
Calculations were first done to determine the optimal ratio (n) of the internal diameter Di with the outer
diameter D of the ring footing on unreinforced sandy soil. Various values were taken for n and BCR
values were determined accordingly. Table 3 presents the results of various values of n and BCR. The
reason for taking several values was so as to establish the trend of the relationship between n and
BCR and determine the optimal ratio (n) where the greatest value of soil bearing capacity could be
expected. The depth of the base is taken as Df =0.
There are several methods for determining the ultimate bearing capacity. According to load-
settlement curves, the bearing capacity values are found by selecting the corresponding values for
chosen settlements. The chosen settlements, in this case, were 1mm2, 15mm and 20 mm. An
example of load-settlement curve is shown below
Based on that, the curve of the stress transformed to the base and the relative settlement ( S
D0
%) was
determined for each case when n varied from 0.1 to 0.8. From that curve, it was found that the
relative settlements values ( S
D %) corresponding to settlement of 12mm, 15mm and 20 mm were 8%,
10% and 13.33% respectively, as shown in Figure 7. The maximum value of bearing capacity is
obtained when n = 0.6.
10
Paraphrase This Document
Need a fresh take? Get an instant paraphrase of this document with our AI Paraphraser
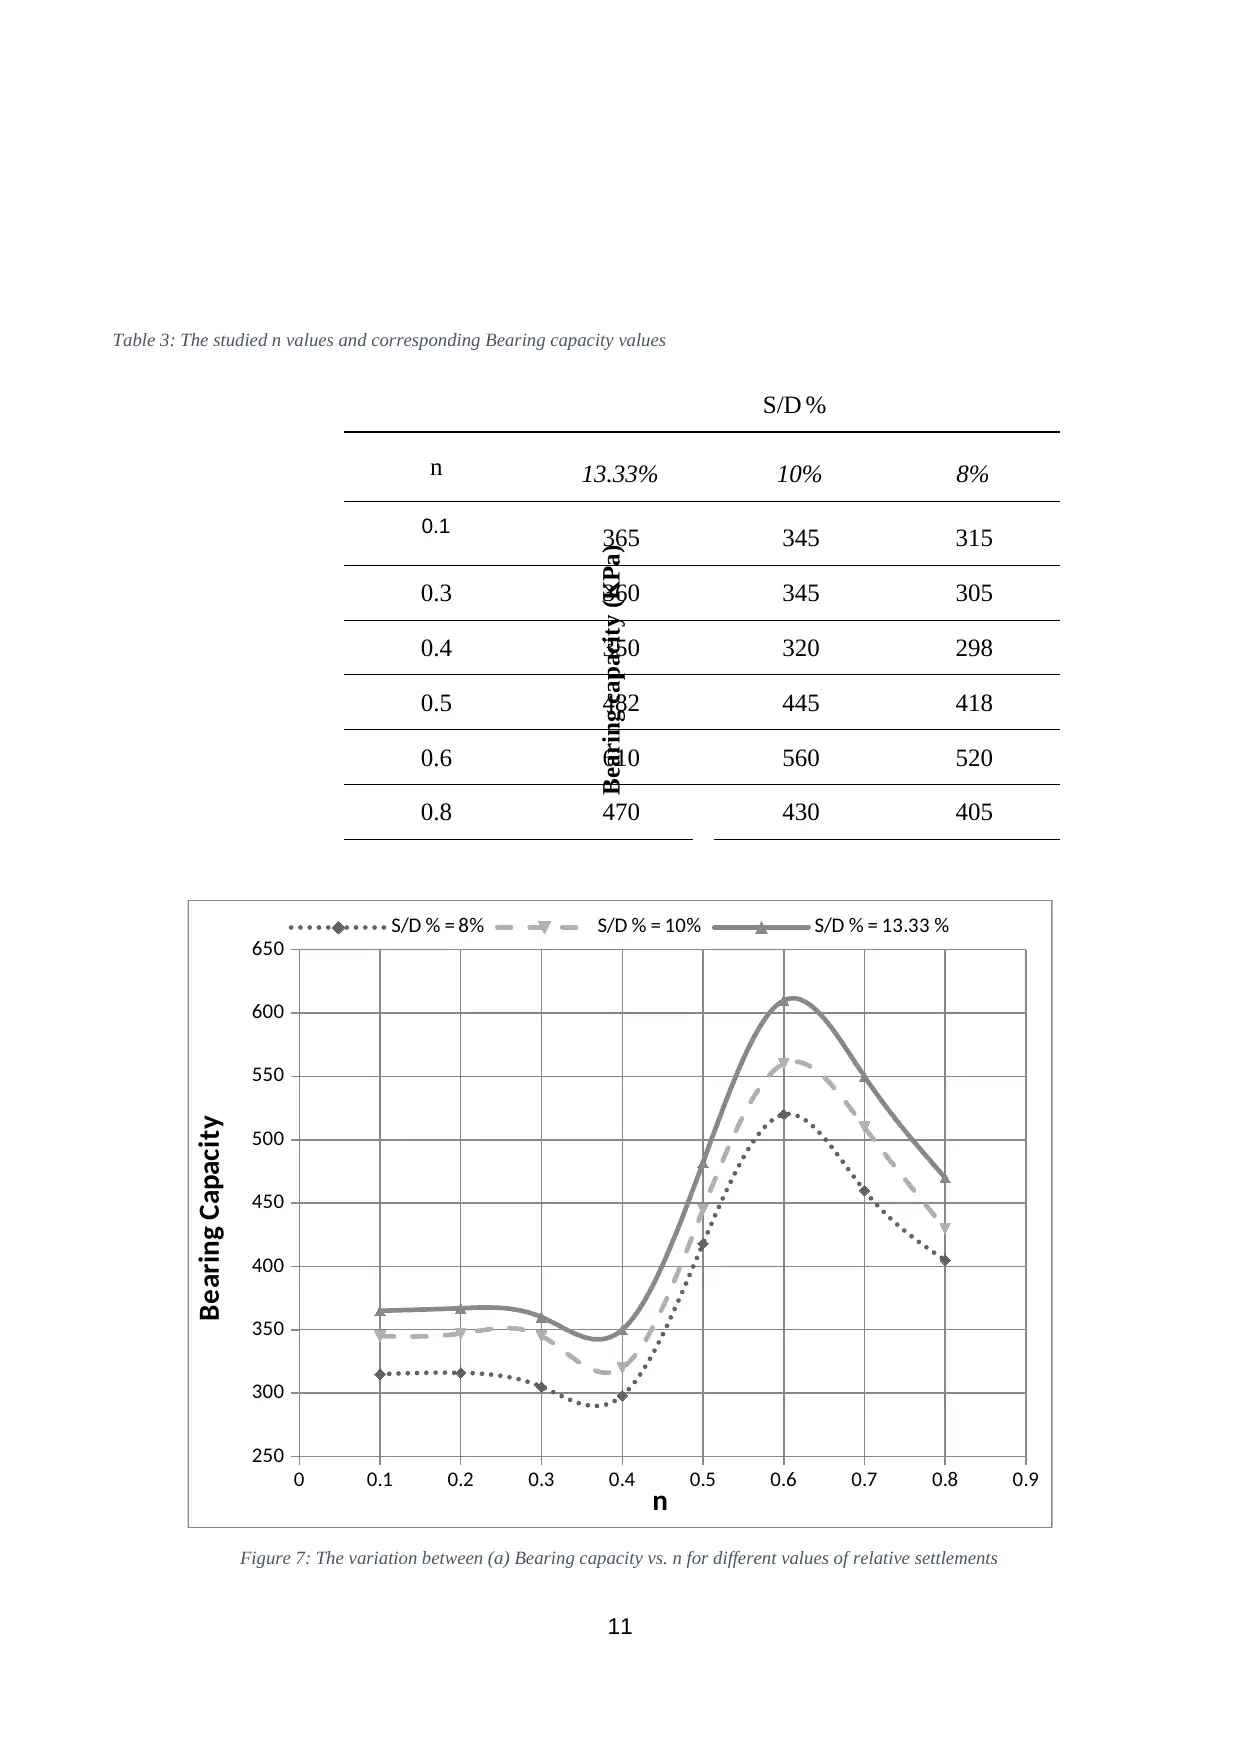
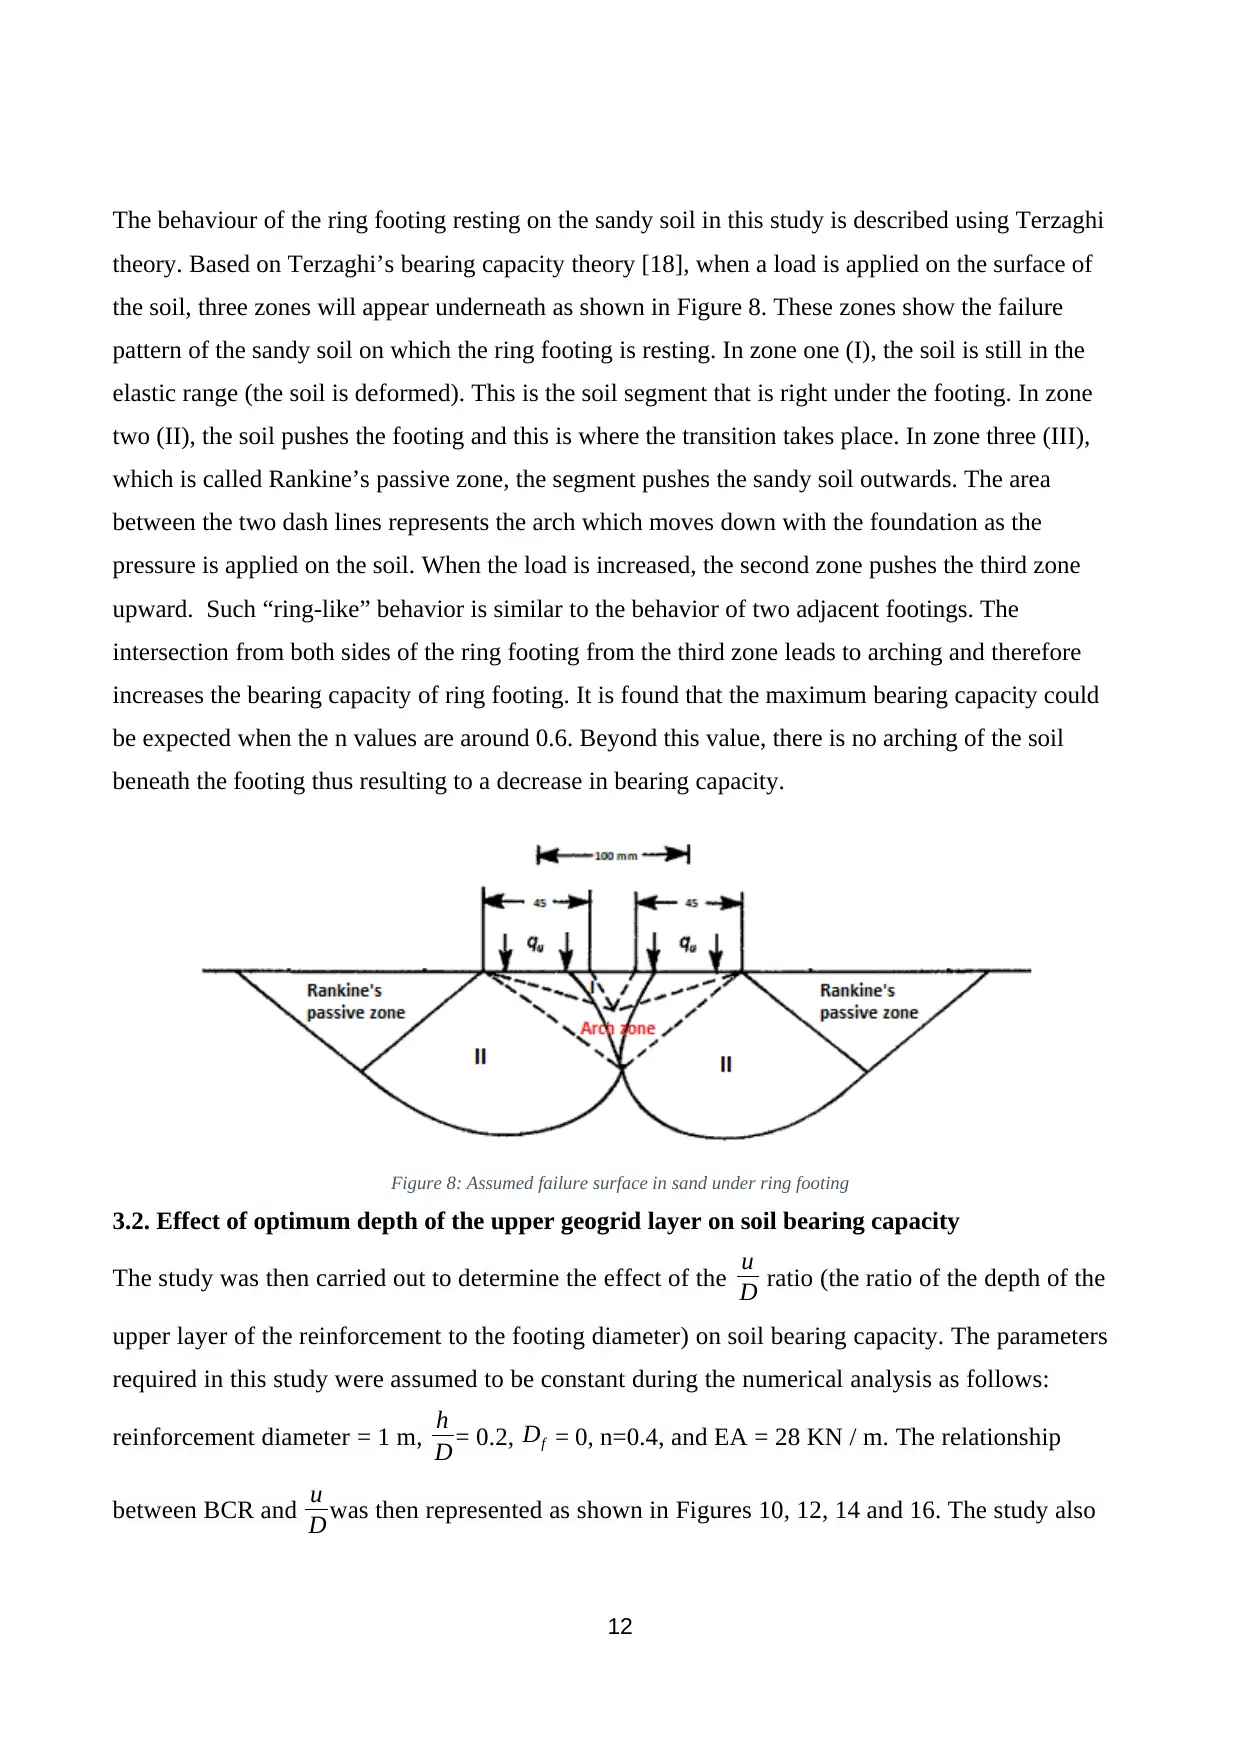
Table 3: The studied n values and corresponding Bearing capacity values
S/D %
8%10%13.33%n
315345365
0.1
Bearing capacity (KPa)
3053453600.3
2983203500.4
4184454820.5
5205606100.6
4054304700.8
0 0.1 0.2 0.3 0.4 0.5 0.6 0.7 0.8 0.9
250
300
350
400
450
500
550
600
650
S/D % = 8% S/D % = 10% S/D % = 13.33 %
n
Bearing Capacity
Figure 7: The variation between (a) Bearing capacity vs. n for different values of relative settlements
11
The behaviour of the ring footing resting on the sandy soil in this study is described using Terzaghi
theory. Based on Terzaghi’s bearing capacity theory [18], when a load is applied on the surface of
the soil, three zones will appear underneath as shown in Figure 8. These zones show the failure
pattern of the sandy soil on which the ring footing is resting. In zone one (I), the soil is still in the
elastic range (the soil is deformed). This is the soil segment that is right under the footing. In zone
two (II), the soil pushes the footing and this is where the transition takes place. In zone three (III),
which is called Rankine’s passive zone, the segment pushes the sandy soil outwards. The area
between the two dash lines represents the arch which moves down with the foundation as the
pressure is applied on the soil. When the load is increased, the second zone pushes the third zone
upward. Such “ring-like” behavior is similar to the behavior of two adjacent footings. The
intersection from both sides of the ring footing from the third zone leads to arching and therefore
increases the bearing capacity of ring footing. It is found that the maximum bearing capacity could
be expected when the n values are around 0.6. Beyond this value, there is no arching of the soil
beneath the footing thus resulting to a decrease in bearing capacity.
Figure 8: Assumed failure surface in sand under ring footing
3.2. Effect of optimum depth of the upper geogrid layer on soil bearing capacity
The study was then carried out to determine the effect of the u
D ratio (the ratio of the depth of the
upper layer of the reinforcement to the footing diameter) on soil bearing capacity. The parameters
required in this study were assumed to be constant during the numerical analysis as follows:
reinforcement diameter = 1 m, h
D = 0.2, Df = 0, n=0.4, and EA = 28 KN / m. The relationship
between BCR and u
D was then represented as shown in Figures 10, 12, 14 and 16. The study also
12
⊘ This is a preview!⊘
Do you want full access?
Subscribe today to unlock all pages.
Trusted by 1+ million students worldwide
1 out of 26
Related Documents


Your All-in-One AI-Powered Toolkit for Academic Success.
+13062052269
info@desklib.com
Available 24*7 on WhatsApp / Email
![[object Object]](/_next/static/media/star-bottom.7253800d.svg)
Unlock your academic potential
Copyright © 2020–2026 A2Z Services. All Rights Reserved. Developed and managed by ZUCOL.