Flair's Case Study: Expenses, Loan Request, and Data Interpretation

Verified

Added on  2020/10/22

|4
|345
|451
Case Study
AI Summary
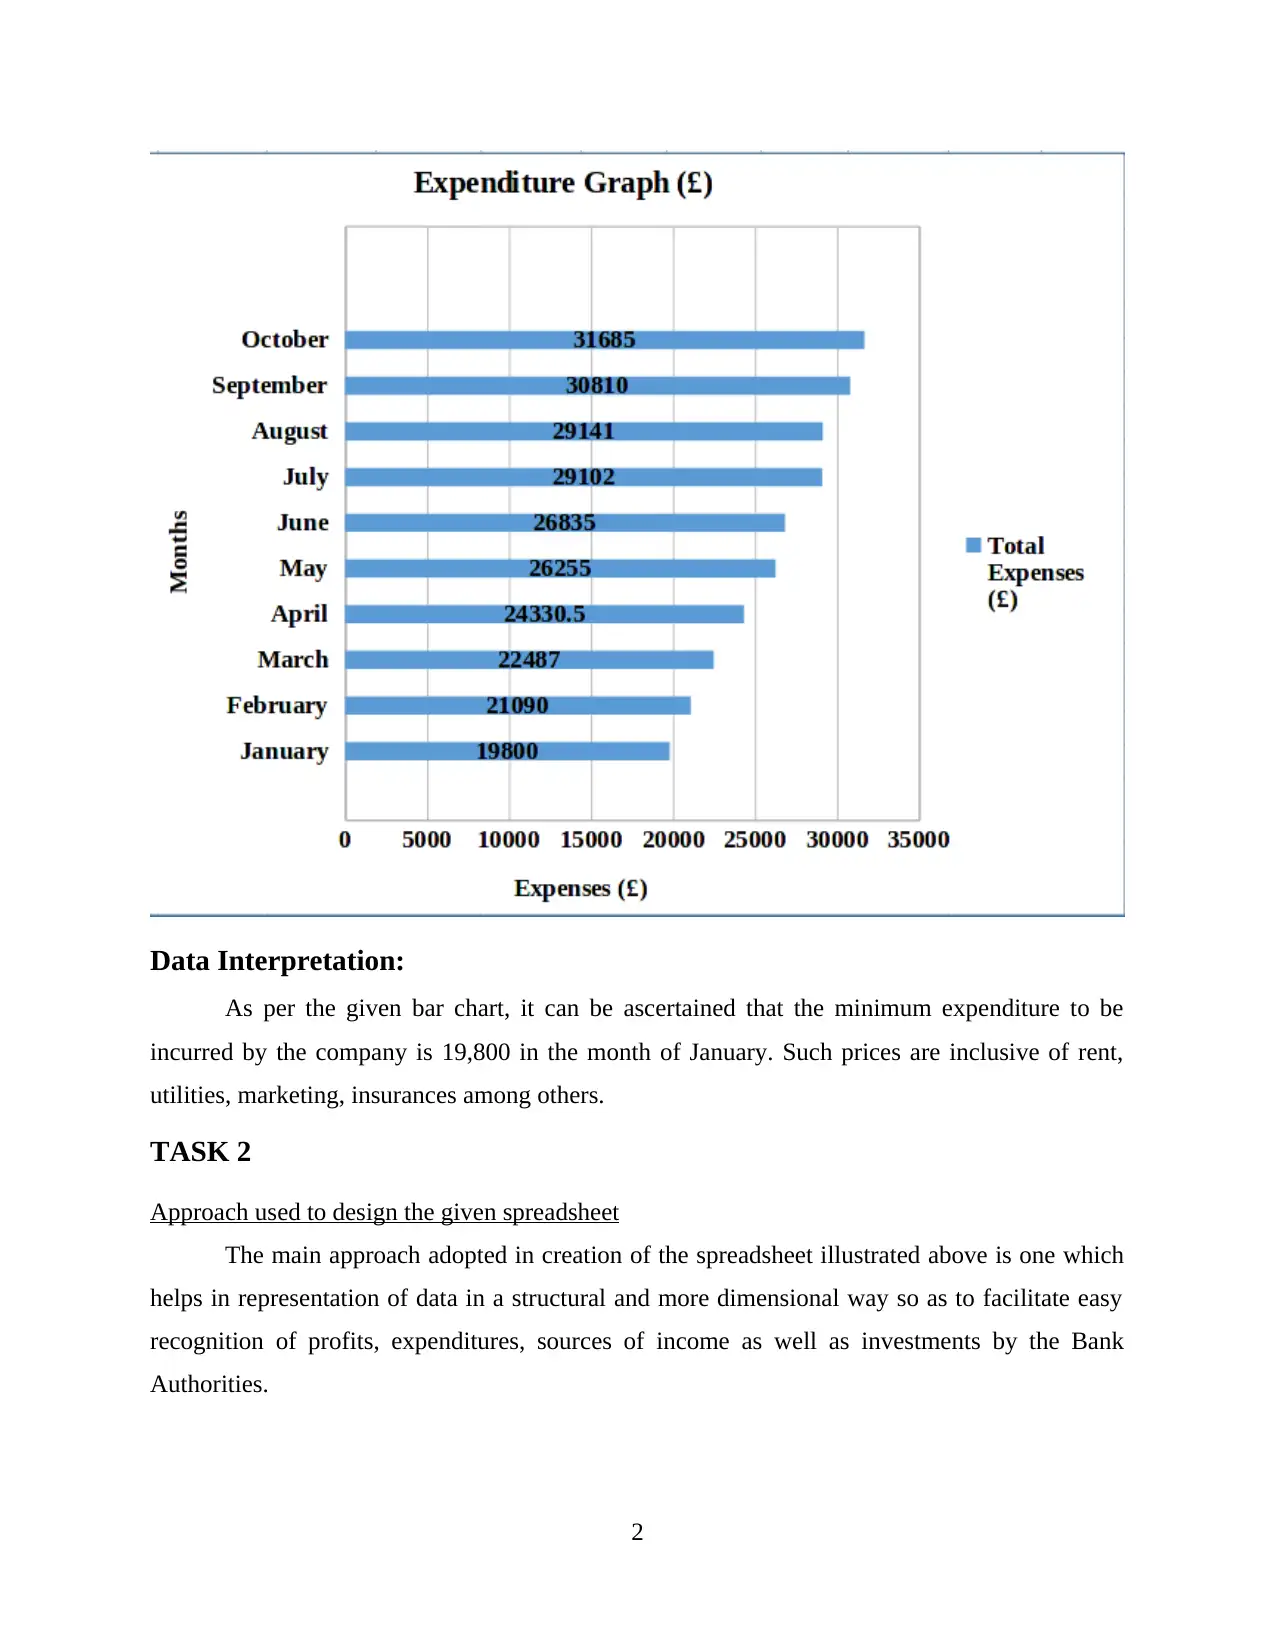
This case study examines Flair, a market leader, and its expansion plans. The assignment analyzes Flair's expenses over ten months, presented in a spreadsheet format, and includes data interpretation of a bar chart representing expenditures like rent, utilities, and marketing costs. The study also details the loan request for business expansion, including the need for additional capital and inventory. The spreadsheet illustrates the use of Auto-sum, Auto-Format, and Average Formula. The assignment aims to provide insights into Flair's financial situation, supporting the loan request and highlighting the business's financial performance and investment sources. The analysis also touches upon the spreadsheet design and its contribution to the presentation of financial data.
tabler-icon-diamond-filled.svg

Contribute Materials

Your contribution can guide someone’s learning journey. Share your documents today.
Document Page
CASE STUDY
tabler-icon-diamond-filled.svg

Secure Best Marks with AI Grader

Need help grading? Try our AI Grader for instant feedback on your assignments.
Document Page
Table of Contents
TASK 1............................................................................................................................................1
a. Discuss about the brief description to the business..................................................................1
b. Spreadsheet stating Flair's Expenses over the last 10 months in support of loan request.......1
Data Interpretation:..........................................................................................................................2
TASK 2............................................................................................................................................2
Approach used to design the given spreadsheet..........................................................................2
Document Page
TASK 1
a. Discuss about the brief description to the business
Flair has been chosen which is currently the market leader of its area of operation. The
business is based in West London is contemplating an expansion of its business even further
across the world. For this purpose, it needs to analyze the overall situation of the international
market. Using statistical method, specifically, a survey alternative it would gain valuable insights
in regards to what customer needs and preferences are in the potential or target markets. As per
the survey, it is concluded that the business would require and additional funding of 2000 for
meeting capital requirements and 50,000 worth inventory. Apart from this, the business
possesses an accumulated amount of 10,000 obtained from family and friends.
b. Spreadsheet stating Flair's Expenses over the last 10 months in support of loan request
The given image illustrates Auto-sum, Auto-Format, Average Formula, Percentage and
graphical representation of various capital and investment sources as well as expenditures:
1
Document Page
Data Interpretation:
As per the given bar chart, it can be ascertained that the minimum expenditure to be
incurred by the company is 19,800 in the month of January. Such prices are inclusive of rent,
utilities, marketing, insurances among others.
TASK 2
Approach used to design the given spreadsheet
The main approach adopted in creation of the spreadsheet illustrated above is one which
helps in representation of data in a structural and more dimensional way so as to facilitate easy
recognition of profits, expenditures, sources of income as well as investments by the Bank
Authorities.
2
chevron_up_icon
1 out of 4
circle_padding
hide_on_mobile
zoom_out_icon
logo.png

Your All-in-One AI-Powered Toolkit for Academic Success.

Available 24*7 on WhatsApp / Email

[object Object]