Report on Fleet Selection and Planning for a Startup Airline
VerifiedAdded on 2021/04/24
|12
|2619
|100
Report
AI Summary
This report delves into fleet selection and planning within the aviation industry, specifically addressing the challenges and opportunities faced by a startup airline. It begins with an introduction to the turbulent aviation market and highlights the need for efficient fleet management. The report then analyzes the selection of suitable aircraft, comparing the Airbus 320 and CRJ 1000 based on running costs, efficiency, and revenue potential. The analysis includes detailed cost breakdowns, revenue projections, and a discussion of the point-to-point network model. Furthermore, the report explores fleet planning over the next decade, considering factors like market traffic, forecasted growth, competition, and cargo traffic. It also presents a master fleet plan, detailing fleet size, network expansion, and revenue projections over a 10-year period. The report emphasizes the importance of strategic alliances and annual plan revisions to adapt to the dynamic global aviation environment. Finally, it concludes by highlighting the potential for the airline to deliver first-class services and achieve profitability within the first half of its 10-year plan.
REPORT ON FLEET SELECTION AND PLANNING
PREPARED BY:
Date: 28th March 2018
PREPARED BY:
Date: 28th March 2018
Paraphrase This Document
Need a fresh take? Get an instant paraphrase of this document with our AI Paraphraser
1. INTRODUCTION
The aviation Industry has sustained turbulence in the last decade. From escalating jet fuel to global insecurity due to terrorism, airline
companies have been forced to tighten their belts as they cruise through the unpredictable global airline market. Nevertheless, new
entrants into the market continue to flock. In this report, a general guideline on practical fleet planning is provided. A case for a startup
company is considered where various planning factors are discussed. This is preceded by a selection of suitable airline based on
efficiency and cost. Notably, there are two airlines up for selection as the company aims to grow and expand her networks
internationally. The two airlines under consideration include: Airbus 320 and CRJ 1000.
2. AIRLINE SELECTION
2.1 Running Cost
Notably, high density airlines would be the best choice given the higher number of passenger servicing per flight hence lower unit
operating costs. However, small aircrafts are best for average traffic airports hence reduced delays. The point-to-point network model
would then come in handy as domestic travels prefer the point to point flight without unnecessary connections. As a result of this,
there is a possibility of the daily block hours being maximized. As a startup company, this would then be the best network model to
adopt. By simplifying the operations, the ATCs operations are also streamlined and a lean team is established to grow with the
company. Normally, unless effective operations management is implemented, large airline companies often experience inefficiencies
due to a mismatched ground and airborne operations. This is often complicated by the complex operations model they adopt
(AERO.com, 2018).
Additionally, the performance of world economy over the last decade has shaped the airline industry in a tremendous way. After the
2008 Global economic crisis, companies struggled realigning their businesses with the new reality. Faced with the dwindling market
share due to stiff competition from start ups and the escalating fuel price, a number of companies undertook stringent measures such
as downsizing so as to maintain sustainability in performance. According to Stalnaker, Uzman and Taylor (2016) the airline industry
in US collectively made a 1.3% operating loss in the year 2000. However, due to structural and business reforms, the industry made a
comeback of 15.2% in 2013 and has since continued to grow. Similarly, in the Middle East region, airline companies such as Qatar
Airlines have surprisingly performed amid the global airline challenges to
2.2 Airline Efficiency
Airline efficiency mostly comprises the flight efficiency and on-ground service efficiency. These two are interdependent and
collectively they contribute to either worst or best performance in terms of quality of service or consequently the business
performance. For example, delays arise as a result of inefficient booking and flight management system. The company will have to
implement the most effective online booking system that matches with the flight management system. Since this is a startup company,
it is expected that the passenger processing volume will modest but certainly it will increase over the given period hence the
operations and the systems will have to be improved in a continuous fashion to meet the growing expectation and needs from
passengers.
2.2.1 Selection Criteria: Cost and Jet Performance
Based on the two factors discussed above, the airline selection is undertaken and the following is the criterion applied to arrive at the
choice:
⊘ This is a preview!⊘
Do you want full access?
Subscribe today to unlock all pages.
Trusted by 1+ million students worldwide
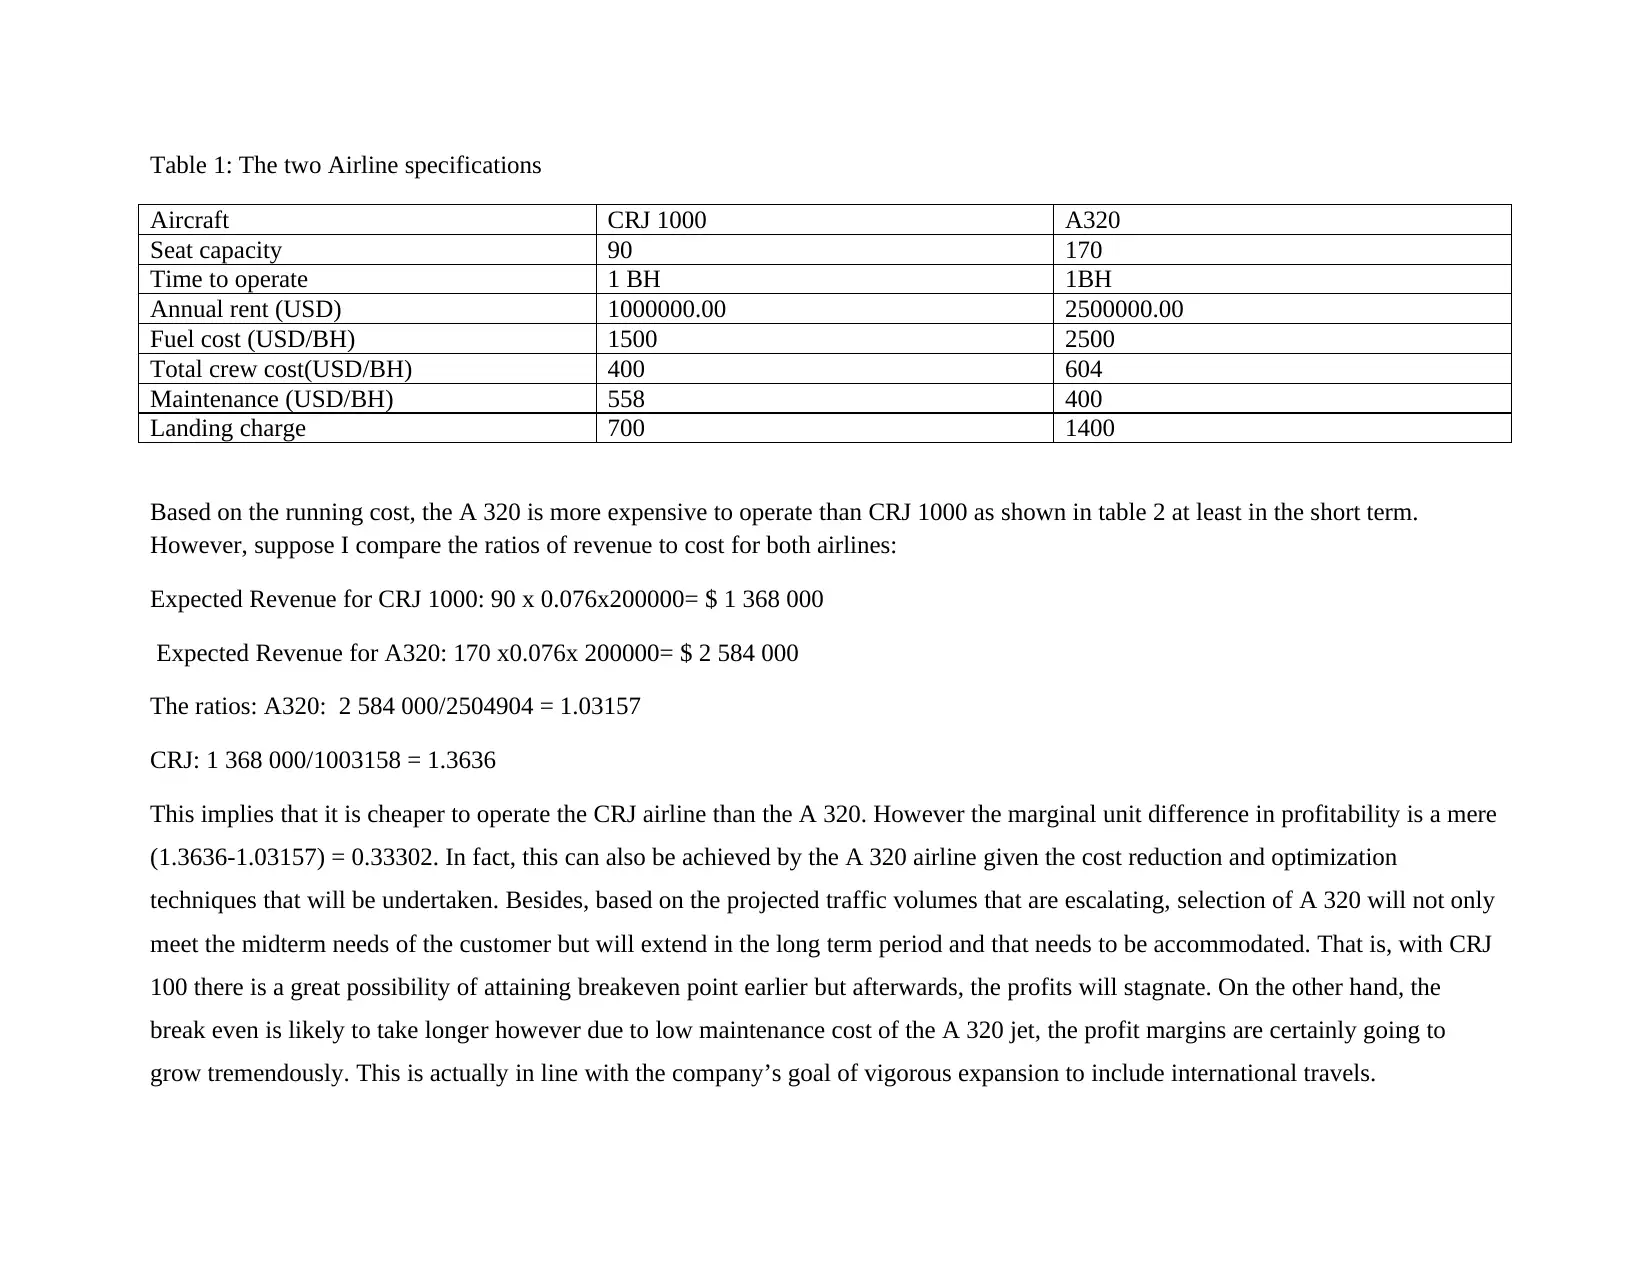
Table 1: The two Airline specifications
Aircraft CRJ 1000 A320
Seat capacity 90 170
Time to operate 1 BH 1BH
Annual rent (USD) 1000000.00 2500000.00
Fuel cost (USD/BH) 1500 2500
Total crew cost(USD/BH) 400 604
Maintenance (USD/BH) 558 400
Landing charge 700 1400
Based on the running cost, the A 320 is more expensive to operate than CRJ 1000 as shown in table 2 at least in the short term.
However, suppose I compare the ratios of revenue to cost for both airlines:
Expected Revenue for CRJ 1000: 90 x 0.076x200000= $ 1 368 000
Expected Revenue for A320: 170 x0.076x 200000= $ 2 584 000
The ratios: A320: 2 584 000/2504904 = 1.03157
CRJ: 1 368 000/1003158 = 1.3636
This implies that it is cheaper to operate the CRJ airline than the A 320. However the marginal unit difference in profitability is a mere
(1.3636-1.03157) = 0.33302. In fact, this can also be achieved by the A 320 airline given the cost reduction and optimization
techniques that will be undertaken. Besides, based on the projected traffic volumes that are escalating, selection of A 320 will not only
meet the midterm needs of the customer but will extend in the long term period and that needs to be accommodated. That is, with CRJ
100 there is a great possibility of attaining breakeven point earlier but afterwards, the profits will stagnate. On the other hand, the
break even is likely to take longer however due to low maintenance cost of the A 320 jet, the profit margins are certainly going to
grow tremendously. This is actually in line with the company’s goal of vigorous expansion to include international travels.
Paraphrase This Document
Need a fresh take? Get an instant paraphrase of this document with our AI Paraphraser
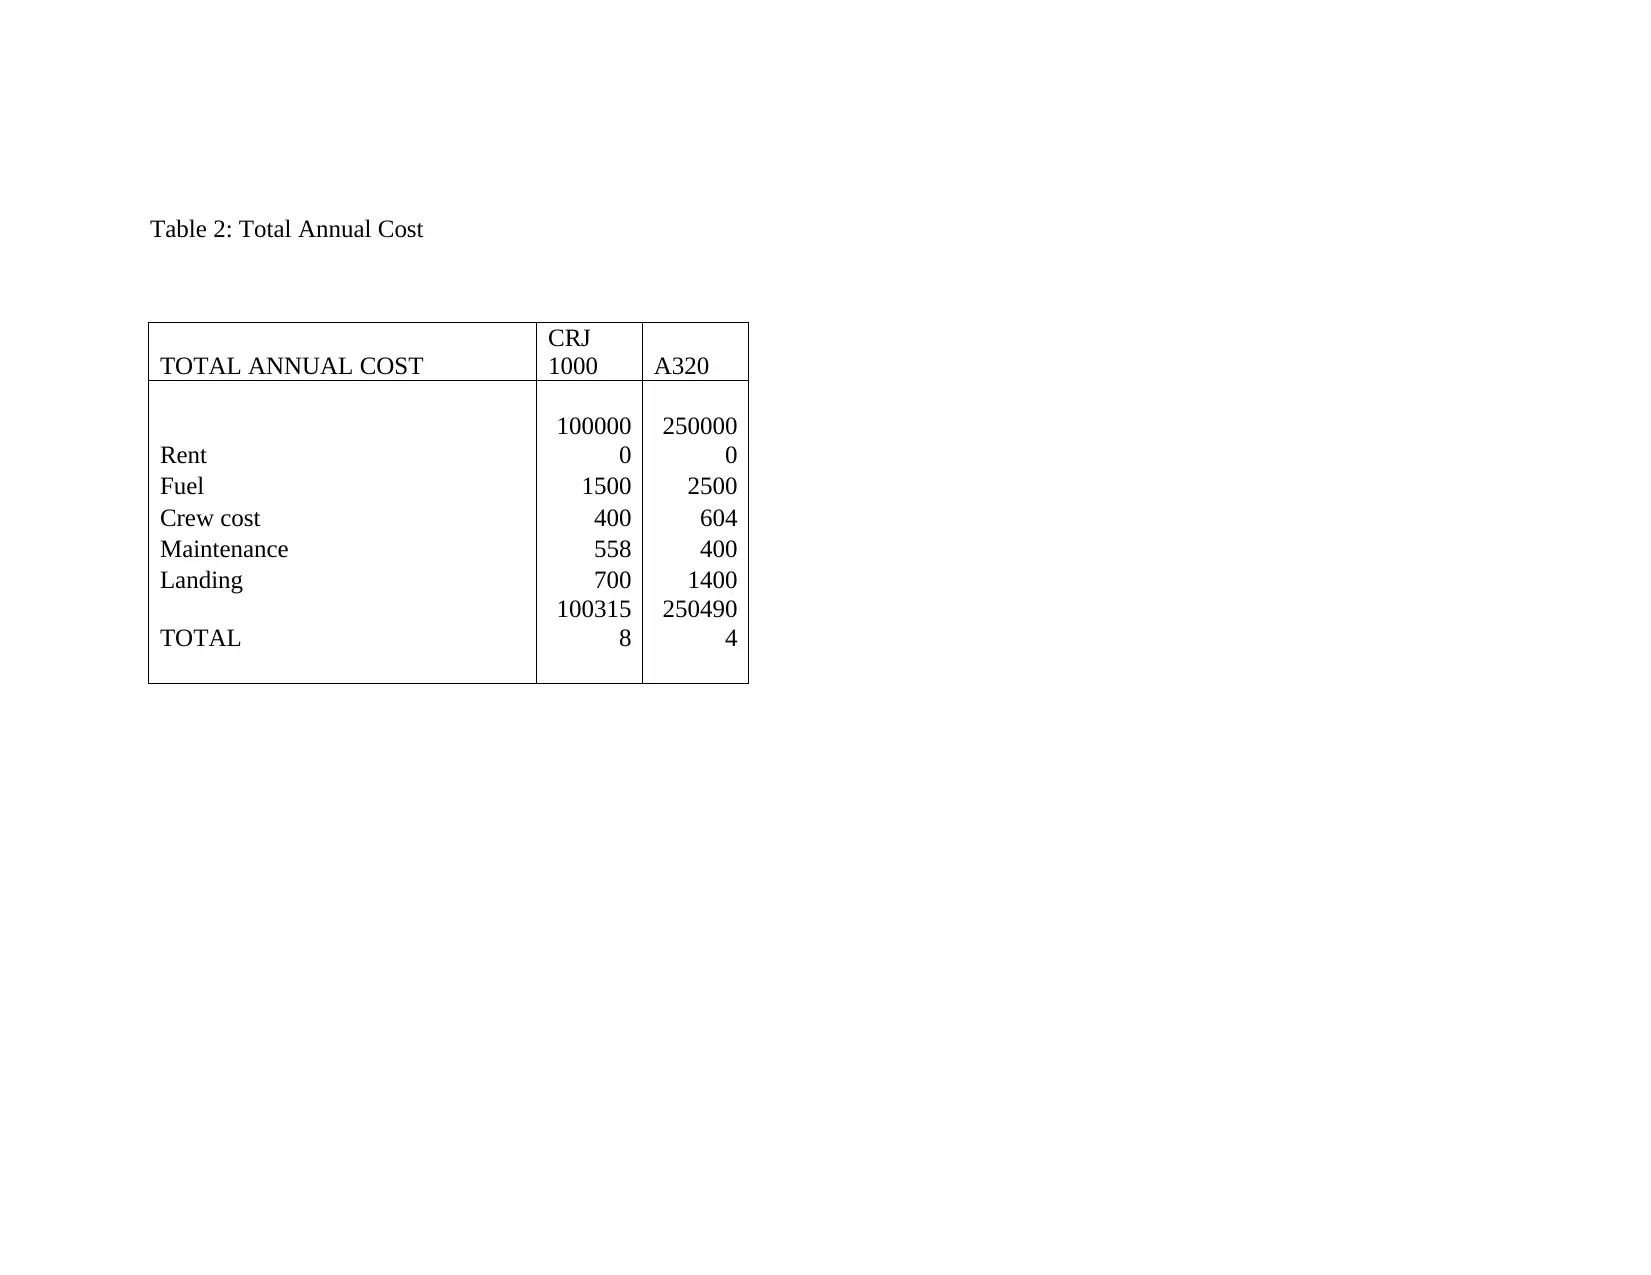
Table 2: Total Annual Cost
TOTAL ANNUAL COST
CRJ
1000 A320
Rent
100000
0
250000
0
Fuel 1500 2500
Crew cost 400 604
Maintenance 558 400
Landing 700 1400
TOTAL
100315
8
250490
4
TOTAL ANNUAL COST
CRJ
1000 A320
Rent
100000
0
250000
0
Fuel 1500 2500
Crew cost 400 604
Maintenance 558 400
Landing 700 1400
TOTAL
100315
8
250490
4
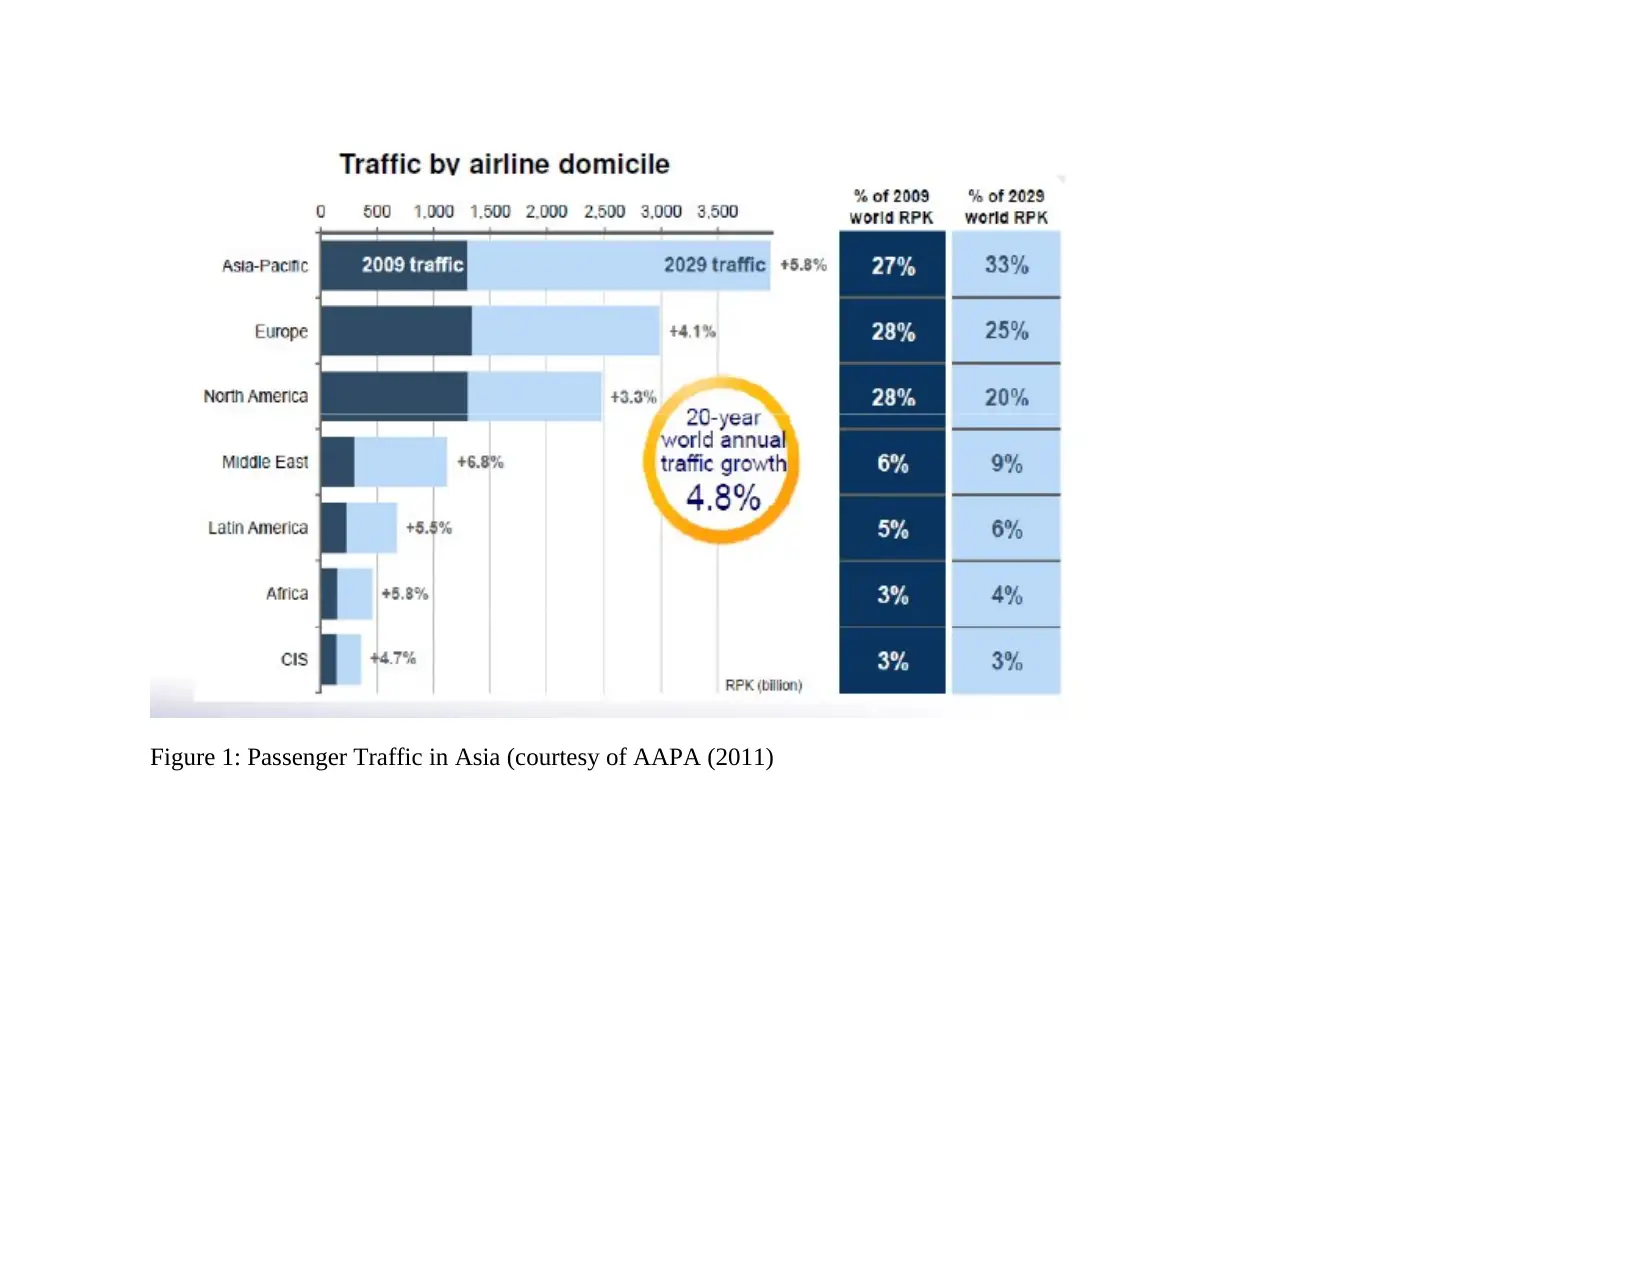
Figure 1: Passenger Traffic in Asia (courtesy of AAPA (2011)
⊘ This is a preview!⊘
Do you want full access?
Subscribe today to unlock all pages.
Trusted by 1+ million students worldwide
3. FLEET PLANNING
In planning for fleet size and capacity over the next decade, the following tenets of airline performance growth will be considered:
3.1 Total Market Traffic
The global airline traffic is expected to grow courtesy of increased air travels as jet oil price has remained averagely stable.
The market volatility normally spirals out of control due to the global economic performance. However, interestingly, in the
US the domestic air travel industry has grown more than the international networks. This was explained as being so due to the
increased threat of global terrorism and the favorable domestic markets that encouraged investments in the private sector more
than at international scale. Notably, after the 2011 attack, the US aviation industry tremendously changed and consequently
affected the world economy (Doganis, 2009). This was further complicated by the Iraqi war which contributed immensely to
skyrocketing fuel prices. However, in the long run, based on the global economics projection, total market traffic is expected to
further grow by at least 1.5% per annum.
3.2 Forecasted traffic growth
This is directly related to total market traffic. In this case, it expected that traffic will grow at the an average rate of 3.7% to
double by 2035. In fact demand for airline travels will see more pressure being piled on the existing infrastructure. This then
will force further growth in the airline infrastructure. Currently, the sustainable growth in terms of implementation of more
efficient airlines will cause it to be a major factor in the growth plan. This will then mean that companies will no longer worry
about losses due to inefficient fuels as technology develops further to boost the jet engine performance. It is estimated that a
total of 7 billion air travelers will be available by the year 2035. Due to improved engine performance, the amount of carbon
foot prints generated by the airline industry will also drastically reduce hence contributing to the green economy.
Paraphrase This Document
Need a fresh take? Get an instant paraphrase of this document with our AI Paraphraser
3.3 Potential competition
Being a startup company, it is expected the 1st year revenues will not be high as competition is still stiff. But with a robust
marketing plan that the company will adopt, this is expected to rise steadily to 25% by the end of the 10th year. The company,
as mentioned earlier, will build more networks, alliances and partnerships. In fact, benchmarking is to be undertaken from the
giant company: Qatar airlines. At the onset, the company will strive to fit in the domestic market portfolio. However, once
performance is stabilized towards the end of the 7th year, the company will certainly go international with a total network
coverage of 38.
3.4 Cargo traffic
This is also expected to grow consequently the nature of cargo transport will also shift such as volume of more perishable
goods are likely to be airlifted . Due to faster and more efficient airlines expected in the industry, growth of cargo traffic is
expected to grow tremendously. Therefore, to meet this demand, the company accommodated this element in its long term
fleet plan where a steady increase in cargo flight is to be undertaken. However, as pointed out by Doganis (2011), this sector is
expected to grow based in such indicators as origin, commodity, service level and the international market performance.
3.7 Network Business Model: Point to Point or Hub and spoke?
There are normally two basic models currently being used in the airline industry, namely: Hub and spoke and Point-to-point
airline. The point to point airline provides a simple routing network that is often suitable for midsized companies flying over short
distances, typically city to city or nearby countries. The hub and spoke was designed to cater for large commercial air travels, such
that the spokes represent the many destinations within the flight network from a single departure point. Grouping this in the
international airspace would give a very complex network web. However, it should be noted that most companies utilize more than
one model but they are often distinct in implementation. The P2P model supports the domestic air travels.
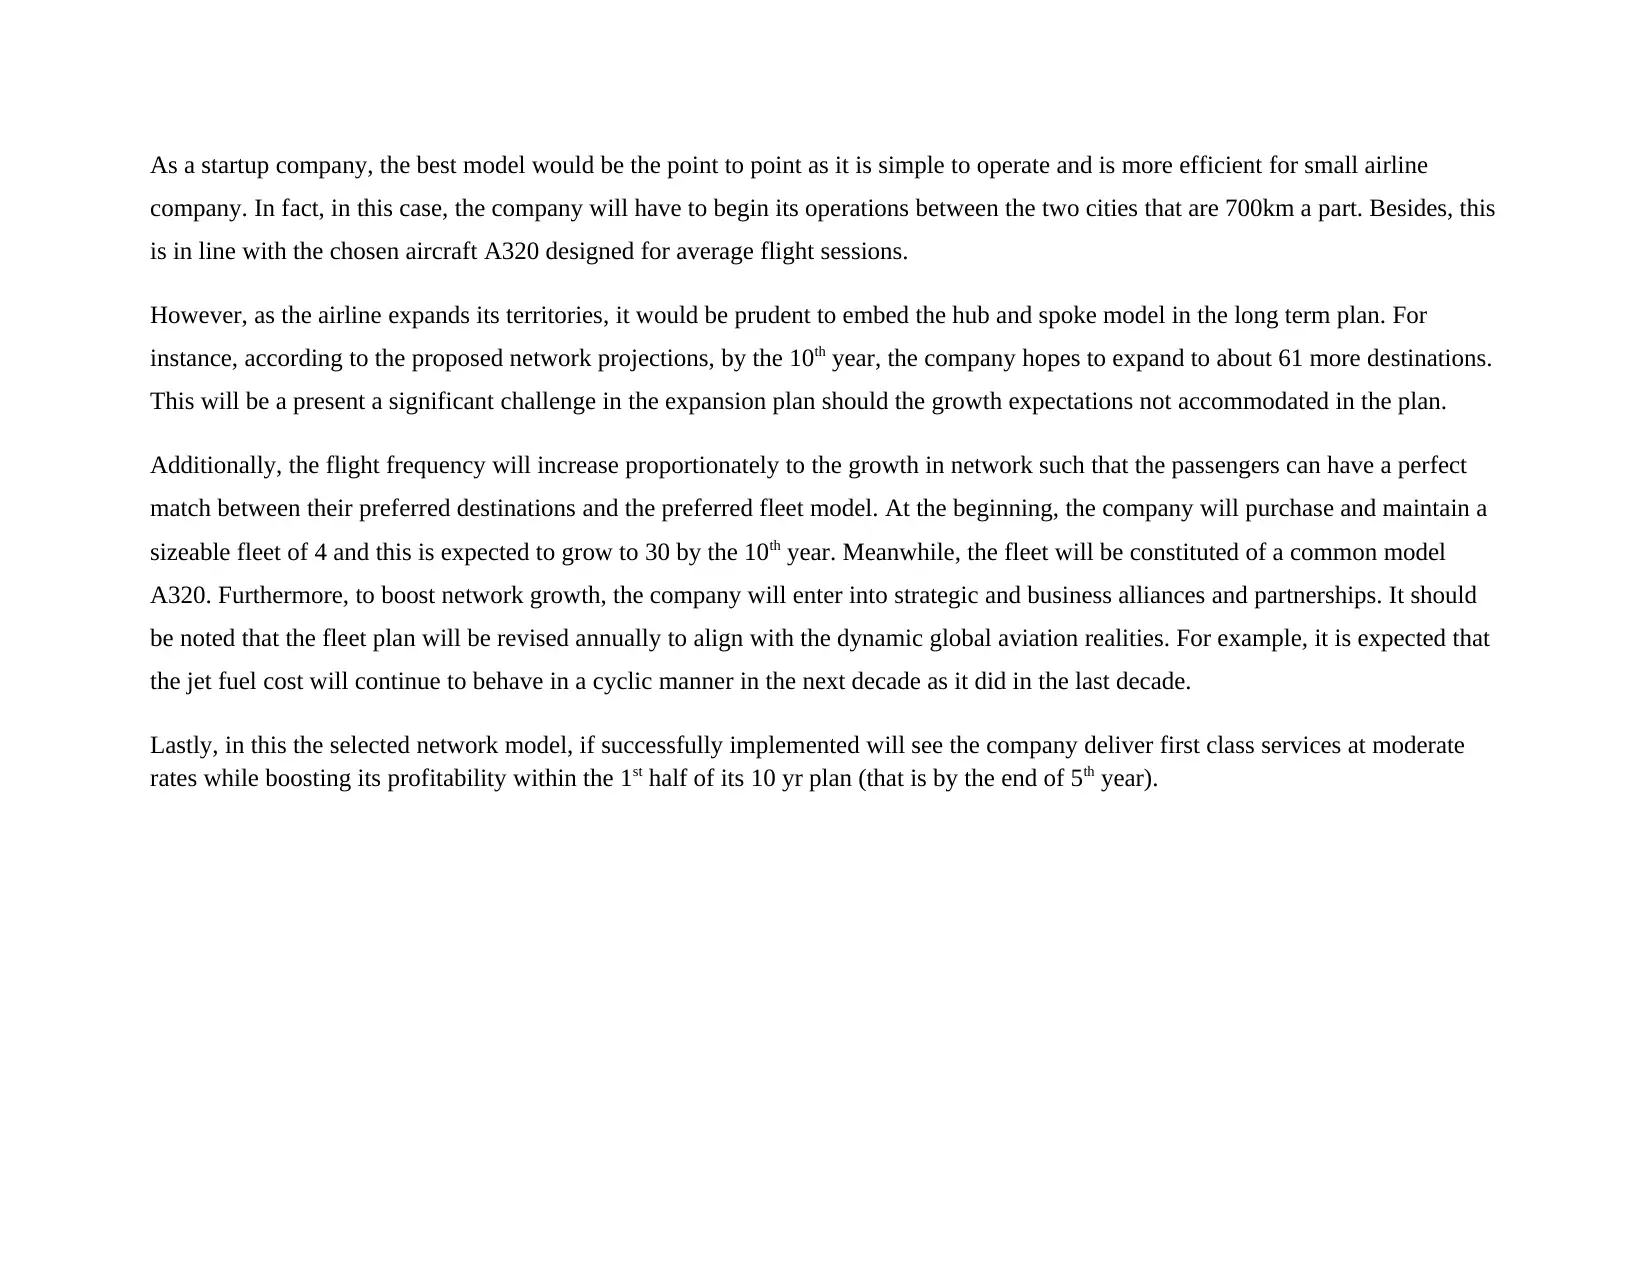
As a startup company, the best model would be the point to point as it is simple to operate and is more efficient for small airline
company. In fact, in this case, the company will have to begin its operations between the two cities that are 700km a part. Besides, this
is in line with the chosen aircraft A320 designed for average flight sessions.
However, as the airline expands its territories, it would be prudent to embed the hub and spoke model in the long term plan. For
instance, according to the proposed network projections, by the 10th year, the company hopes to expand to about 61 more destinations.
This will be a present a significant challenge in the expansion plan should the growth expectations not accommodated in the plan.
Additionally, the flight frequency will increase proportionately to the growth in network such that the passengers can have a perfect
match between their preferred destinations and the preferred fleet model. At the beginning, the company will purchase and maintain a
sizeable fleet of 4 and this is expected to grow to 30 by the 10th year. Meanwhile, the fleet will be constituted of a common model
A320. Furthermore, to boost network growth, the company will enter into strategic and business alliances and partnerships. It should
be noted that the fleet plan will be revised annually to align with the dynamic global aviation realities. For example, it is expected that
the jet fuel cost will continue to behave in a cyclic manner in the next decade as it did in the last decade.
Lastly, in this the selected network model, if successfully implemented will see the company deliver first class services at moderate
rates while boosting its profitability within the 1st half of its 10 yr plan (that is by the end of 5th year).
⊘ This is a preview!⊘
Do you want full access?
Subscribe today to unlock all pages.
Trusted by 1+ million students worldwide
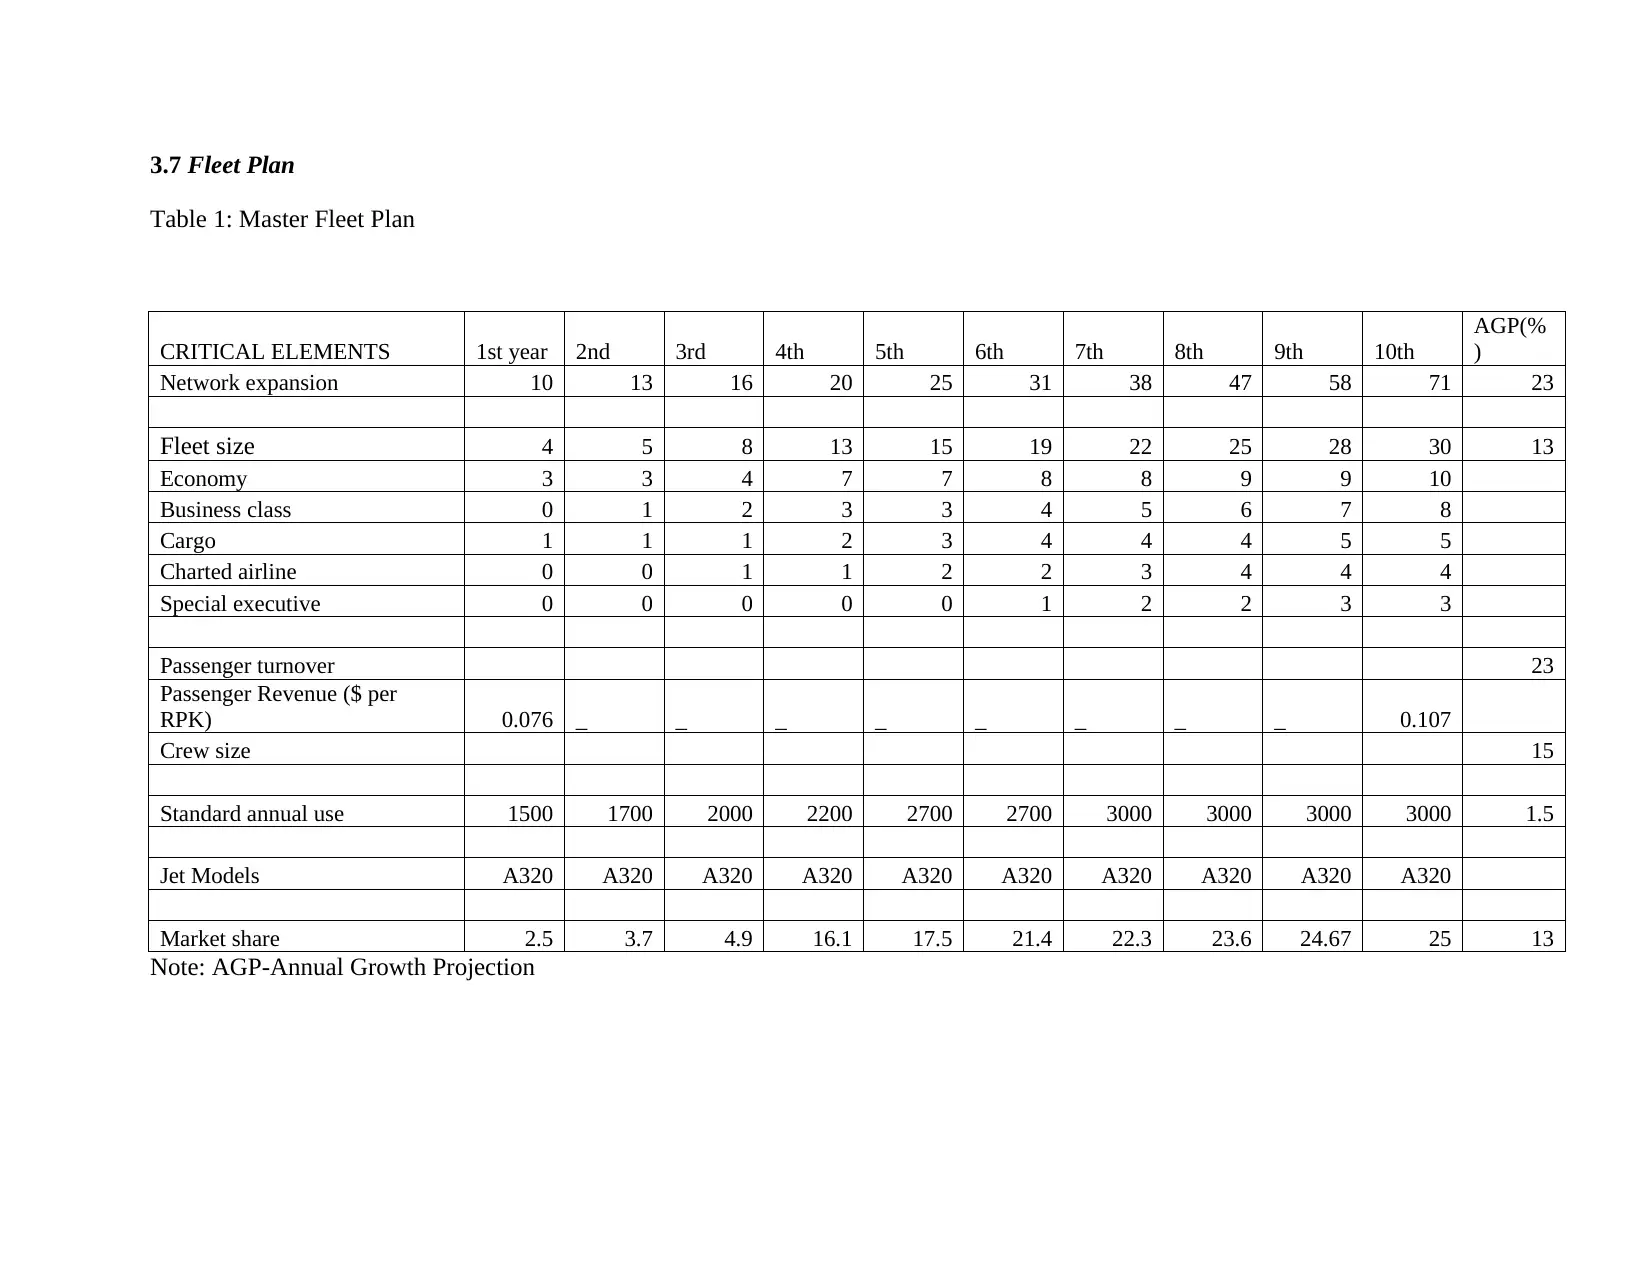
3.7 Fleet Plan
Table 1: Master Fleet Plan
CRITICAL ELEMENTS 1st year 2nd 3rd 4th 5th 6th 7th 8th 9th 10th
AGP(%
)
Network expansion 10 13 16 20 25 31 38 47 58 71 23
Fleet size 4 5 8 13 15 19 22 25 28 30 13
Economy 3 3 4 7 7 8 8 9 9 10
Business class 0 1 2 3 3 4 5 6 7 8
Cargo 1 1 1 2 3 4 4 4 5 5
Charted airline 0 0 1 1 2 2 3 4 4 4
Special executive 0 0 0 0 0 1 2 2 3 3
Passenger turnover 23
Passenger Revenue ($ per
RPK) 0.076 _ _ _ _ _ _ _ _ 0.107
Crew size 15
Standard annual use 1500 1700 2000 2200 2700 2700 3000 3000 3000 3000 1.5
Jet Models A320 A320 A320 A320 A320 A320 A320 A320 A320 A320
Market share 2.5 3.7 4.9 16.1 17.5 21.4 22.3 23.6 24.67 25 13
Note: AGP-Annual Growth Projection
Paraphrase This Document
Need a fresh take? Get an instant paraphrase of this document with our AI Paraphraser
CONCLUSION
From the discussion, it can be noted that selection of the best airline is never one time trade off; it involves a series of decision making
to appropriately choose between the options. However, this is normally made simple given the specific requirements of the company
for which the airline will operate.
References
AERO.com. (2018). AERO - Effective Flight Plans Can Help Airlines Economize. [online] Available at: http://www.bing.com/cr?
IG=5E0257A6D78744EFA0570C17DDB4D693&CID=2E2EB4E473966C44224EBF5B72396DD0&rd=1&h=Otwo2feMTR3
4Xmq8ZrC_ZDw04QKrkCU_Z72oTmBnnIs&v=1&r=http%3a%2f%2fwww.boeing.com%2fcommercial%2faeromagazine
%2farticles%2fqtr_03_09%2farticle_08_1.html&p=DevEx,5205.1 [Accessed 27 Mar. 2018].
Berry, S. and Jia, P. (2010). Tracing the Woes: An Empirical Analysis of the Airline Industry. American Economic Journal:
Microeconomics, 2(3), pp.1-43.
Bowen, J. (2009). Network Change, Deregulation, and Access in the Global Airline Industry*. Economic Geography, 78(4), pp.425-
439.
Cook, G. and Goodwin, J. (2008). Airline Networks: A Comparison of Hub-and-Spoke and Point-to-Point Systems. Journal of
Aviation/Aerospace Education & Research.
Doganis, R. (2009). The airline business. London [u.a.]: Routledge.
Henckels, E. (no year). Airline Industry Overview. Online Pdf.
Herdman, A. (2011).Future Growth of the Airline Industry: How will global competition drive change. Geneva.
Iata.org. (2018). IATA - IATA Forecasts Passenger Demand to Double Over 20 Years. [online] Available at:
http://www.iata.org/pressroom/pr/Pages/2016-10-18-02.aspx [Accessed 28 Mar. 2018].
Skift. (2018). Analysis: Consolidation of U.S. Airline Industry Radically Reducing Competition. [online] Available at:
https://skift.com/2015/07/14/analysis-consolidation-of-u-s-airline-industry-radically-reducing-competition/ [Accessed 28 Mar. 2018].
Vidović, A., Štimac, I. and Vince, D. (2013). DEVELOPMENT OF BUSINESS MODELS OF LOW-COST AIRLINES.
International Journal for Traffic and Transport Engineering, 3(1), pp.69-81.
⊘ This is a preview!⊘
Do you want full access?
Subscribe today to unlock all pages.
Trusted by 1+ million students worldwide
1 out of 12
Related Documents


Your All-in-One AI-Powered Toolkit for Academic Success.
+13062052269
info@desklib.com
Available 24*7 on WhatsApp / Email
![[object Object]](/_next/static/media/star-bottom.7253800d.svg)
Unlock your academic potential
Copyright © 2020–2026 A2Z Services. All Rights Reserved. Developed and managed by ZUCOL.