Fleetwood Corporation: Managing Financial Resources and Decisions
VerifiedAdded on 2022/11/24
|14
|3066
|374
Report
AI Summary
This report presents a comprehensive financial analysis of Fleetwood Corporation. It begins with a PESTLE analysis, examining political, economic, social, technological, legal, and environmental factors impacting the company. The report then delves into a detailed ratio analysis, evaluating liquidity, profitability, and capital structure ratios to assess Fleetwood's financial health and performance. The analysis includes calculations and interpretations of current ratio, quick ratio, net profit margin, return on equity, and debt-equity ratio. Finally, a financial plan is developed, including resource requirements, sales forecasts, and projected profit and loss statements and balance sheets, to improve profitability and address identified financial challenges. The report concludes with a discussion of the company's financial position and strategic recommendations.

Managing Financial Resources and
Decisions
Decisions
Paraphrase This Document
Need a fresh take? Get an instant paraphrase of this document with our AI Paraphraser
Contents
Introduction............................................................................................................................................2
Session-1................................................................................................................................................2
1. PESTLE Analysis for Fleetwood Corporation................................................................................2
Session-2................................................................................................................................................5
Session-3................................................................................................................................................8
References............................................................................................................................................11
Introduction
This report brings out a discussion on Fleetwood Corporation. To undertake the deeper
understanding, this report elaborates PESTLE analysis that will include all the external factors
such as political factors, social factors, economic factors, technological factors, legal factors,
and environmental factors (Morris, & Metternicht, 2016). This will lead to identify the risks and
mitigate it to greater extent. Further, to foresee from the investor point of view, this report
undertakes ratio analysis to analyze the profitability of the Fleetwood Corporation. To
withdraw the issues and improve the profitability, a financial plan will be prepared on the
basis of projections and estimations.
Session-1
1. PESTLE Analysis for Fleetwood Corporation
Political Factors- The Company regulates in several countries where policies of each country
has to be adopted on the basis of construction industry as per the industry`s specific
requirement (Morris, & Metternicht, 2016). Australia as well as emerging countries changed its
regulations. The Australian governmental policies have been enhancing investment in regards
to capital goods market (Fleetwood Corporation, 2016). With the greater acceptance of
policies of these goods, it is seen that scale of policies will last longer as per the present
Australian market (Forde, Colombo, Main, Ohtsu, & Shigeishi, 2016).
⊘ This is a preview!⊘
Do you want full access?
Subscribe today to unlock all pages.
Trusted by 1+ million students worldwide
The country`s environment is threat due to disruptive business environment due to terrorist,
military policies, and other political instable conditions. The company has appropriate
experience of handling the difficult situations (Zolfani, Yazdani, & Zavadskas, 2018).
Economic Factors- According to the market reports, it is seen that the economic performance
of Australia is quite stable and it will remain stable in near future (King, & Boxall, 2019). With
the increase in the government expenditure, greater investment, stable demand, and disposable
income, it is seen that the investment in new industries has been pacing up. At the same time,
liquidity position in great recession time of 2018 will lead to increase in inflation rate in the
economy. The volatile exchange policy rate of the country has been affecting the
corporation`s investment plan where it will affect the long term. The company can easily
access the vibrant market where there is easy accessibility and availability of equity owners so
that they could expand it. It is seen that skills of the humans in Australia is from moderate to
high in the capital market the company can leverage it improve the services in Australia so
that more opportunities can be created around to create the global opportunities.
Social Factors- Fleetwood Corporation has been leveraging both the trends of social as well
as traditional media so that it can know the views of the people in Australia. The company can
use this trend in order to better the market and position its products in market. Broad attitude
created in the Australia for the migration is negative as this affects the international leaders
and managers to manage the operations. Customers of Australia have been preferring high to
experimental products rather than still valuing the proposition in capital sector. The society
culture differs from market to market where it serves and builds the local team to understand
the attitudes and norms to serve better the customers. At the same time, there is an increasing
trend of improper proportional distribution of income in Australia.
Paraphrase This Document
Need a fresh take? Get an instant paraphrase of this document with our AI Paraphraser
Technological factors- this factor is most important when affecting the operations of the
company. In Australia, there is not at all any strong culture in technological transferring.
Organizations are often afraid of transferring and licensing the technology especially due to
the fear of competitors. 5G internet and its potential has been enhancing the user experience
regarding the services it provides to check the accessibility and speed of availing the services.
The latest technology and innovation implemented can fasten the production and the other
service costing in the capital market. The company will have to restructure the supply chain so
that it can bring more flexibility in order to meet cost structures and needs of the customers. It
is observed that Australia has high security and safeguarding IPR and other property
intellectual protection and rights where more players will be able to invest in research and
development activities.
Legal factors- the company has to follow safety and health norms of the Australia where it
will identify the norms and other services to meet the cost of these norms. Level of
environmental law has to be complied by the Fleetwood organisation. The company has to
consider average specific case before thinking of entering the international market as every
country follow other resolutions to solve the case. Legal prevention of property, IPR rights,
patents, intellectual property and will affect the operations of the business. The corporate law
for the business procedure should be followed such as norms are consistent in regards to
European Union and World trade organization.
Environmental factors- constant scrutiny by the environmental agencies have been adding to
the cost of the expenses of the company. Further, these days’ customers do have greater
awareness regarding the environmental factors and they keep it at the center of competitive
strategy (Chodakowska, 2018). At the same time, customers anticipate that company will
adhere to the legal standards but it has exceeded to become more responsible to the
stakeholders. Paris climate agreement has changed the real targets to the national government
of Australia and promoted to check the environmental standards for the company
(Chodakowska, 2018). Extreme weather has also been adding to the suppressing operations that
lead to invest in creating the supply chain more flexible (Chodakowska, 2018).
2. This analysis will further help the stakeholders to know the situation and invest
accordingly (Caudron et al., 2018). From the most prominent criteria, this discussion will
reflect the evaluation on liquidity, capital structure, profitability, credibility, stability, and
turnover basis of the Fleetwood Corporation (Caudron et al., 2018). The main KPIs of the
financial performance will be in the light of profitability, liquidity, turnover and
credibility. A deeper understanding has been given in session-2.
3. Financial plan will assist the organization to accomplish and meet customer needs and
earn greater profits. The plan is discussed in Section-3.
Session-2
1. Increasing recreational spending for the recreational vehicles has led to the enhancement
of industry by increasing demand and its profitability. Rapid liberation and easy
availability of finace will positively affect the demand of vehicles. The industry has been
offering numerous services to the customers to access and improve convenience such as
accident insurance, low price availability, payment sharing modes, and roadside
assistance has led to pacing up of number of consumers have been opting for rental
options. In 2017, market size of USD 23 billion own to economic cost. These vehicles have high
⊘ This is a preview!⊘
Do you want full access?
Subscribe today to unlock all pages.
Trusted by 1+ million students worldwide
compression ratios so that it could perform better in winter. Market for recreational vehicles will be
nearly 60 percent of market share.
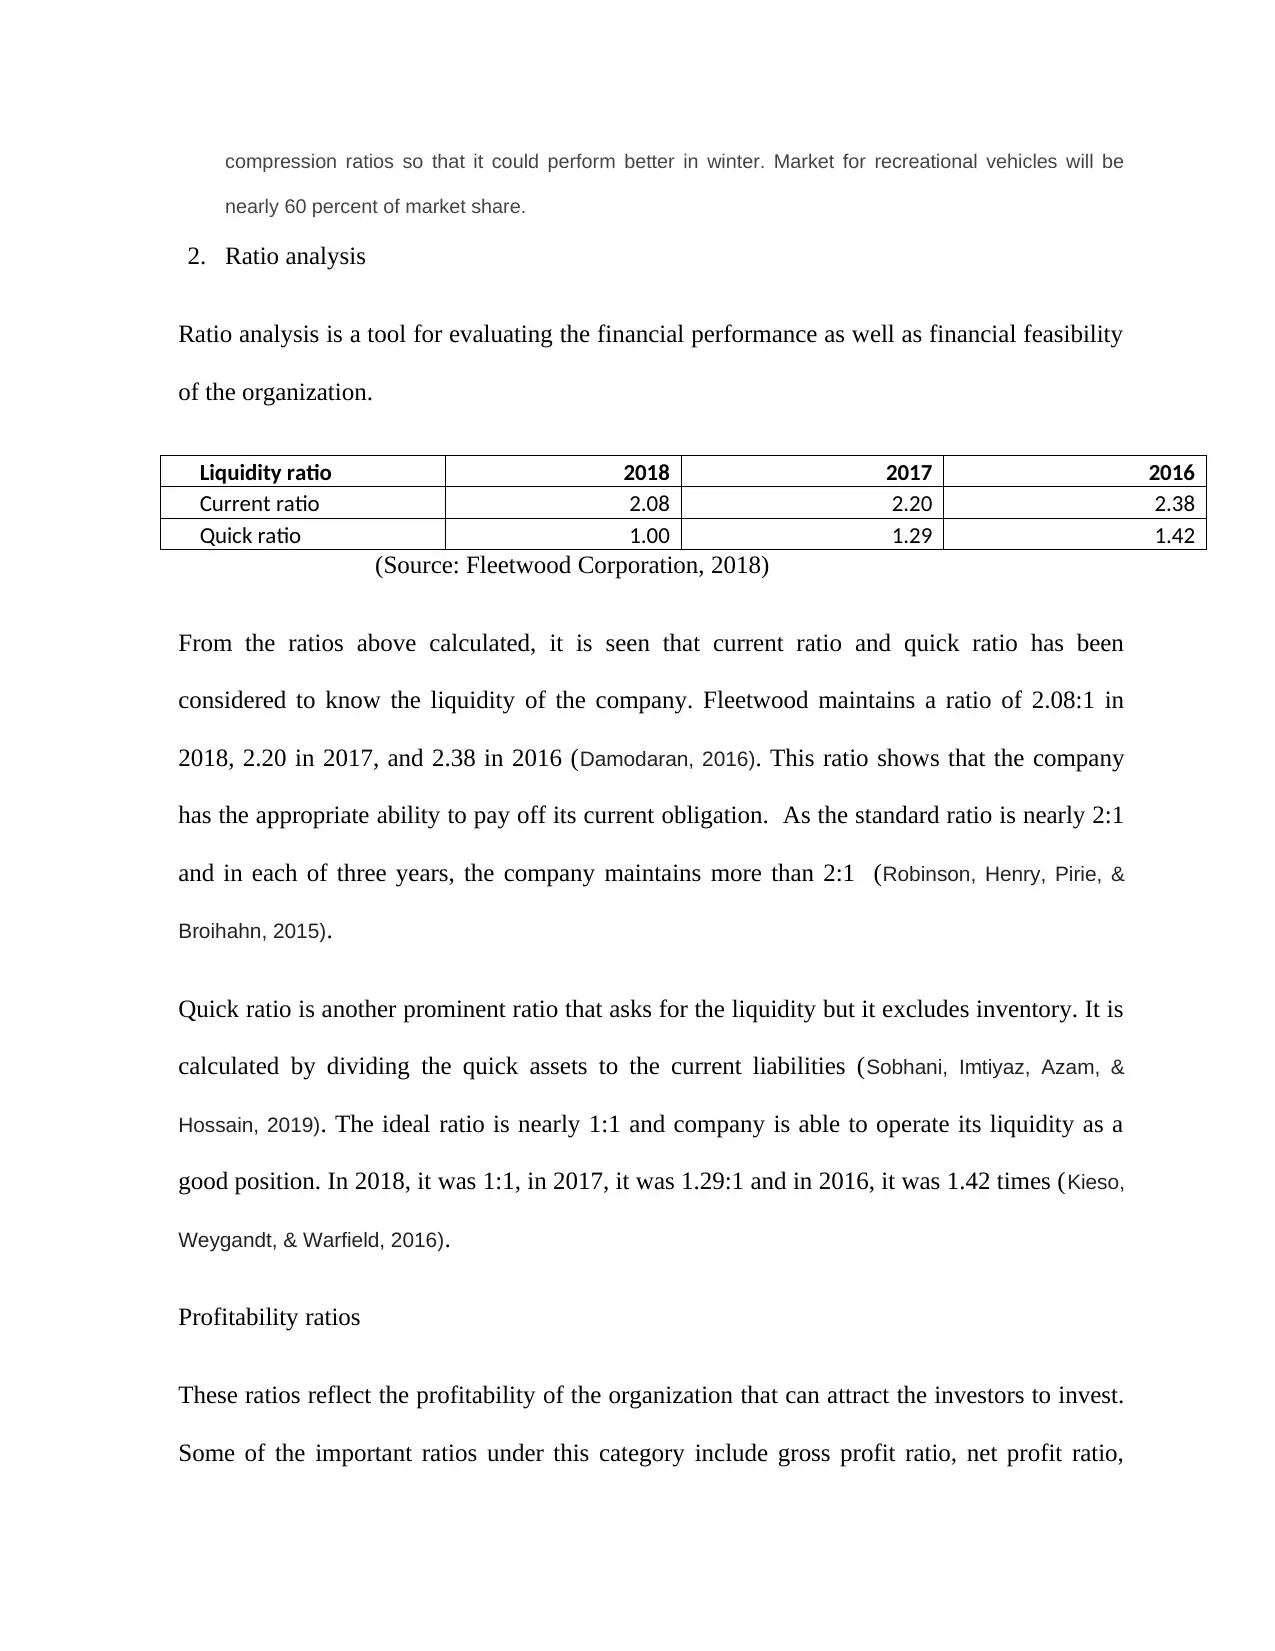
2. Ratio analysis
Ratio analysis is a tool for evaluating the financial performance as well as financial feasibility
of the organization.
Liquidity ratio 2018 2017 2016
Current ratio 2.08 2.20 2.38
Quick ratio 1.00 1.29 1.42
(Source: Fleetwood Corporation, 2018)
From the ratios above calculated, it is seen that current ratio and quick ratio has been
considered to know the liquidity of the company. Fleetwood maintains a ratio of 2.08:1 in
2018, 2.20 in 2017, and 2.38 in 2016 (Damodaran, 2016). This ratio shows that the company
has the appropriate ability to pay off its current obligation. As the standard ratio is nearly 2:1
and in each of three years, the company maintains more than 2:1 (Robinson, Henry, Pirie, &
Broihahn, 2015).
Quick ratio is another prominent ratio that asks for the liquidity but it excludes inventory. It is
calculated by dividing the quick assets to the current liabilities (Sobhani, Imtiyaz, Azam, &
Hossain, 2019). The ideal ratio is nearly 1:1 and company is able to operate its liquidity as a
good position. In 2018, it was 1:1, in 2017, it was 1.29:1 and in 2016, it was 1.42 times (Kieso,
Weygandt, & Warfield, 2016).
Profitability ratios
These ratios reflect the profitability of the organization that can attract the investors to invest.
Some of the important ratios under this category include gross profit ratio, net profit ratio,
nearly 60 percent of market share.
2. Ratio analysis
Ratio analysis is a tool for evaluating the financial performance as well as financial feasibility
of the organization.
Liquidity ratio 2018 2017 2016
Current ratio 2.08 2.20 2.38
Quick ratio 1.00 1.29 1.42
(Source: Fleetwood Corporation, 2018)
From the ratios above calculated, it is seen that current ratio and quick ratio has been
considered to know the liquidity of the company. Fleetwood maintains a ratio of 2.08:1 in
2018, 2.20 in 2017, and 2.38 in 2016 (Damodaran, 2016). This ratio shows that the company
has the appropriate ability to pay off its current obligation. As the standard ratio is nearly 2:1
and in each of three years, the company maintains more than 2:1 (Robinson, Henry, Pirie, &
Broihahn, 2015).
Quick ratio is another prominent ratio that asks for the liquidity but it excludes inventory. It is
calculated by dividing the quick assets to the current liabilities (Sobhani, Imtiyaz, Azam, &
Hossain, 2019). The ideal ratio is nearly 1:1 and company is able to operate its liquidity as a
good position. In 2018, it was 1:1, in 2017, it was 1.29:1 and in 2016, it was 1.42 times (Kieso,
Weygandt, & Warfield, 2016).
Profitability ratios
These ratios reflect the profitability of the organization that can attract the investors to invest.
Some of the important ratios under this category include gross profit ratio, net profit ratio,
Paraphrase This Document
Need a fresh take? Get an instant paraphrase of this document with our AI Paraphraser
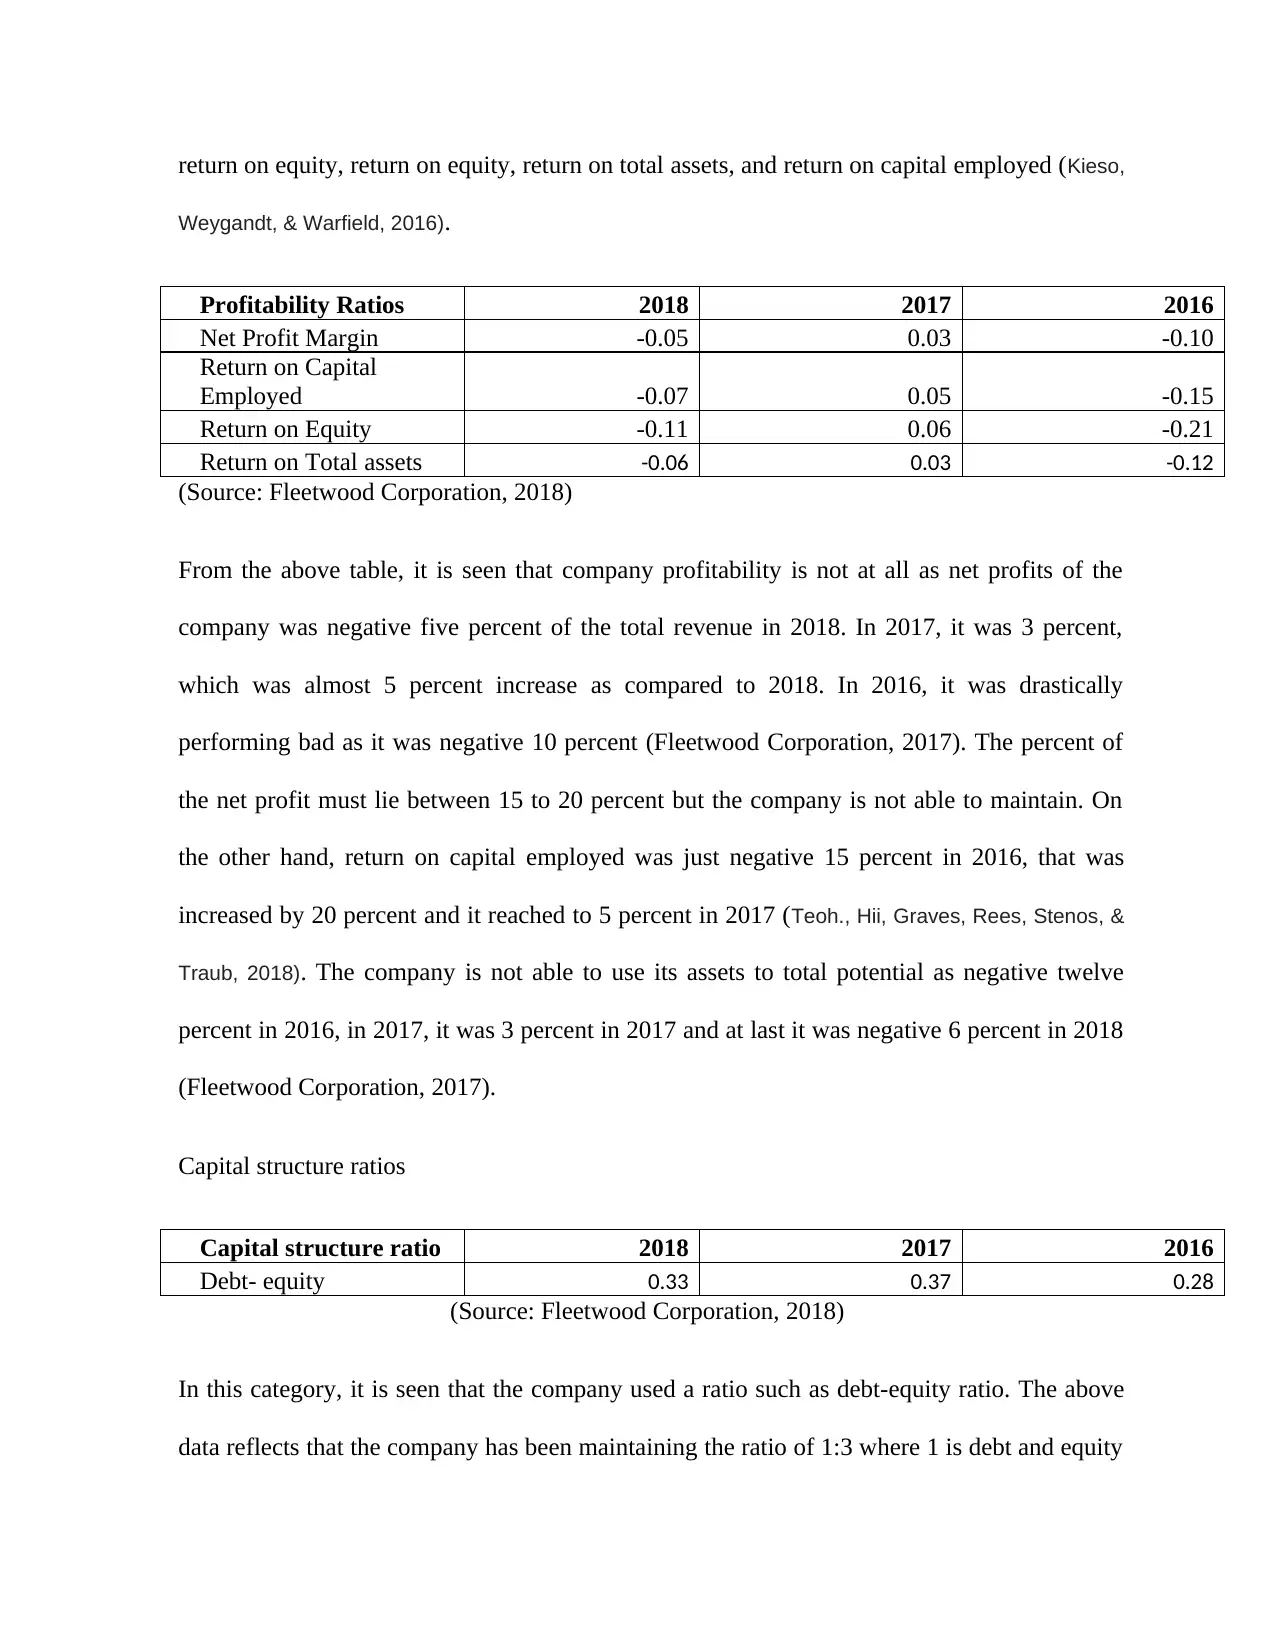
return on equity, return on equity, return on total assets, and return on capital employed (Kieso,
Weygandt, & Warfield, 2016).
Profitability Ratios 2018 2017 2016
Net Profit Margin -0.05 0.03 -0.10
Return on Capital
Employed -0.07 0.05 -0.15
Return on Equity -0.11 0.06 -0.21
Return on Total assets -0.06 0.03 -0.12
(Source: Fleetwood Corporation, 2018)
From the above table, it is seen that company profitability is not at all as net profits of the
company was negative five percent of the total revenue in 2018. In 2017, it was 3 percent,
which was almost 5 percent increase as compared to 2018. In 2016, it was drastically
performing bad as it was negative 10 percent (Fleetwood Corporation, 2017). The percent of
the net profit must lie between 15 to 20 percent but the company is not able to maintain. On
the other hand, return on capital employed was just negative 15 percent in 2016, that was
increased by 20 percent and it reached to 5 percent in 2017 (Teoh., Hii, Graves, Rees, Stenos, &
Traub, 2018). The company is not able to use its assets to total potential as negative twelve
percent in 2016, in 2017, it was 3 percent in 2017 and at last it was negative 6 percent in 2018
(Fleetwood Corporation, 2017).
Capital structure ratios
Capital structure ratio 2018 2017 2016
Debt- equity 0.33 0.37 0.28
(Source: Fleetwood Corporation, 2018)
In this category, it is seen that the company used a ratio such as debt-equity ratio. The above
data reflects that the company has been maintaining the ratio of 1:3 where 1 is debt and equity
is 3. In 2016, it was nearly .28, in 2017, it was .37 percent, and finally it was .33 percent in
2018 (Fleetwood Corporation, 2018).
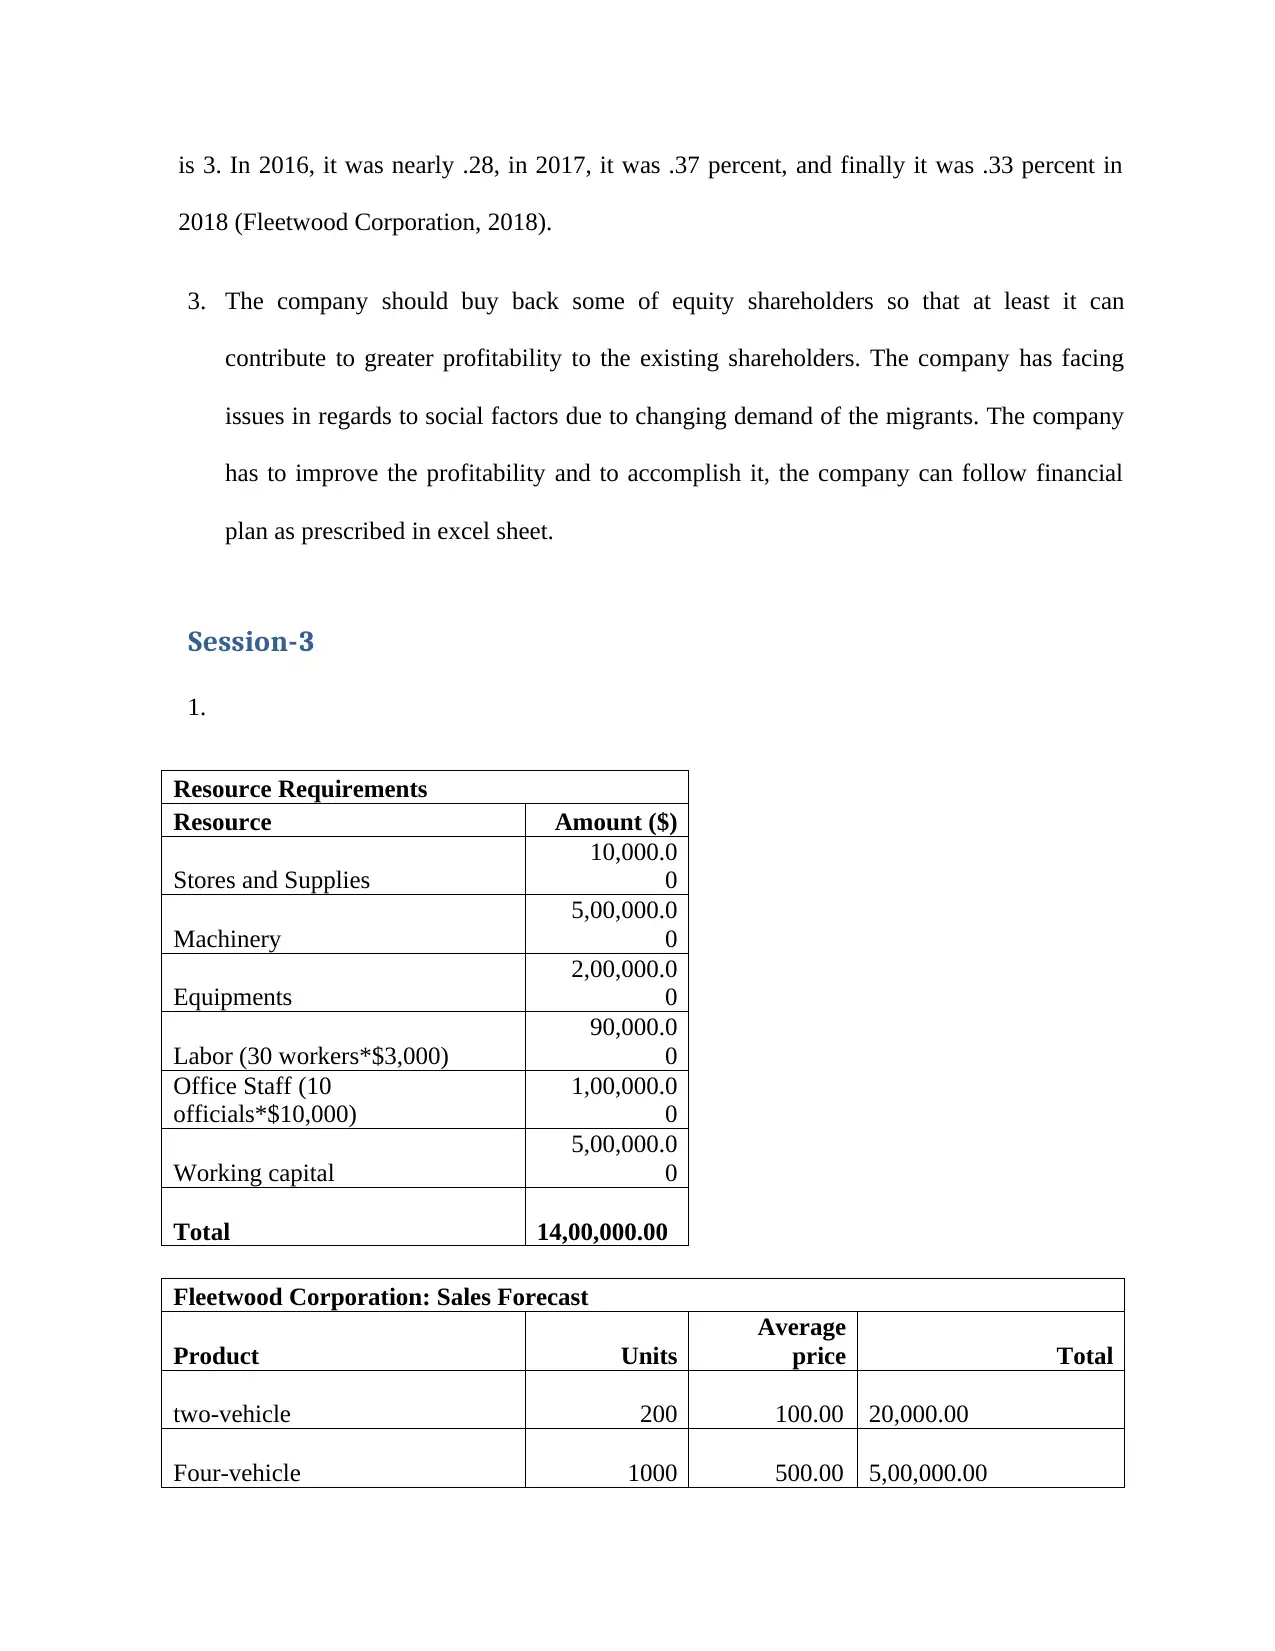
3. The company should buy back some of equity shareholders so that at least it can
contribute to greater profitability to the existing shareholders. The company has facing
issues in regards to social factors due to changing demand of the migrants. The company
has to improve the profitability and to accomplish it, the company can follow financial
plan as prescribed in excel sheet.
Session-3
1.
Resource Requirements
Resource Amount ($)
Stores and Supplies
10,000.0
0
Machinery
5,00,000.0
0
Equipments
2,00,000.0
0
Labor (30 workers*$3,000)
90,000.0
0
Office Staff (10
officials*$10,000)
1,00,000.0
0
Working capital
5,00,000.0
0
Total 14,00,000.00
Fleetwood Corporation: Sales Forecast
Product Units
Average
price Total
two-vehicle 200 100.00 20,000.00
Four-vehicle 1000 500.00 5,00,000.00
2018 (Fleetwood Corporation, 2018).
3. The company should buy back some of equity shareholders so that at least it can
contribute to greater profitability to the existing shareholders. The company has facing
issues in regards to social factors due to changing demand of the migrants. The company
has to improve the profitability and to accomplish it, the company can follow financial
plan as prescribed in excel sheet.
Session-3
1.
Resource Requirements
Resource Amount ($)
Stores and Supplies
10,000.0
0
Machinery
5,00,000.0
0
Equipments
2,00,000.0
0
Labor (30 workers*$3,000)
90,000.0
0
Office Staff (10
officials*$10,000)
1,00,000.0
0
Working capital
5,00,000.0
0
Total 14,00,000.00
Fleetwood Corporation: Sales Forecast
Product Units
Average
price Total
two-vehicle 200 100.00 20,000.00
Four-vehicle 1000 500.00 5,00,000.00
⊘ This is a preview!⊘
Do you want full access?
Subscribe today to unlock all pages.
Trusted by 1+ million students worldwide
Accessories 300 100.00 30,000.00
Total 5,50,000.00
Fleetwood Corporation
Profit & Loss Statement
Amount ($)
2019 2020 2021
Sales
5,50,000.0
0 $6,05,000 $7,26,000
Miscellaneous income $0 $60,500 $72,600
A. Total $5,50,000 $6,65,500 $7,98,600
B. Cost of Sales $3,30,000 $3,32,750 $3,99,300
C. Gross Profit (A-B) $2,20,000 $3,32,750 $3,99,300
D. Operating Expenses
Salary $1,00,000 $1,05,000 $1,10,250
Rent $12,000 $12,600 $13,230
Utilities $1,000 $1,050 $1,103
Insurance $500 $525 $551
Depreciation $70,000 $73,500 $77,175
Marketing $10,000 $10,500 $11,025
Maintenance & Repairs $5,000 $5,250 $5,513
Other $2,500 $2,625 $2,756
Total $2,01,000 $2,11,050 $2,21,603
Operating profit $19,000 $1,21,700 $1,77,698
Less: Interest $15,000 $12,500 $10,000
Profit before tax $4,000 $1,09,200 $1,67,698
Less: Tax @ 30% $1,200 $32,760 $50,309
Net Profit AT $2,800 $76,440 $1,17,388
Fleetwood Corporation
Balance Sheet
Amount ($)
Assets 2019 2020 2021
Current $6,00,000 $7,20,000 $8,64,000
Fixed $7,00,000 $7,00,000 $7,00,000
Other assets $1,40,000 $1,00,000 $1,00,000
Total Assets $14,40,000 $15,20,000 $16,64,000
Paraphrase This Document
Need a fresh take? Get an instant paraphrase of this document with our AI Paraphraser
Liabilities
Current $3,00,000 $3,60,000 $4,32,000
Non-Current (Borrowings) $3,00,000 $2,50,000 $2,00,000
Total Liabilities $6,00,000 $6,10,000 $6,32,000
Equity $8,40,000 $9,10,000 $10,32,000
Total Liabilities & Equity $14,40,000 $15,20,000 $16,64,000
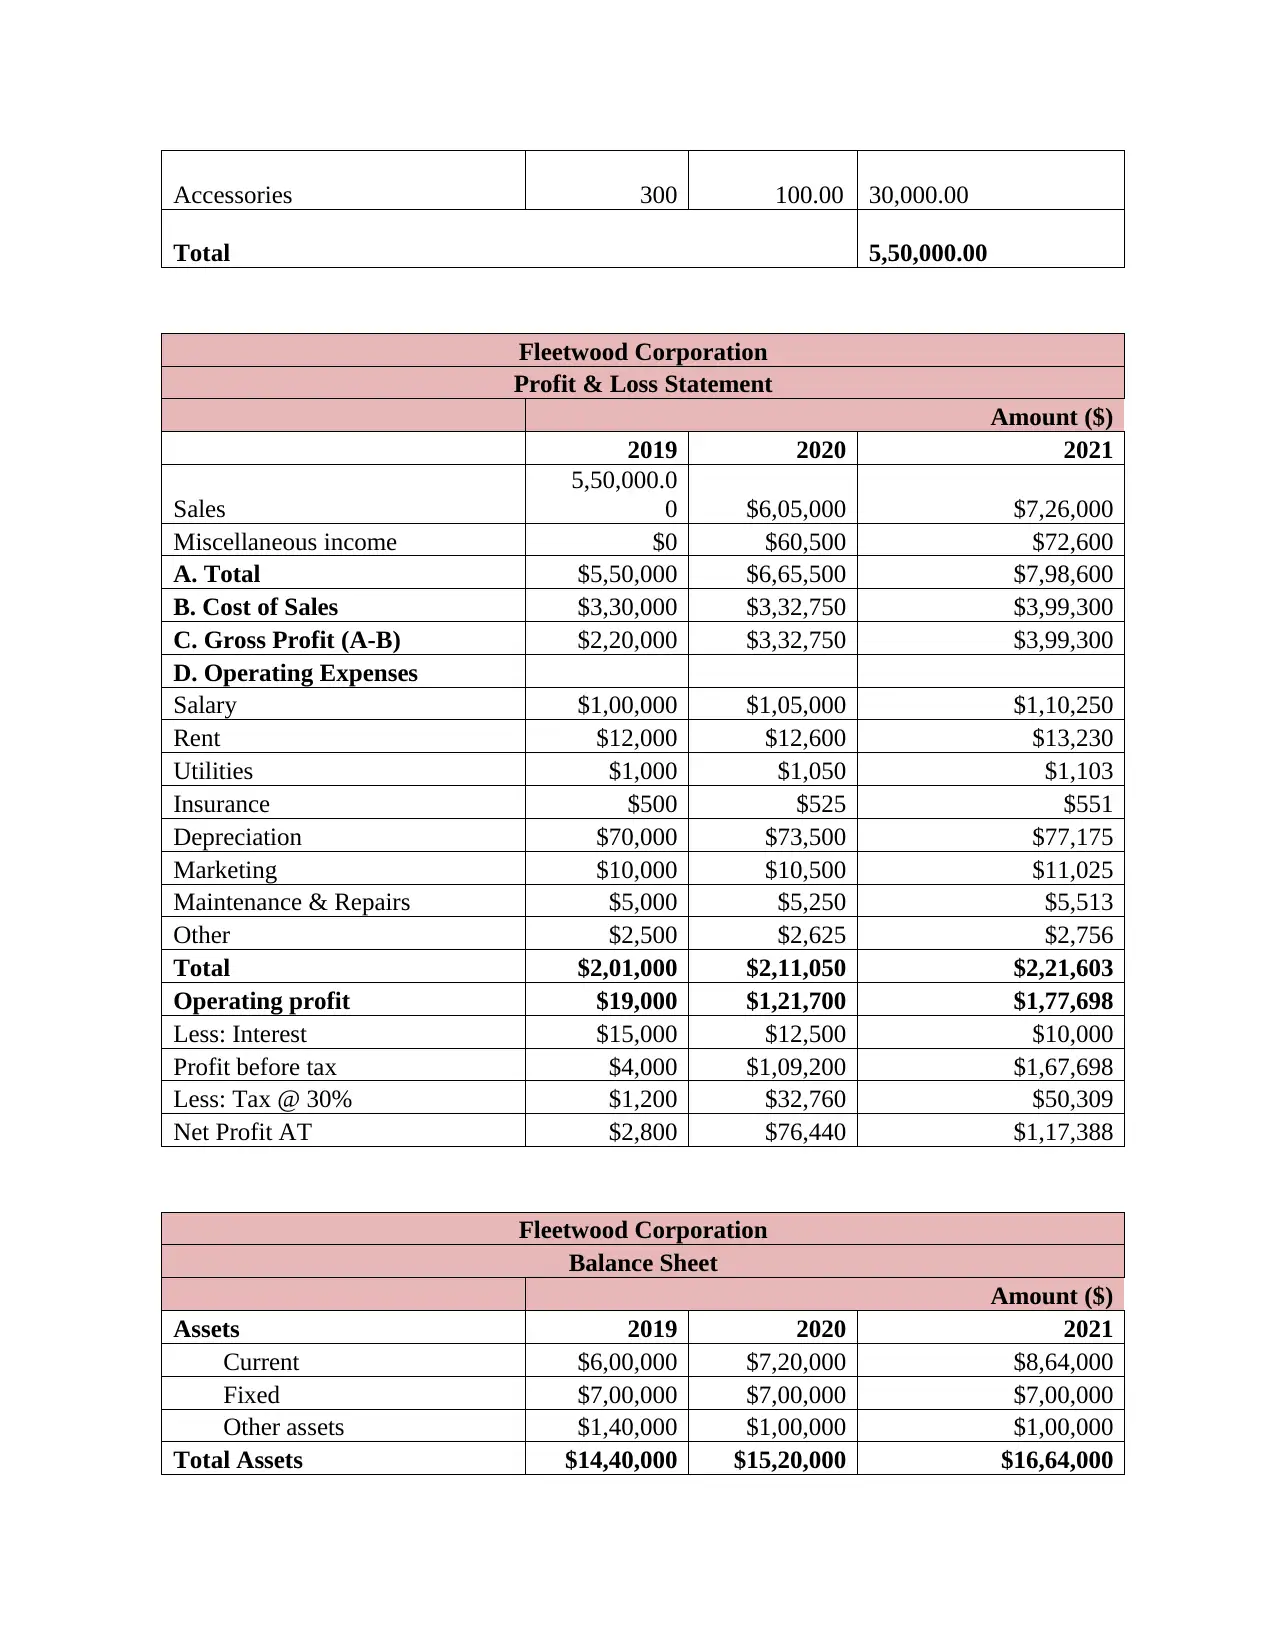
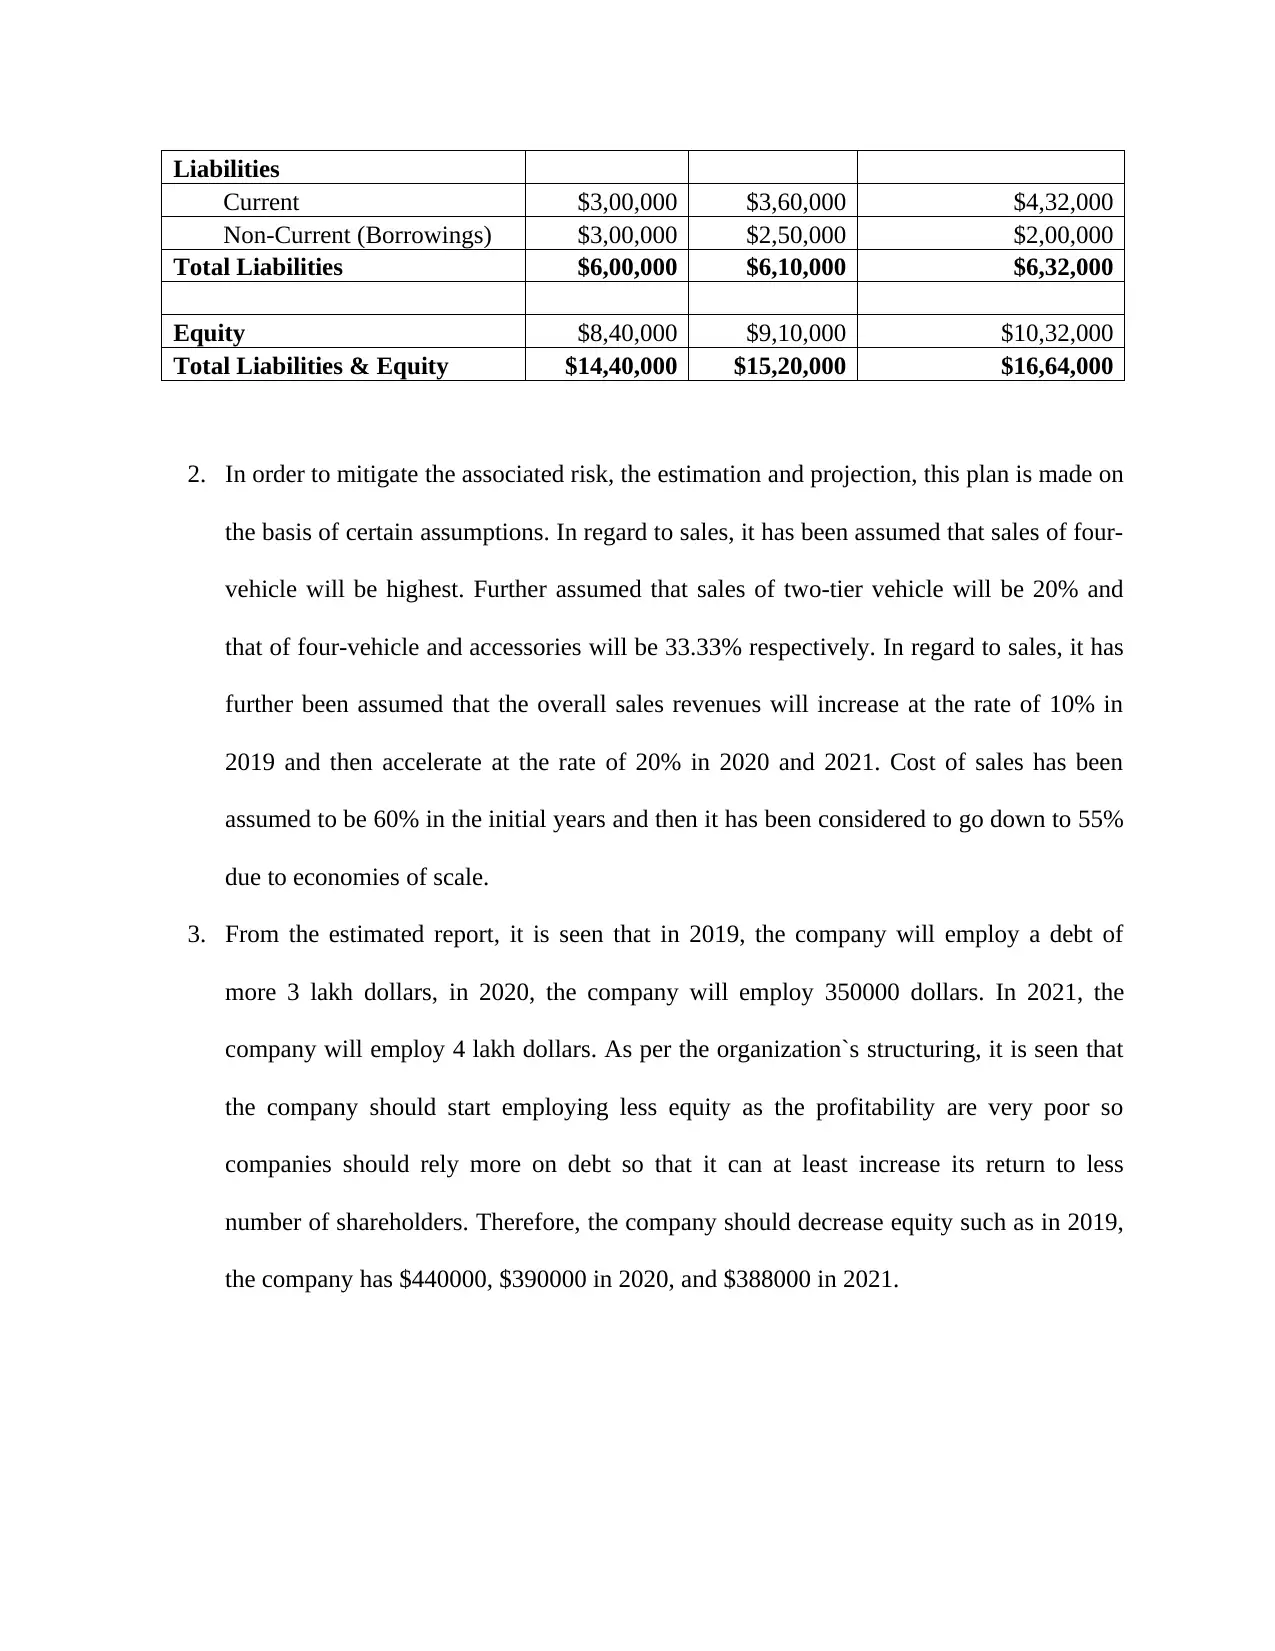
2. In order to mitigate the associated risk, the estimation and projection, this plan is made on
the basis of certain assumptions. In regard to sales, it has been assumed that sales of four-
vehicle will be highest. Further assumed that sales of two-tier vehicle will be 20% and
that of four-vehicle and accessories will be 33.33% respectively. In regard to sales, it has
further been assumed that the overall sales revenues will increase at the rate of 10% in
2019 and then accelerate at the rate of 20% in 2020 and 2021. Cost of sales has been
assumed to be 60% in the initial years and then it has been considered to go down to 55%
due to economies of scale.
3. From the estimated report, it is seen that in 2019, the company will employ a debt of
more 3 lakh dollars, in 2020, the company will employ 350000 dollars. In 2021, the
company will employ 4 lakh dollars. As per the organization`s structuring, it is seen that
the company should start employing less equity as the profitability are very poor so
companies should rely more on debt so that it can at least increase its return to less
number of shareholders. Therefore, the company should decrease equity such as in 2019,
the company has $440000, $390000 in 2020, and $388000 in 2021.
Current $3,00,000 $3,60,000 $4,32,000
Non-Current (Borrowings) $3,00,000 $2,50,000 $2,00,000
Total Liabilities $6,00,000 $6,10,000 $6,32,000
Equity $8,40,000 $9,10,000 $10,32,000
Total Liabilities & Equity $14,40,000 $15,20,000 $16,64,000
2. In order to mitigate the associated risk, the estimation and projection, this plan is made on
the basis of certain assumptions. In regard to sales, it has been assumed that sales of four-
vehicle will be highest. Further assumed that sales of two-tier vehicle will be 20% and
that of four-vehicle and accessories will be 33.33% respectively. In regard to sales, it has
further been assumed that the overall sales revenues will increase at the rate of 10% in
2019 and then accelerate at the rate of 20% in 2020 and 2021. Cost of sales has been
assumed to be 60% in the initial years and then it has been considered to go down to 55%
due to economies of scale.
3. From the estimated report, it is seen that in 2019, the company will employ a debt of
more 3 lakh dollars, in 2020, the company will employ 350000 dollars. In 2021, the
company will employ 4 lakh dollars. As per the organization`s structuring, it is seen that
the company should start employing less equity as the profitability are very poor so
companies should rely more on debt so that it can at least increase its return to less
number of shareholders. Therefore, the company should decrease equity such as in 2019,
the company has $440000, $390000 in 2020, and $388000 in 2021.

⊘ This is a preview!⊘
Do you want full access?
Subscribe today to unlock all pages.
Trusted by 1+ million students worldwide
1 out of 14
Related Documents


Your All-in-One AI-Powered Toolkit for Academic Success.
+13062052269
info@desklib.com
Available 24*7 on WhatsApp / Email
![[object Object]](/_next/static/media/star-bottom.7253800d.svg)
Unlock your academic potential
Copyright © 2020–2026 A2Z Services. All Rights Reserved. Developed and managed by ZUCOL.