Statistics Homework: Flight Cancellation Data Analysis Project
VerifiedAdded on 2023/06/11
|9
|1355
|412
Homework Assignment
AI Summary
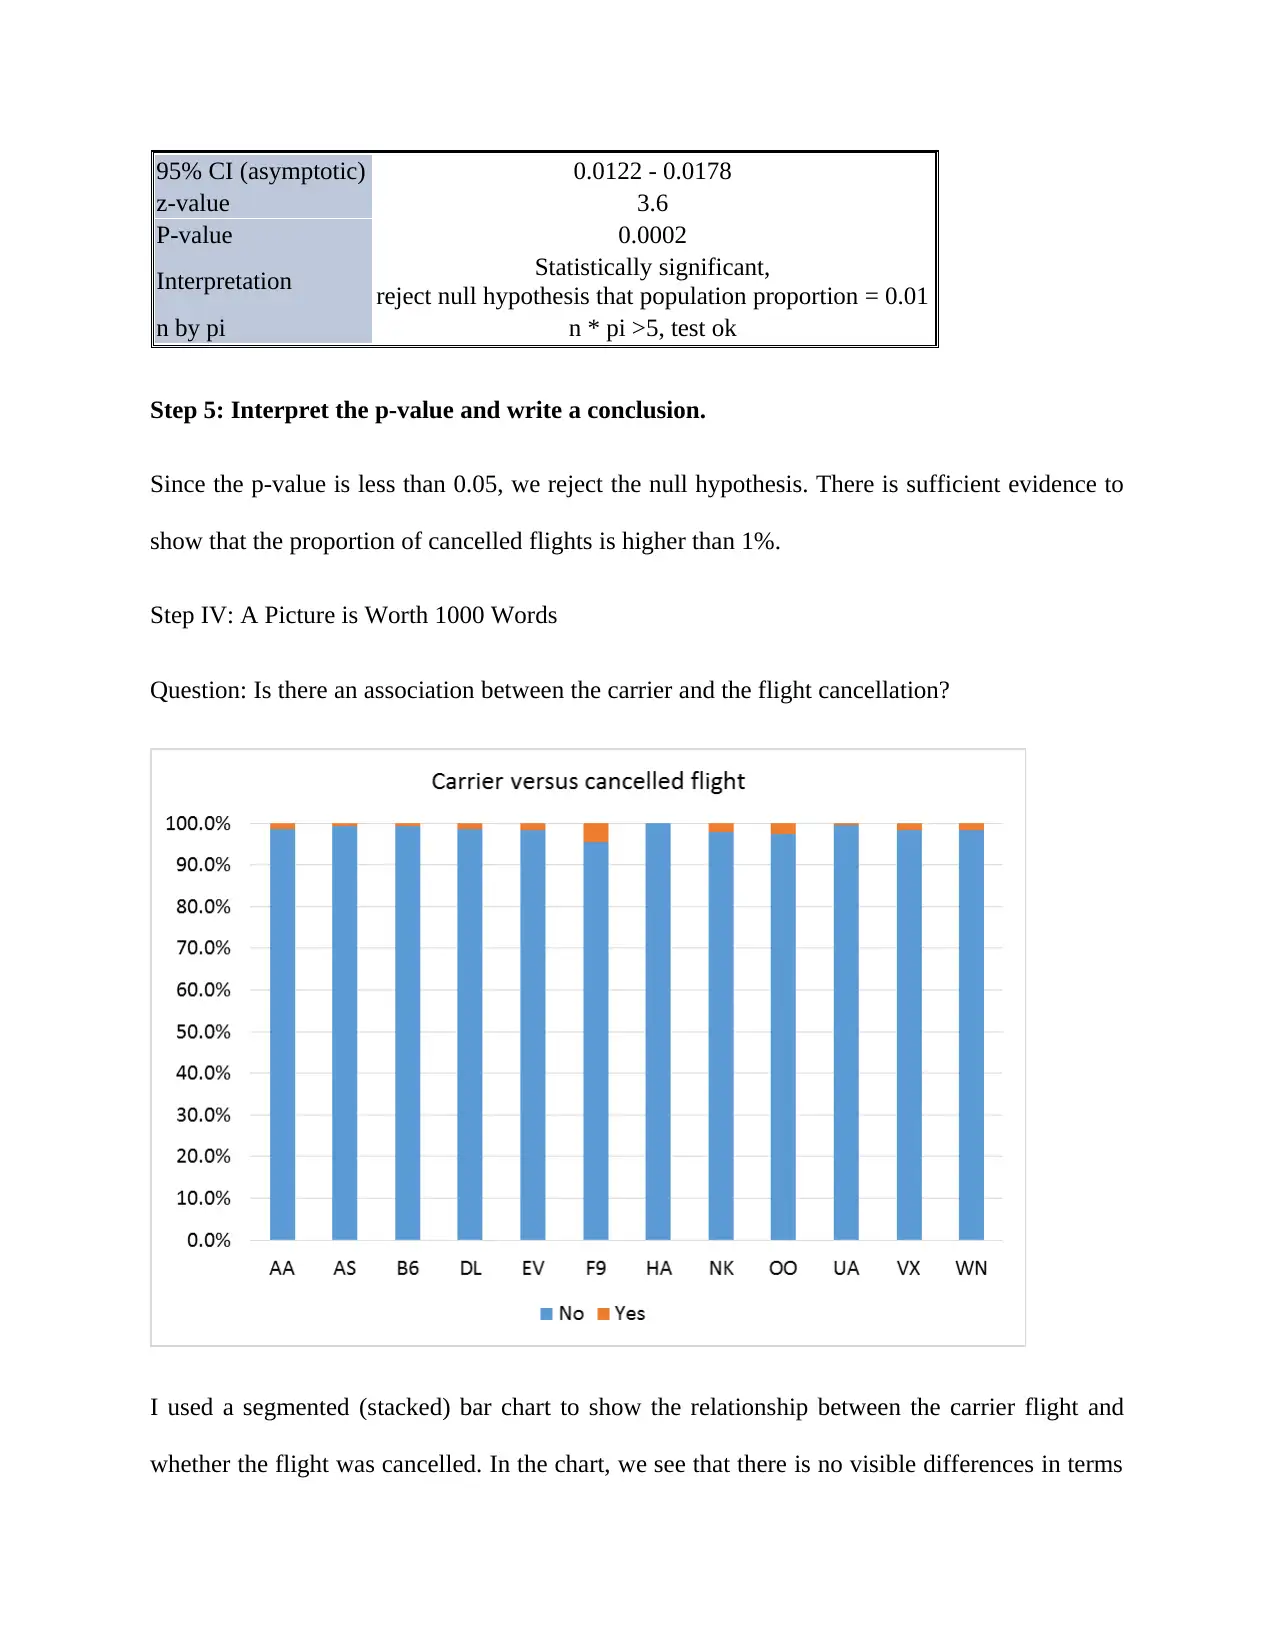
This assignment solution delves into the statistical analysis of flight cancellation data. It begins by identifying the types of variables present in the dataset, categorizing them as either categorical or quantitative. The solution then outlines various statistical procedures applicable to the data, including proportion Z intervals and tests, t-tests, and chi-square tests, alongside relevant research questions. A hypothesis test is conducted to determine if the proportion of cancelled flights exceeds 1%, employing a one-proportion z-test. The results lead to the rejection of the null hypothesis, suggesting that the proportion of cancelled flights is indeed higher than 1%. Furthermore, a chi-square test is performed to assess the association between carrier type and flight cancellation, revealing no significant association. Finally, a two-proportion z-test is used to compare the proportion of cancelled flights between carriers AA and OO, concluding that there is no significant difference between the two. Stacked bar charts are used to visualize the relationship between flight cancellations and carriers. The entire analysis is performed using StatCrunch.

Statistics
Name:
Institution:
28th May 2018
Name:
Institution:
28th May 2018
Paraphrase This Document
Need a fresh take? Get an instant paraphrase of this document with our AI Paraphraser

Here is the list of variables and their descriptions:
a. DAY_OF_MONTH – This is the day of the month (numbers)
b. DAY_OF_WEEK - This is the day of the Week (numbers)
c. FL_DATE - The flight date (mm/dd/year)
d. CARRIER - The name of the carrier (i.e. AA, AS, B6, DL etc)
e. FL_NUM - The flight number (numbers)
f. ORIGIN_AIRPORT_ID - unique ID of the Airport where the flight originates from.
g. DEST_AIRPORT_ID - unique ID of the Airport where the flight is destined to.
h. DEP_DELAY – Departure delay time
i. ARR_TIME – Arrival time (hhmm)
j. ARR_DELAY – Arrival delay time
k. CANCELLED – whether the flight was cancelled or not (1 = cancelled, 0 = not
cancelled)
l. AIR_TIME – Time period when the plane was on air
m. DISTANCE – Distance travelled by the plan during the flight
Section I: Understanding the Data
DAY_OF_MONTH Categorical
DAY_OF_WEEK Categorical
FL_DATE Categorical
CARRIER Categorical
FL_NUM Categorical
ORIGIN_AIRPORT_I
D
Categorical
DEST_AIRPORT_ID Categorical
DEP_DELAY Quantitative
ARR_TIME Categorical
ARR_DELAY Quantitative
CANCELLED Categorical

AIR_TIME Quantitative
DISTANCE Quantitative
Section II: What is Statistics for?
Procedure Question
1 Proportion Z
Interval
What proportion of flights get cancelled?
1 Proportion Z
Test
Is the proportion of cancelled flights is higher than 1%?
1 Sample T Test Is the average time on air greater than 100?
T Test for the
Slope
Is there a correlation between departure delay and
arrival delay?
1 Sample T
Interval
Estimate the average distance travelled during the
flight
2 Proportion Z
Test
Is there a difference in the proportion of cancelled for
carrier AA and carrier OO?
2 Sample T Test Do AS carrier flights take longer time than the NK
carrier flights?
Chi Square Test Chi-Square Test for Independence. Is there an
association between the carrier and the flight
cancellation?
Section III: Doing the Statistics
Question: Is the proportion of cancelled flights is higher than 1%?
Step 1: Hypotheses.
We let p be the proportion of all cancelled flights.
H0 : P=0.01
H A : P>0.01
Step 2: Gather Data.
The data is already given and is available on statcrunch.
Step 3: Determine the method/distribution and verify the conditions.
⊘ This is a preview!⊘
Do you want full access?
Subscribe today to unlock all pages.

Trusted by 1+ million students worldwide

This task will require performing a 1 proportion z test.
With a sample size of n = 5000, we find that there are np=5000(0.01)=50>10 expected
successes and nq=5000(0.99)=224.2> 4950 expect failures. Since both values are greater than
10, we can assume an approximately normal distribution of our sample proportion. Further, 5000
< 1% of all possible flights, allowing us to assume independence. This does not appear to be
random sample, so our conclusion may not be valid for the entire population.
Step 4: Perform the calculations for the test
One sample proportion hypothesis test:
Outcomes in: Cancelled flights
Success: Yes
p: Proportion of successes
H0 : P=0.01
H A : P>0.01
Inputs
Sample Proportion 0.015
Sample size 5000
Population proportion 0.01
Significance level 0.05
1- or 2-tailed test 1-tailed
Results
Sample proportion 0.015
Paraphrase This Document
Need a fresh take? Get an instant paraphrase of this document with our AI Paraphraser

95% CI (asymptotic) 0.0122 - 0.0178
z-value 3.6
P-value 0.0002
Interpretation Statistically significant,
reject null hypothesis that population proportion = 0.01
n by pi n * pi >5, test ok
Step 5: Interpret the p-value and write a conclusion.
Since the p-value is less than 0.05, we reject the null hypothesis. There is sufficient evidence to
show that the proportion of cancelled flights is higher than 1%.
Step IV: A Picture is Worth 1000 Words
Question: Is there an association between the carrier and the flight cancellation?
I used a segmented (stacked) bar chart to show the relationship between the carrier flight and
whether the flight was cancelled. In the chart, we see that there is no visible differences in terms

of the proportions of cancelled flights based on the carrier. However, we see that F9 had slightly
larger proportion of cancelled flights than any other carrier.
In the next section, we performed a Chi-Square test of association to determine whether there is
indeed a significant association between the carrier and the flight cancellation.
The hypothesis tested is as follows;
H0: There is no association between carrier and flight cancellation
HA: There is significant association between carrier and flight cancellation
Carrier * Cancelled Cross tabulation
Count
Cancelled Total
No Yes
Carrier
AA 767 11 778
AS 152 1 153
B6 281 2 283
DL 798 11 809
EV 377 6 383
F9 86 4 90
HA 63 0 63
NK 136 3 139
OO 531 14 545
UA 479 2 481
VX 57 1 58
WN 1198 20 1218
Total 4925 75 5000
As can be seen from the Chi-Square table presented below, the p-value for Pearson Chi-Square
test is 0.108 (a value greater than 5% level of significance), we therefore fail to reject the null
hypothesis and conclude that there is no evidence to say that carrier type is associated with flight
⊘ This is a preview!⊘
Do you want full access?
Subscribe today to unlock all pages.

Trusted by 1+ million students worldwide

cancellation. That is, there is no particular carrier that has a significantly higher proportion of
flight cancellation than the other.
Chi-Square Tests
Value df Asymp. Sig. (2-
sided)
Pearson Chi-Square 16.980a 11 .108
Likelihood Ratio 17.345 11 .098
N of Valid Cases 5000
a. 6 cells (25.0%) have expected count less than 5. The minimum
expected count is .87.
Question: Is there a difference in the proportion of cancelled for carrier AA and carrier OO?
Step 1: Hypotheses.
We let p1 be the proportion of all cancelled flights for carrier AA and p2 be the proportion of all
cancelled flights for carrier OO.
H0 : P1=P2
H A : P1 ≠ P2
Step 2: Gather Data.
The data is already given and is available on statcrunch.
Step 3: Determine the method/distribution and verify the conditions.
This task will require performing a 2 Proportion Z Test.
With a sample size of n = 5000, we find that there are np=5000(0.01)=50>10 expected
successes and nq=5000(0.99)=224.2> 4950 expect failures. Since both values are greater than
Paraphrase This Document
Need a fresh take? Get an instant paraphrase of this document with our AI Paraphraser

10, we can assume an approximately normal distribution of our sample proportion. Further, 5000
< 1% of all possible flights, allowing us to assume independence. This does not appear to be
random sample, so our conclusion may not be valid for the entire population.
Step 4: Perform the calculations for the test
Two sample proportion hypothesis test:
Outcomes in: Cancelled flights
Success: Yes
Hypothesis:
H0 : P1=P2
H A : P1 ≠ P2
z-test to compare two proportion
Analysed: Mon May 28, 2018 @ 20:45
Inputs
Sample 1 Sample 2
Sample Proportion 0.0141 0.0259
Sample size 778 545
Significance level 0.05
1- or 2-tailed test 2-tailed
Results

Sample 1 Sample 2 Difference
Sample proportion 0.0141 0.0259 0.0118
95% CI (asymptotic) 0.0058 - 0.0224 0.0126 - 0.0392 -0.0031 - 0.0267
z-value 1.5
P-value 0.1214
Interpretation
Not significant,
accept null hypothesis that
sample proportions are equal
n by pi n * pi >5, test ok
Step 5: Interpret the p-value and write a conclusion.
Since the p-value is greater than 0.05, we fail to reject the null hypothesis. There is no sufficient
evidence to show that the proportion of cancelled for carrier AA and carrier OO.
⊘ This is a preview!⊘
Do you want full access?
Subscribe today to unlock all pages.

Trusted by 1+ million students worldwide
1 out of 9
Related Documents
Your All-in-One AI-Powered Toolkit for Academic Success.
+13062052269
info@desklib.com
Available 24*7 on WhatsApp / Email
Unlock your academic potential
Copyright © 2020–2025 A2Z Services. All Rights Reserved. Developed and managed by ZUCOL.


