Flight Centre Valuation Project: Comprehensive Financial Analysis
VerifiedAdded on 2021/01/01
|19
|4456
|121
Project
AI Summary
This project provides a comprehensive financial analysis and valuation of Flight Centre Travel Group Limited over a five-year period. The analysis includes an overview of financial performance, peer group comparisons, and an examination of current issues and their impact on future earnings. The project utilizes profitability, liquidity, and solvency ratio analyses to assess the company's financial health. A DuPont analysis is employed to estimate the Return on Equity (ROE), and a regression analysis is conducted to estimate and adjust beta for risk assessment. The Capital Asset Pricing Model (CAPM) is used to estimate the cost of equity for stock valuation. Furthermore, the project evaluates the intrinsic value of the company against its current share price using the Dividend Discount Model (DDM) to make informed investment decisions. SWOT and PEST analyses are also used to provide a holistic view of the company's position.

COMPANY VALUATION project
MASTERS
MASTERS
Paraphrase This Document
Need a fresh take? Get an instant paraphrase of this document with our AI Paraphraser
TABLE OF CONTENTS
INTRODUCTION...........................................................................................................................3
Overview of financial performance of five year....................................................................3
2. Peer group comparison.......................................................................................................6
3. Analysing the present issues with their impact of future earnings.....................................8
4. Estimating ROE of company for past 5 years with DuPont ROE approach....................11
Comparison of financial performance from Dupont approach.............................................12
PART 2..........................................................................................................................................12
2.a.........................................................................................................................................12
2.b.........................................................................................................................................13
3. Evaluation of value or price of organization....................................................................14
3.a Is Intrinsic value is differing from current share price?.................................................14
3.b Presenting that dividend discount model is appropriate or not......................................14
3.c Investment decision on basis of above evaluation of stock price...................................16
CONCLUSION..............................................................................................................................16
REFERENCES..............................................................................................................................17
INTRODUCTION
Company valuation is replicated as process of identifying economic value of a specific
business or organization. It could be also used for determining fair value of business entity for
numerous variety of reasons which consist of sale value and to establish partner ownership along
with proceeding of divorce. The present report will discuss about overall valuation of Flight
Ceneter travel group limited of past 5 years with context of public announcement as well. In the
similar aspect, it will perform peer to peer comparison and analysis as micro and macro level.
This report will state return on equity with DuPont analysis with appropriate demonstration.
Further, it will be conducting regression for estimating beta and to adjust it for mitigating issue
of stability. With context of beta, it will estimate return through CAPM as cost of equity in
model of stock valuation. It will evaluate comparison from intrinsic and actual share price with
context of dividend discount model.
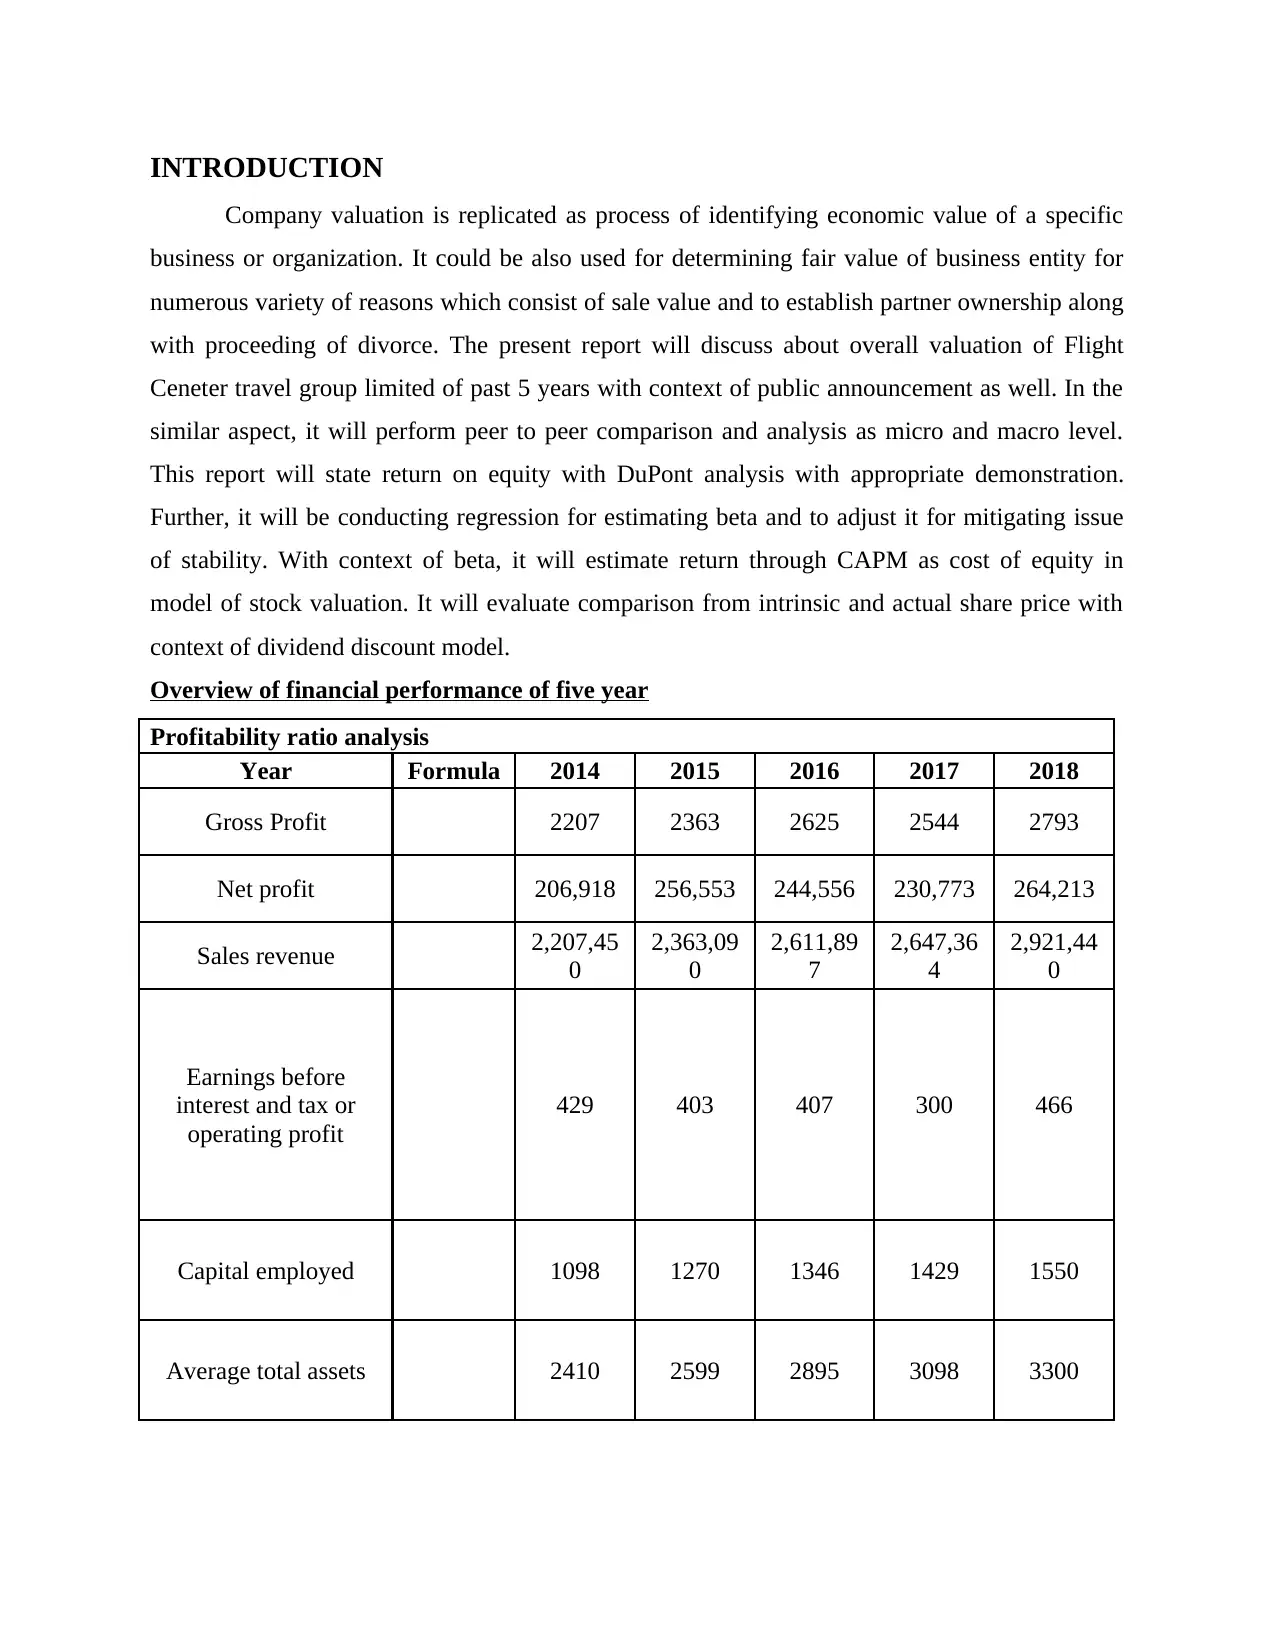
Overview of financial performance of five year
Profitability ratio analysis
Year Formula 2014 2015 2016 2017 2018
Gross Profit 2207 2363 2625 2544 2793
Net profit 206,918 256,553 244,556 230,773 264,213
Sales revenue 2,207,45
0
2,363,09
0
2,611,89
7
2,647,36
4
2,921,44
0
Earnings before
interest and tax or
operating profit
429 403 407 300 466
Capital employed 1098 1270 1346 1429 1550
Average total assets 2410 2599 2895 3098 3300
Company valuation is replicated as process of identifying economic value of a specific
business or organization. It could be also used for determining fair value of business entity for
numerous variety of reasons which consist of sale value and to establish partner ownership along
with proceeding of divorce. The present report will discuss about overall valuation of Flight
Ceneter travel group limited of past 5 years with context of public announcement as well. In the
similar aspect, it will perform peer to peer comparison and analysis as micro and macro level.
This report will state return on equity with DuPont analysis with appropriate demonstration.
Further, it will be conducting regression for estimating beta and to adjust it for mitigating issue
of stability. With context of beta, it will estimate return through CAPM as cost of equity in
model of stock valuation. It will evaluate comparison from intrinsic and actual share price with
context of dividend discount model.
Overview of financial performance of five year
Profitability ratio analysis
Year Formula 2014 2015 2016 2017 2018
Gross Profit 2207 2363 2625 2544 2793
Net profit 206,918 256,553 244,556 230,773 264,213
Sales revenue 2,207,45
0
2,363,09
0
2,611,89
7
2,647,36
4
2,921,44
0
Earnings before
interest and tax or
operating profit
429 403 407 300 466
Capital employed 1098 1270 1346 1429 1550
Average total assets 2410 2599 2895 3098 3300
⊘ This is a preview!⊘
Do you want full access?
Subscribe today to unlock all pages.
Trusted by 1+ million students worldwide
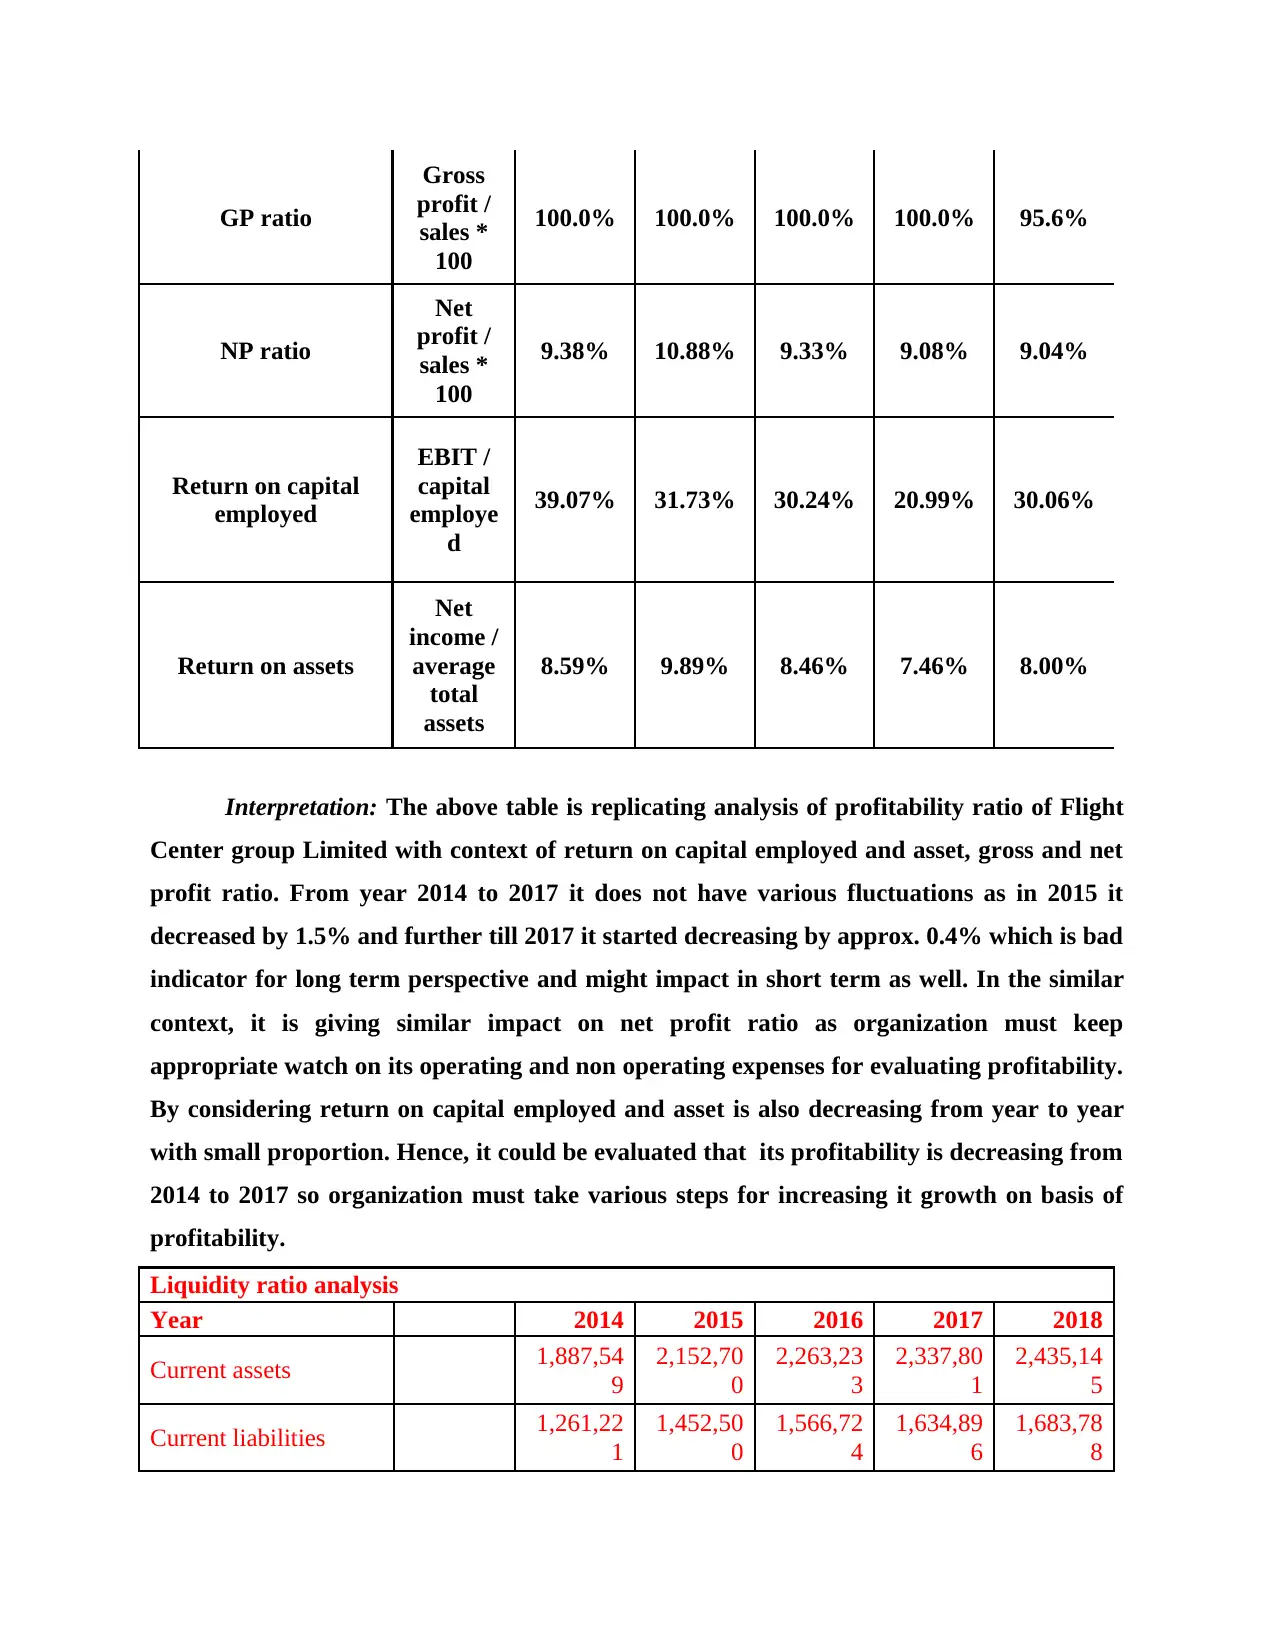
GP ratio
Gross
profit /
sales *
100
100.0% 100.0% 100.0% 100.0% 95.6%
NP ratio
Net
profit /
sales *
100
9.38% 10.88% 9.33% 9.08% 9.04%
Return on capital
employed
EBIT /
capital
employe
d
39.07% 31.73% 30.24% 20.99% 30.06%
Return on assets
Net
income /
average
total
assets
8.59% 9.89% 8.46% 7.46% 8.00%
Interpretation: The above table is replicating analysis of profitability ratio of Flight
Center group Limited with context of return on capital employed and asset, gross and net
profit ratio. From year 2014 to 2017 it does not have various fluctuations as in 2015 it
decreased by 1.5% and further till 2017 it started decreasing by approx. 0.4% which is bad
indicator for long term perspective and might impact in short term as well. In the similar
context, it is giving similar impact on net profit ratio as organization must keep
appropriate watch on its operating and non operating expenses for evaluating profitability.
By considering return on capital employed and asset is also decreasing from year to year
with small proportion. Hence, it could be evaluated that its profitability is decreasing from
2014 to 2017 so organization must take various steps for increasing it growth on basis of
profitability.
Liquidity ratio analysis
Year 2014 2015 2016 2017 2018
Current assets 1,887,54
9
2,152,70
0
2,263,23
3
2,337,80
1
2,435,14
5
Current liabilities 1,261,22
1
1,452,50
0
1,566,72
4
1,634,89
6
1,683,78
8
Paraphrase This Document
Need a fresh take? Get an instant paraphrase of this document with our AI Paraphraser
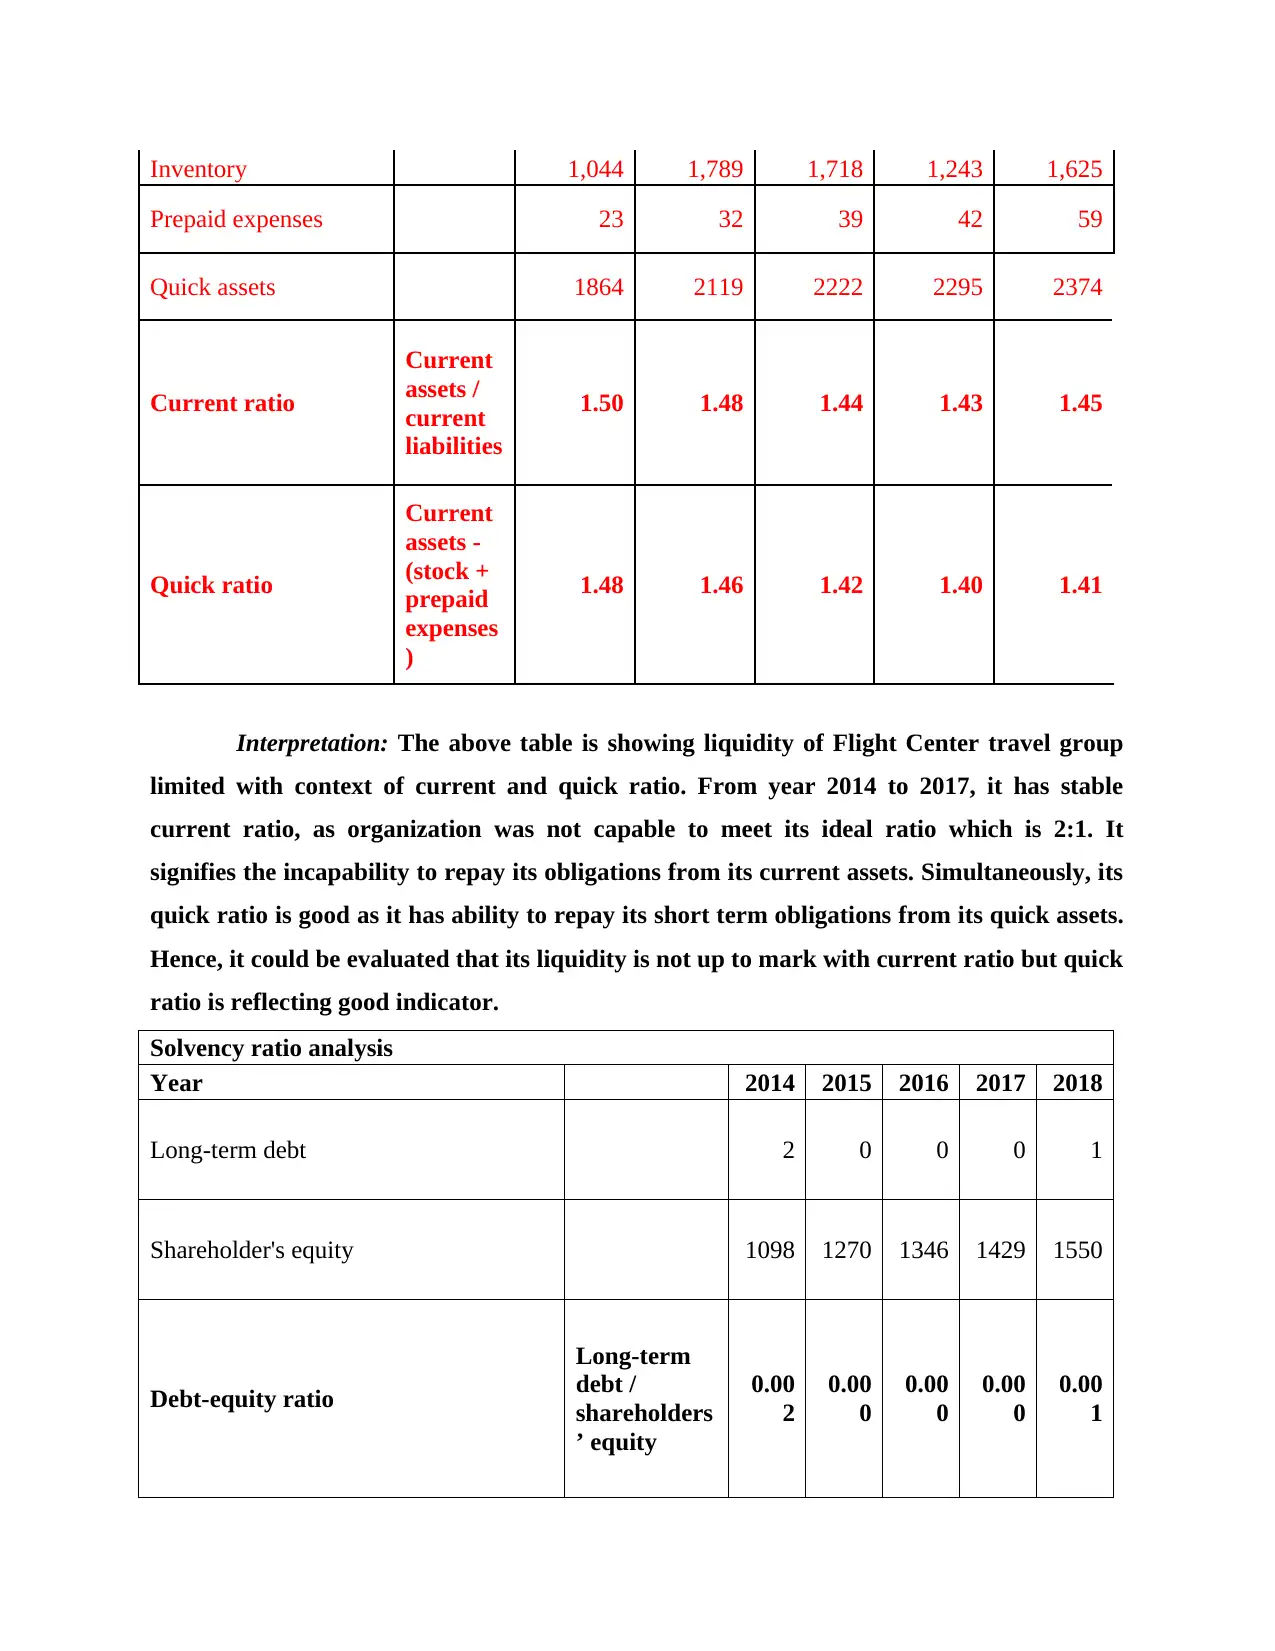
Inventory 1,044 1,789 1,718 1,243 1,625
Prepaid expenses 23 32 39 42 59
Quick assets 1864 2119 2222 2295 2374
Current ratio
Current
assets /
current
liabilities
1.50 1.48 1.44 1.43 1.45
Quick ratio
Current
assets -
(stock +
prepaid
expenses
)
1.48 1.46 1.42 1.40 1.41
Interpretation: The above table is showing liquidity of Flight Center travel group
limited with context of current and quick ratio. From year 2014 to 2017, it has stable
current ratio, as organization was not capable to meet its ideal ratio which is 2:1. It
signifies the incapability to repay its obligations from its current assets. Simultaneously, its
quick ratio is good as it has ability to repay its short term obligations from its quick assets.
Hence, it could be evaluated that its liquidity is not up to mark with current ratio but quick
ratio is reflecting good indicator.
Solvency ratio analysis
Year 2014 2015 2016 2017 2018
Long-term debt 2 0 0 0 1
Shareholder's equity 1098 1270 1346 1429 1550
Debt-equity ratio
Long-term
debt /
shareholders
’ equity
0.00
2
0.00
0
0.00
0
0.00
0
0.00
1
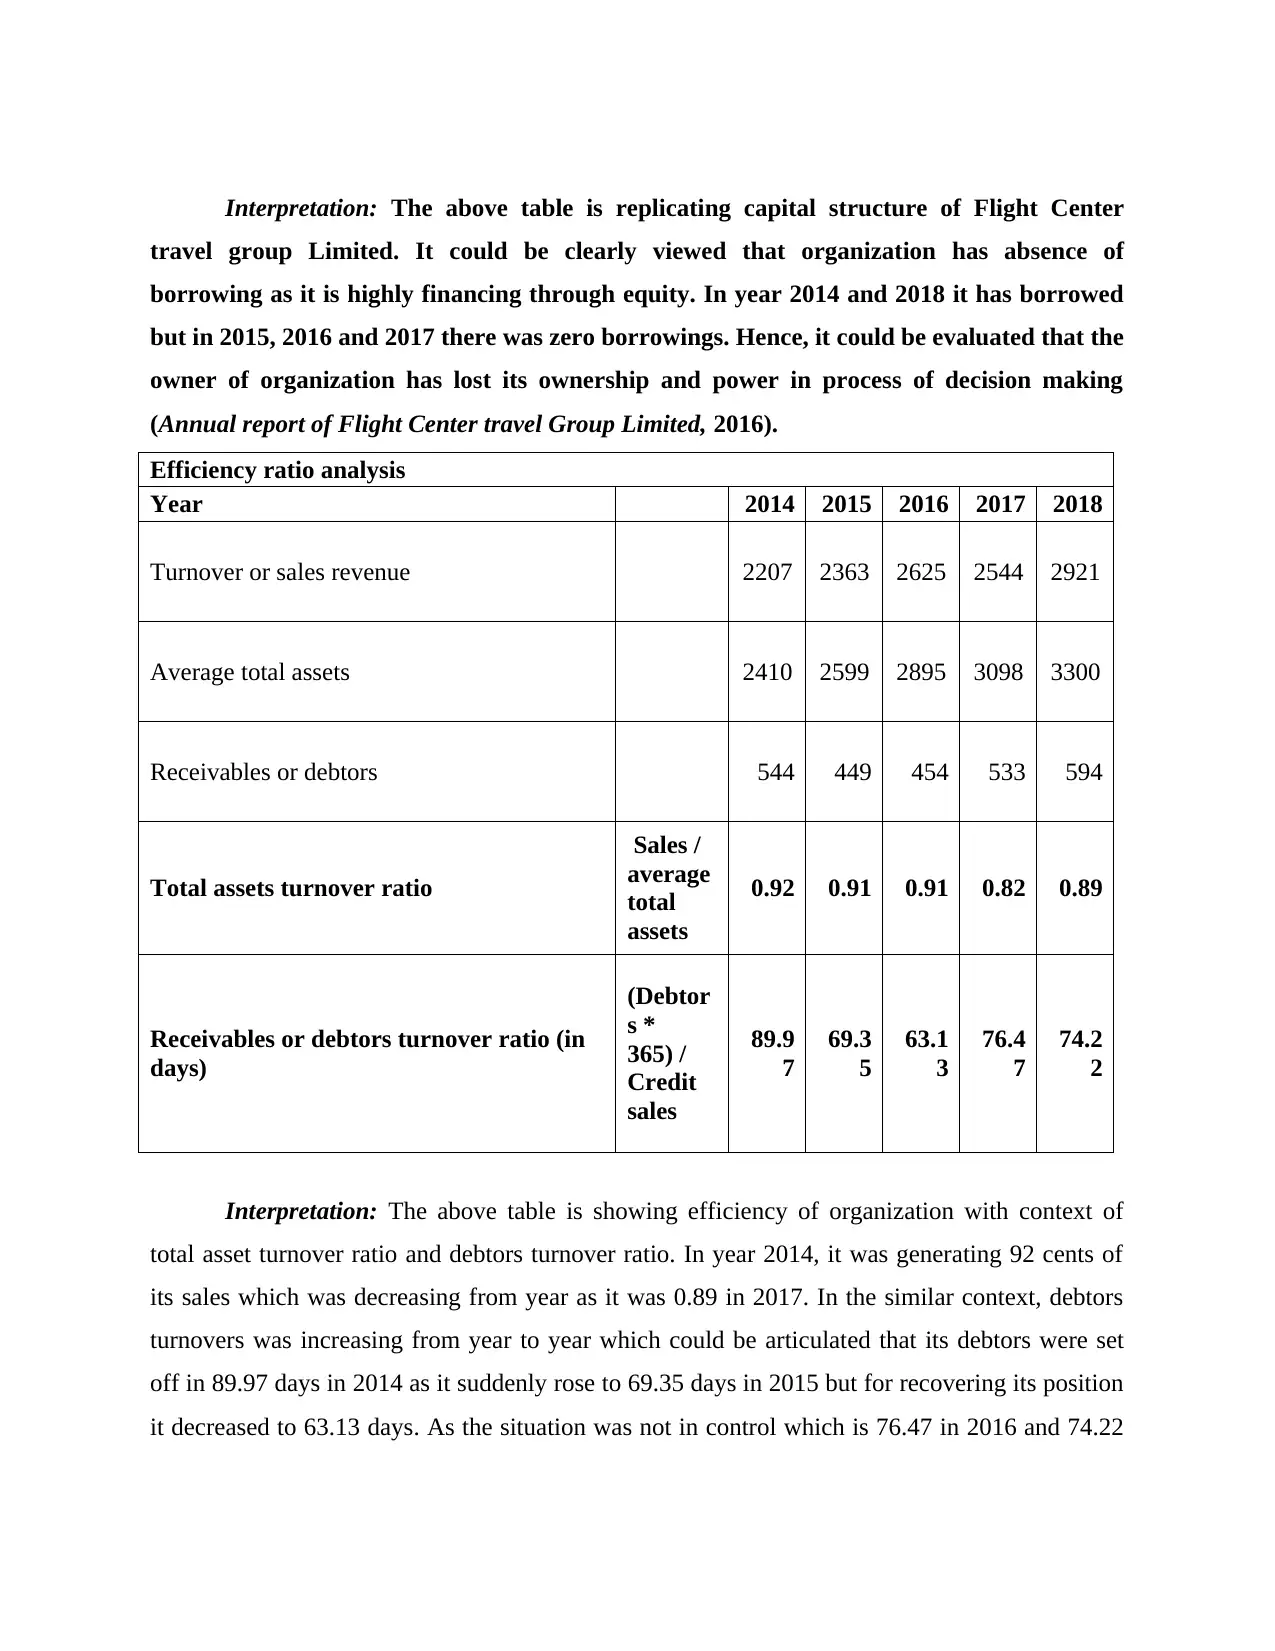
Interpretation: The above table is replicating capital structure of Flight Center
travel group Limited. It could be clearly viewed that organization has absence of
borrowing as it is highly financing through equity. In year 2014 and 2018 it has borrowed
but in 2015, 2016 and 2017 there was zero borrowings. Hence, it could be evaluated that the
owner of organization has lost its ownership and power in process of decision making
(Annual report of Flight Center travel Group Limited, 2016).
Efficiency ratio analysis
Year 2014 2015 2016 2017 2018
Turnover or sales revenue 2207 2363 2625 2544 2921
Average total assets 2410 2599 2895 3098 3300
Receivables or debtors 544 449 454 533 594
Total assets turnover ratio
Sales /
average
total
assets
0.92 0.91 0.91 0.82 0.89
Receivables or debtors turnover ratio (in
days)
(Debtor
s *
365) /
Credit
sales
89.9
7
69.3
5
63.1
3
76.4
7
74.2
2
Interpretation: The above table is showing efficiency of organization with context of
total asset turnover ratio and debtors turnover ratio. In year 2014, it was generating 92 cents of
its sales which was decreasing from year as it was 0.89 in 2017. In the similar context, debtors
turnovers was increasing from year to year which could be articulated that its debtors were set
off in 89.97 days in 2014 as it suddenly rose to 69.35 days in 2015 but for recovering its position
it decreased to 63.13 days. As the situation was not in control which is 76.47 in 2016 and 74.22
⊘ This is a preview!⊘
Do you want full access?
Subscribe today to unlock all pages.
Trusted by 1+ million students worldwide
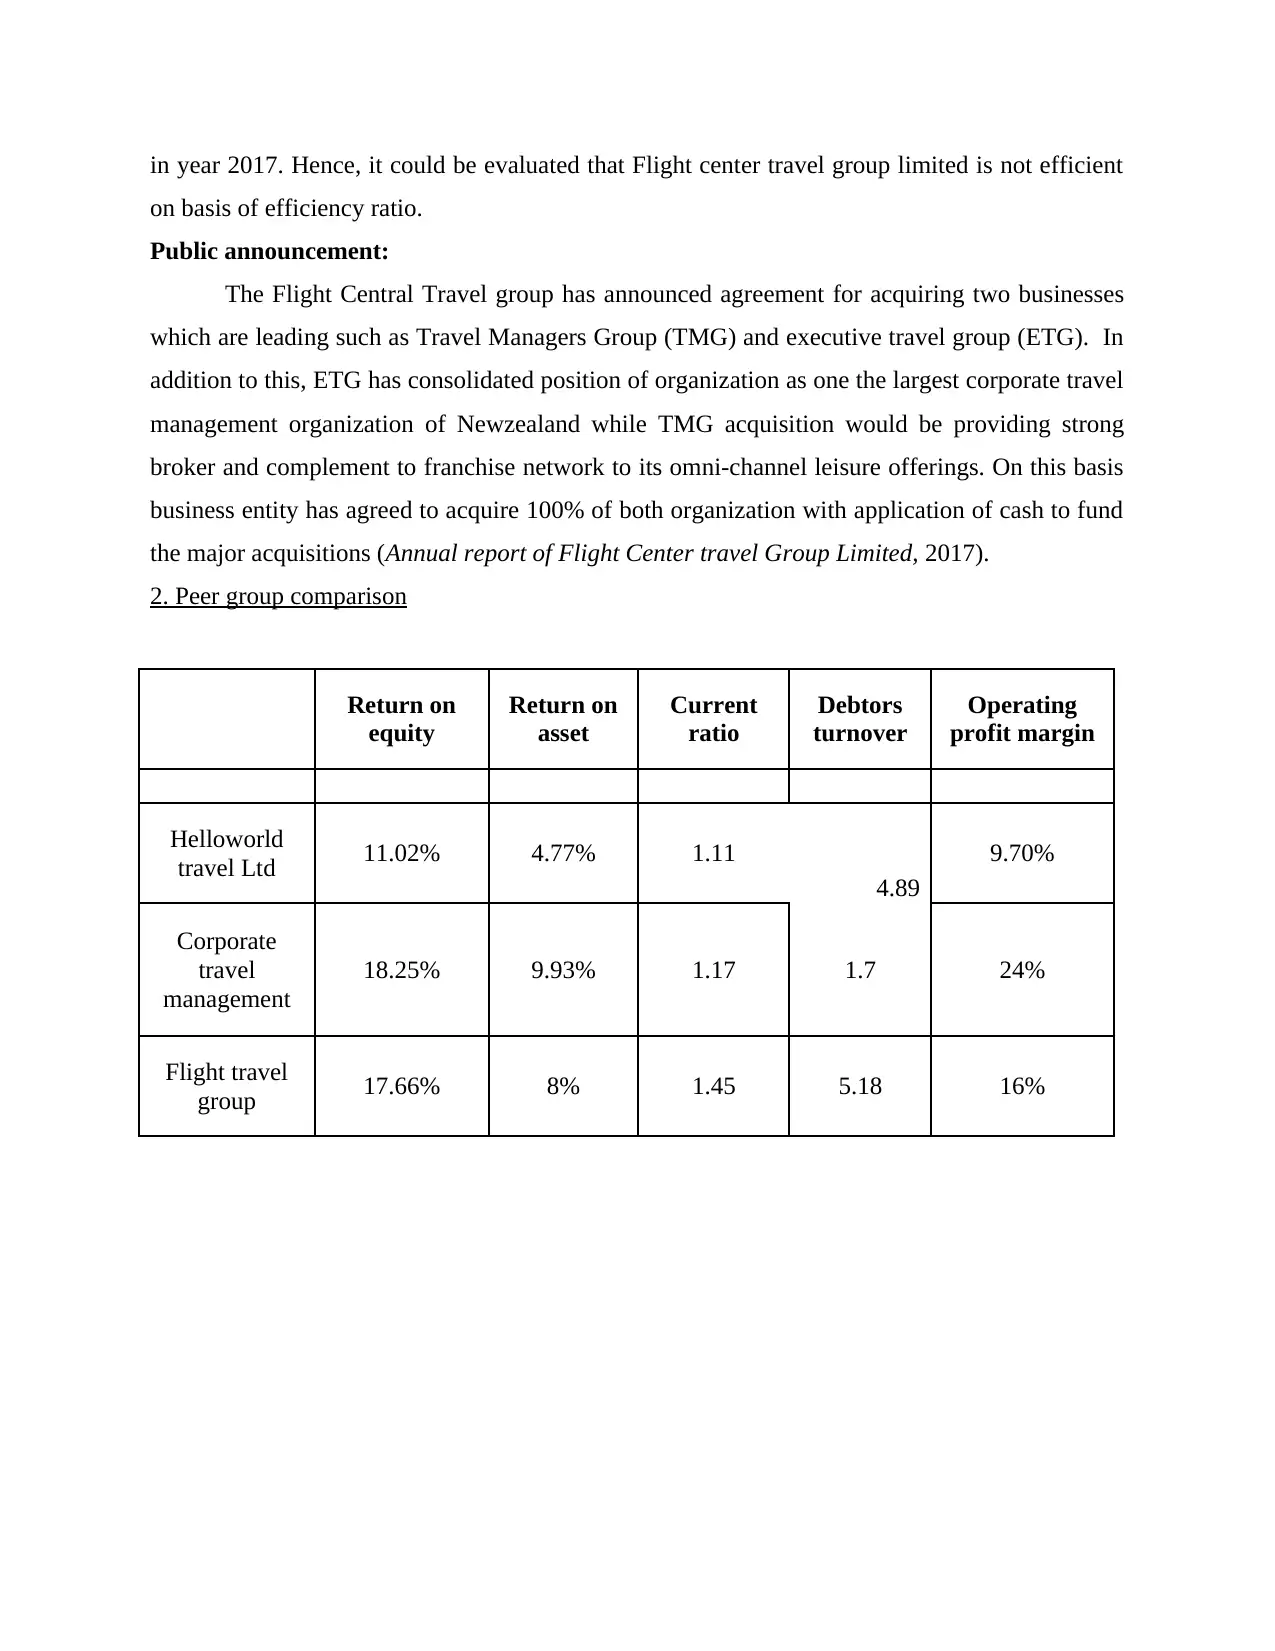
in year 2017. Hence, it could be evaluated that Flight center travel group limited is not efficient
on basis of efficiency ratio.
Public announcement:
The Flight Central Travel group has announced agreement for acquiring two businesses
which are leading such as Travel Managers Group (TMG) and executive travel group (ETG). In
addition to this, ETG has consolidated position of organization as one the largest corporate travel
management organization of Newzealand while TMG acquisition would be providing strong
broker and complement to franchise network to its omni-channel leisure offerings. On this basis
business entity has agreed to acquire 100% of both organization with application of cash to fund
the major acquisitions (Annual report of Flight Center travel Group Limited, 2017).
2. Peer group comparison
Return on
equity
Return on
asset
Current
ratio
Debtors
turnover
Operating
profit margin
Helloworld
travel Ltd 11.02% 4.77% 1.11
4.89
9.70%
Corporate
travel
management
18.25% 9.93% 1.17 1.7 24%
Flight travel
group 17.66% 8% 1.45 5.18 16%
Paraphrase This Document
Need a fresh take? Get an instant paraphrase of this document with our AI Paraphraser
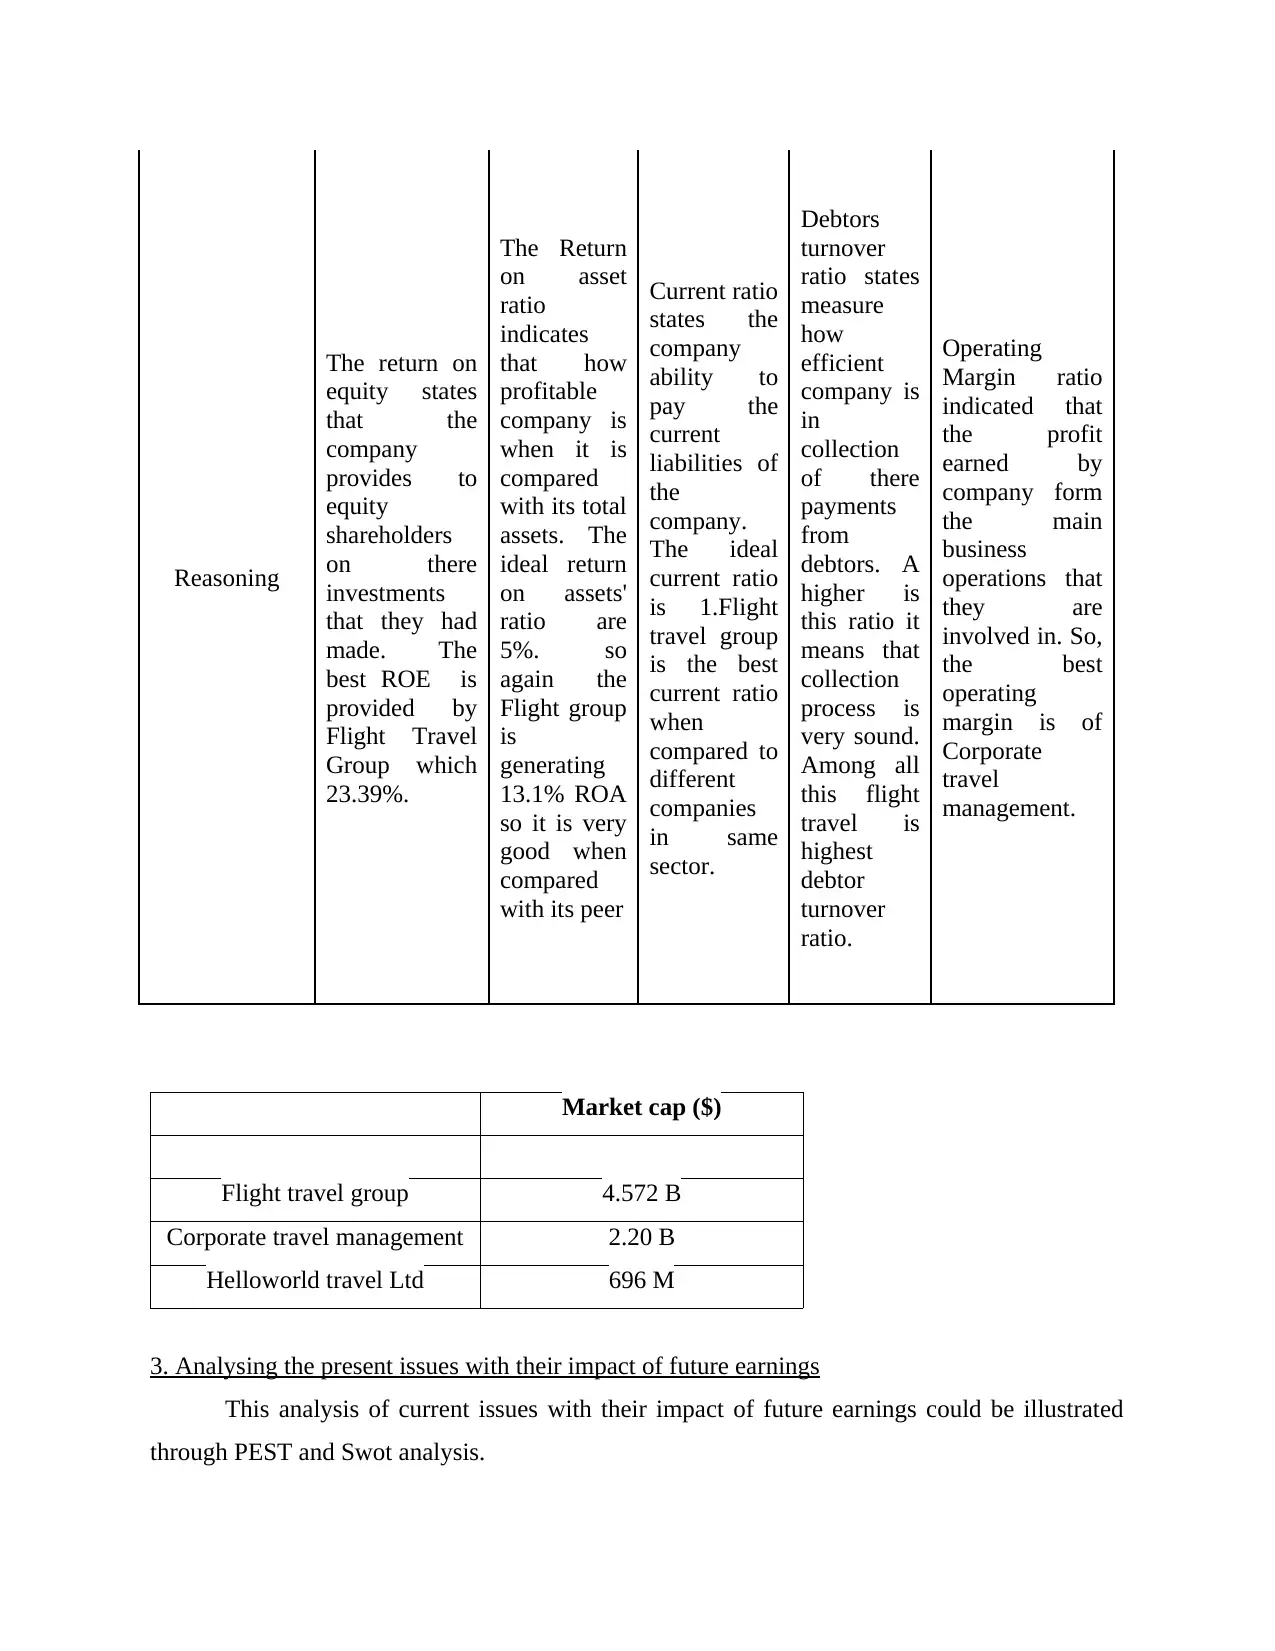
Reasoning
The return on
equity states
that the
company
provides to
equity
shareholders
on there
investments
that they had
made. The
best ROE is
provided by
Flight Travel
Group which
23.39%.
The Return
on asset
ratio
indicates
that how
profitable
company is
when it is
compared
with its total
assets. The
ideal return
on assets'
ratio are
5%. so
again the
Flight group
is
generating
13.1% ROA
so it is very
good when
compared
with its peer
Current ratio
states the
company
ability to
pay the
current
liabilities of
the
company.
The ideal
current ratio
is 1.Flight
travel group
is the best
current ratio
when
compared to
different
companies
in same
sector.
Debtors
turnover
ratio states
measure
how
efficient
company is
in
collection
of there
payments
from
debtors. A
higher is
this ratio it
means that
collection
process is
very sound.
Among all
this flight
travel is
highest
debtor
turnover
ratio.
Operating
Margin ratio
indicated that
the profit
earned by
company form
the main
business
operations that
they are
involved in. So,
the best
operating
margin is of
Corporate
travel
management.
Market cap ($)
Flight travel group 4.572 B
Corporate travel management 2.20 B
Helloworld travel Ltd 696 M
3. Analysing the present issues with their impact of future earnings
This analysis of current issues with their impact of future earnings could be illustrated
through PEST and Swot analysis.
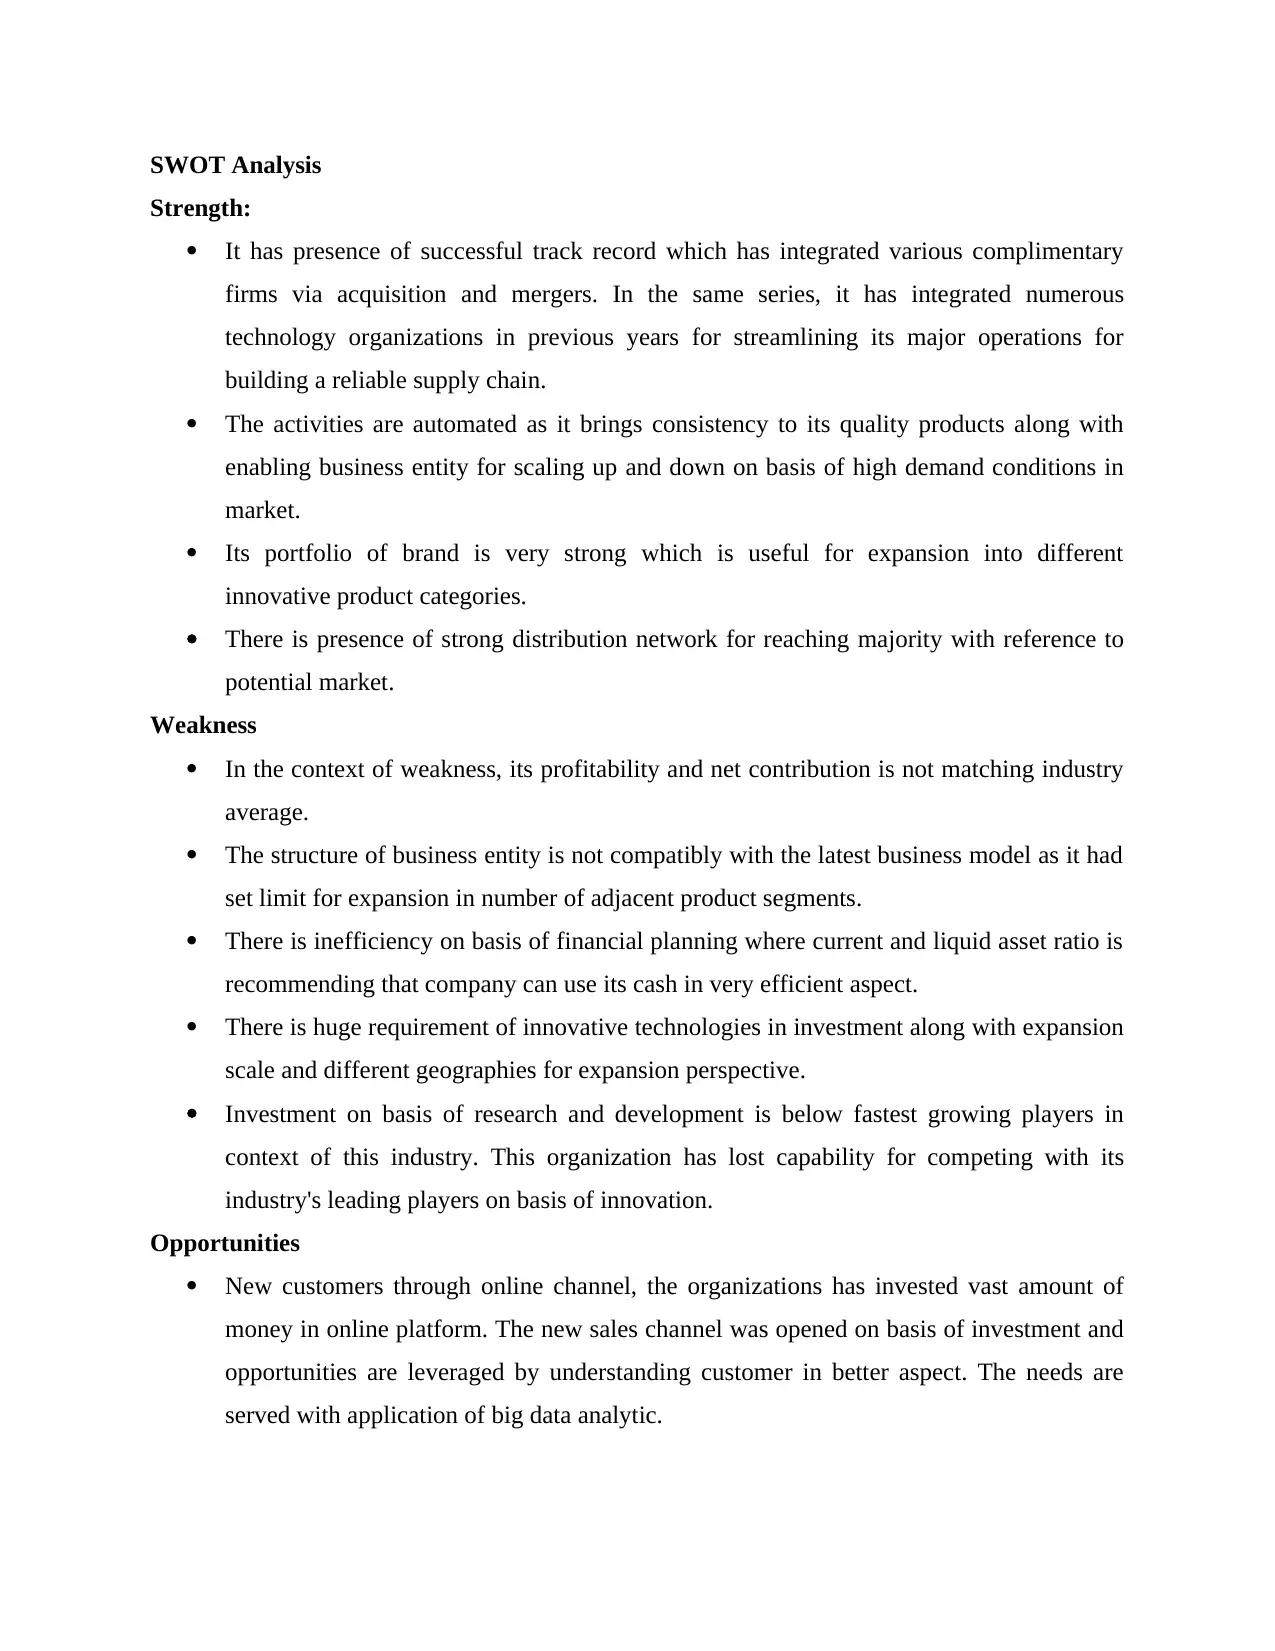
SWOT Analysis
Strength:
It has presence of successful track record which has integrated various complimentary
firms via acquisition and mergers. In the same series, it has integrated numerous
technology organizations in previous years for streamlining its major operations for
building a reliable supply chain.
The activities are automated as it brings consistency to its quality products along with
enabling business entity for scaling up and down on basis of high demand conditions in
market.
Its portfolio of brand is very strong which is useful for expansion into different
innovative product categories.
There is presence of strong distribution network for reaching majority with reference to
potential market.
Weakness
In the context of weakness, its profitability and net contribution is not matching industry
average.
The structure of business entity is not compatibly with the latest business model as it had
set limit for expansion in number of adjacent product segments.
There is inefficiency on basis of financial planning where current and liquid asset ratio is
recommending that company can use its cash in very efficient aspect.
There is huge requirement of innovative technologies in investment along with expansion
scale and different geographies for expansion perspective.
Investment on basis of research and development is below fastest growing players in
context of this industry. This organization has lost capability for competing with its
industry's leading players on basis of innovation.
Opportunities
New customers through online channel, the organizations has invested vast amount of
money in online platform. The new sales channel was opened on basis of investment and
opportunities are leveraged by understanding customer in better aspect. The needs are
served with application of big data analytic.
⊘ This is a preview!⊘
Do you want full access?
Subscribe today to unlock all pages.
Trusted by 1+ million students worldwide
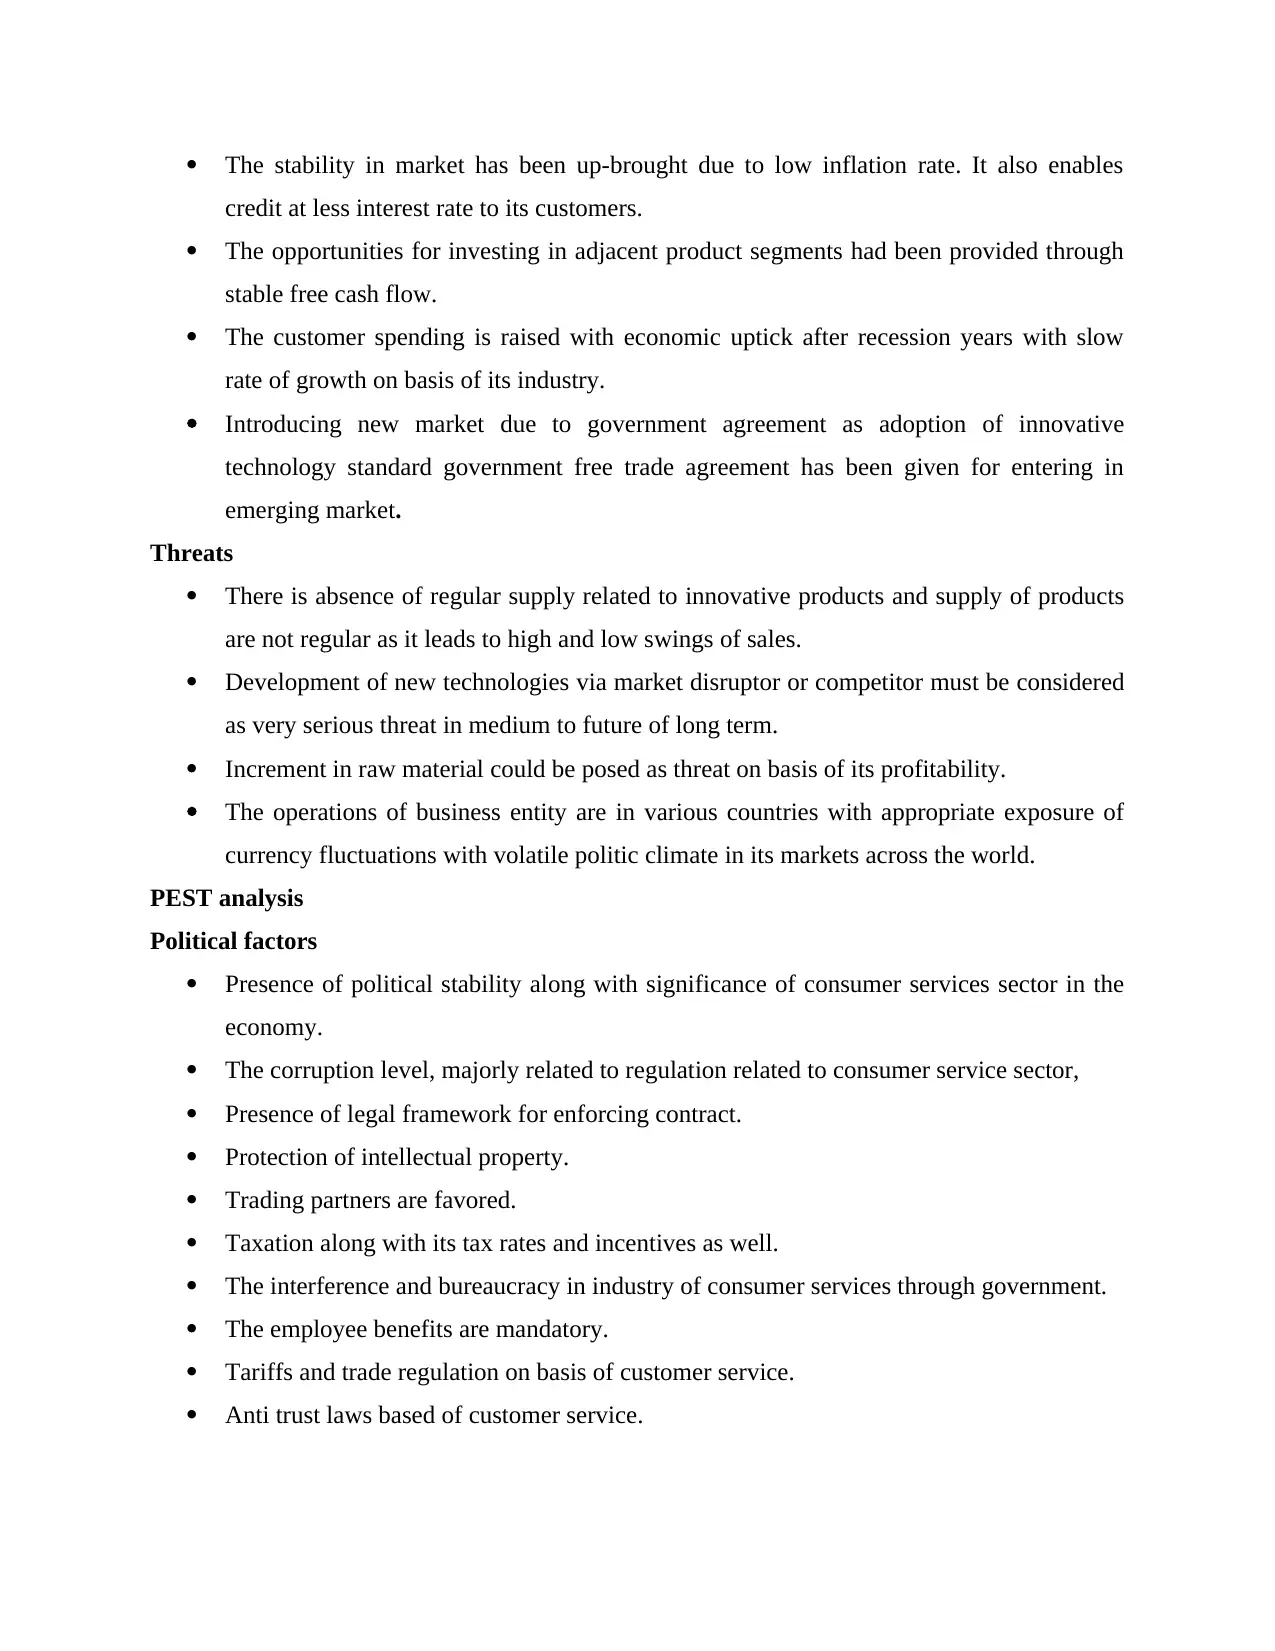
The stability in market has been up-brought due to low inflation rate. It also enables
credit at less interest rate to its customers.
The opportunities for investing in adjacent product segments had been provided through
stable free cash flow.
The customer spending is raised with economic uptick after recession years with slow
rate of growth on basis of its industry.
Introducing new market due to government agreement as adoption of innovative
technology standard government free trade agreement has been given for entering in
emerging market.
Threats
There is absence of regular supply related to innovative products and supply of products
are not regular as it leads to high and low swings of sales.
Development of new technologies via market disruptor or competitor must be considered
as very serious threat in medium to future of long term.
Increment in raw material could be posed as threat on basis of its profitability.
The operations of business entity are in various countries with appropriate exposure of
currency fluctuations with volatile politic climate in its markets across the world.
PEST analysis
Political factors
Presence of political stability along with significance of consumer services sector in the
economy.
The corruption level, majorly related to regulation related to consumer service sector,
Presence of legal framework for enforcing contract.
Protection of intellectual property.
Trading partners are favored.
Taxation along with its tax rates and incentives as well.
The interference and bureaucracy in industry of consumer services through government.
The employee benefits are mandatory.
Tariffs and trade regulation on basis of customer service.
Anti trust laws based of customer service.
Paraphrase This Document
Need a fresh take? Get an instant paraphrase of this document with our AI Paraphraser
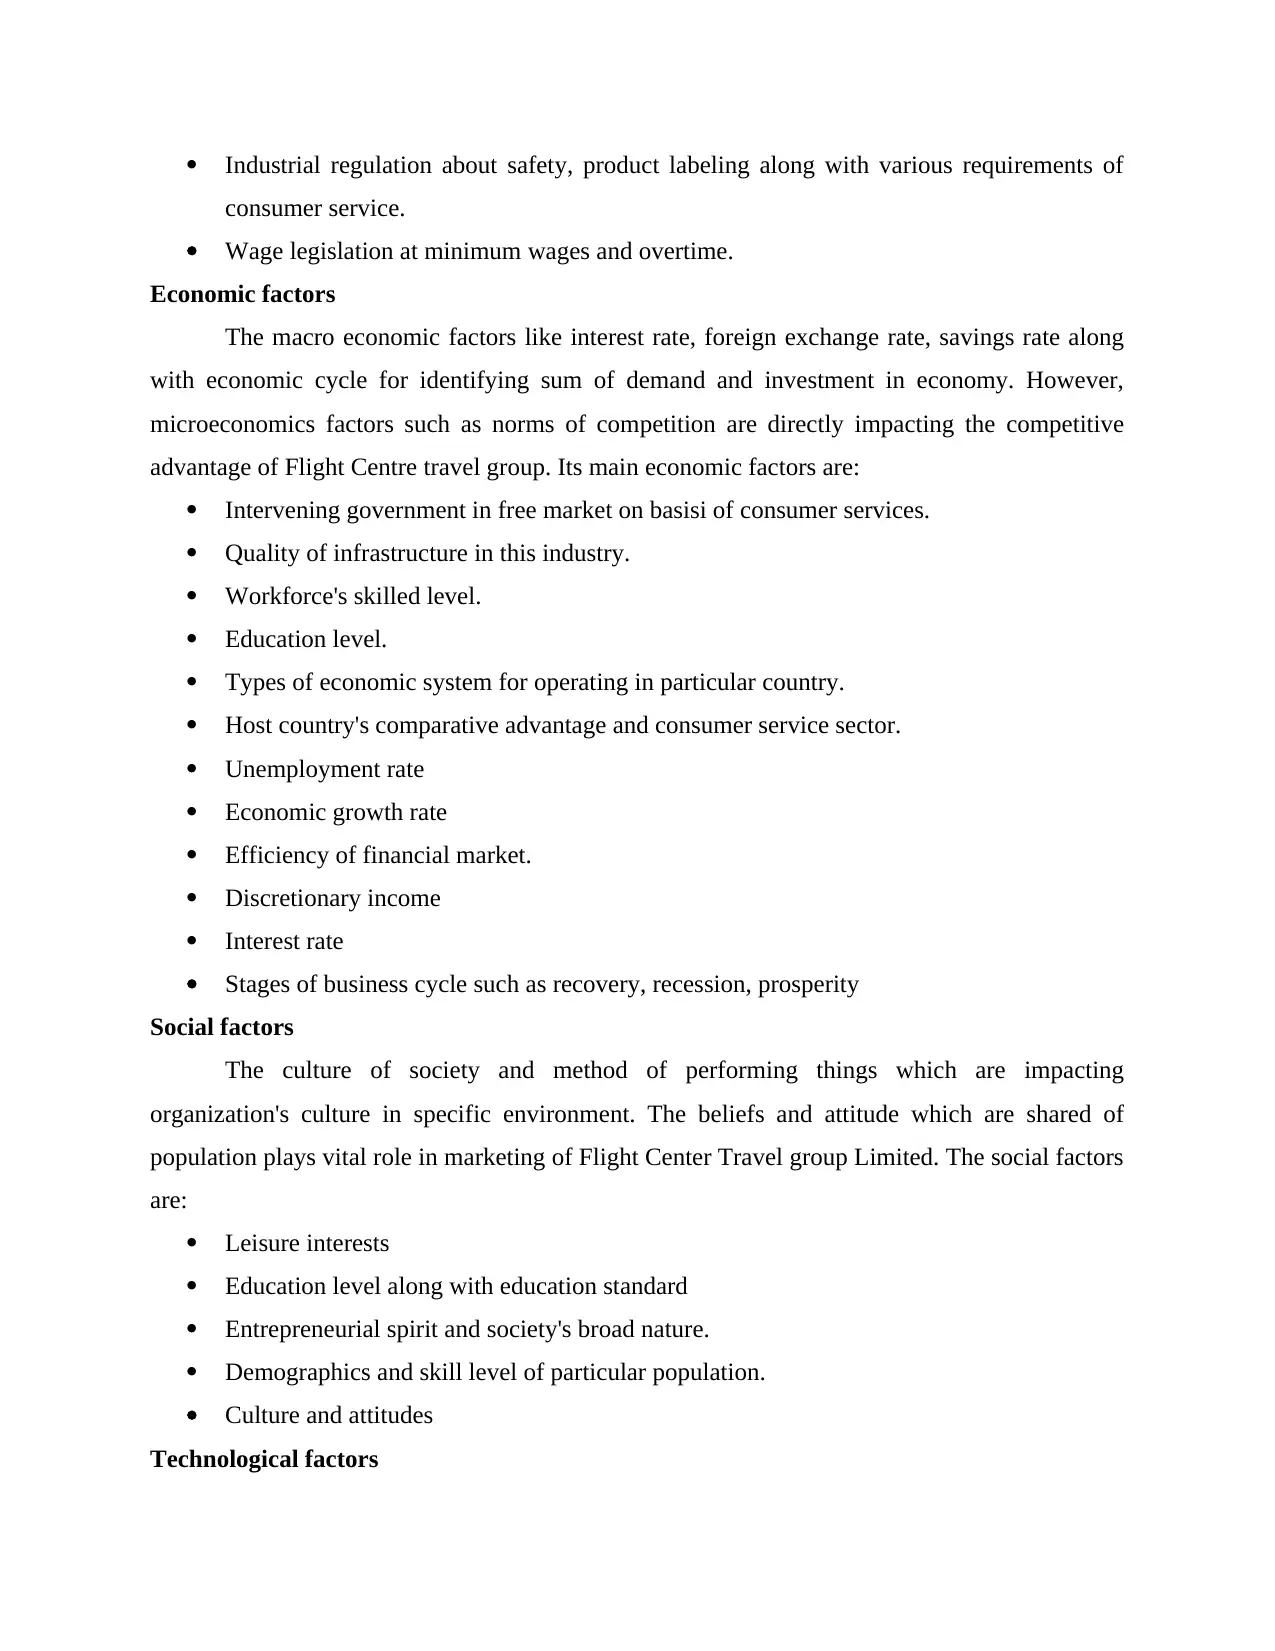
Industrial regulation about safety, product labeling along with various requirements of
consumer service.
Wage legislation at minimum wages and overtime.
Economic factors
The macro economic factors like interest rate, foreign exchange rate, savings rate along
with economic cycle for identifying sum of demand and investment in economy. However,
microeconomics factors such as norms of competition are directly impacting the competitive
advantage of Flight Centre travel group. Its main economic factors are:
Intervening government in free market on basisi of consumer services.
Quality of infrastructure in this industry.
Workforce's skilled level.
Education level.
Types of economic system for operating in particular country.
Host country's comparative advantage and consumer service sector.
Unemployment rate
Economic growth rate
Efficiency of financial market.
Discretionary income
Interest rate
Stages of business cycle such as recovery, recession, prosperity
Social factors
The culture of society and method of performing things which are impacting
organization's culture in specific environment. The beliefs and attitude which are shared of
population plays vital role in marketing of Flight Center Travel group Limited. The social factors
are:
Leisure interests
Education level along with education standard
Entrepreneurial spirit and society's broad nature.
Demographics and skill level of particular population.
Culture and attitudes
Technological factors
In the present scenario, technology is disrupting different industries as transportation is
replicated as best example. Generally. Business must not analyze technology of industry along
with speed through which industry is disrupted. Technological factors impacts the things are
stated below:
Cost structure on consumer service industry impacted through technology.
value chain structure is impacted
technological developments
Technological diffusion's rate
Cost structure is impacted in basis of its cost.
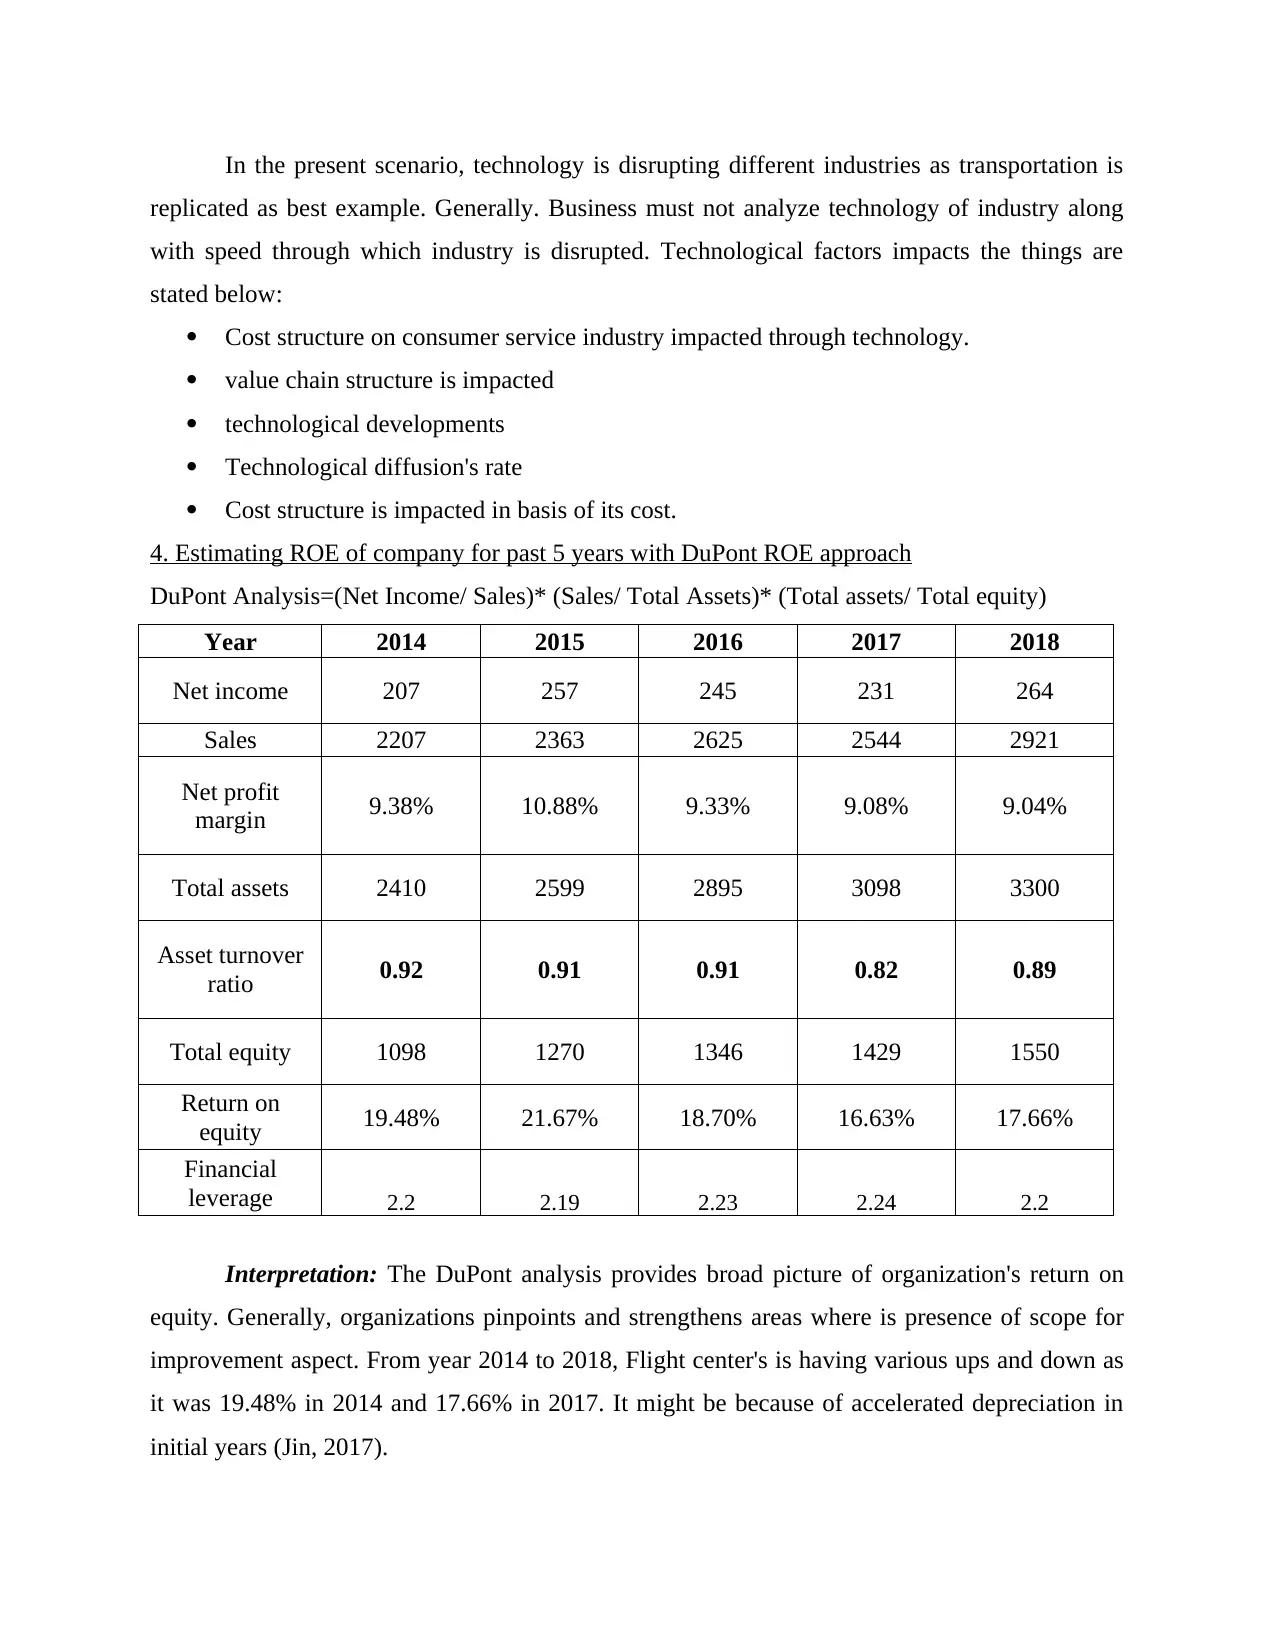
4. Estimating ROE of company for past 5 years with DuPont ROE approach
DuPont Analysis=(Net Income/ Sales)* (Sales/ Total Assets)* (Total assets/ Total equity)
Year 2014 2015 2016 2017 2018
Net income 207 257 245 231 264
Sales 2207 2363 2625 2544 2921
Net profit
margin 9.38% 10.88% 9.33% 9.08% 9.04%
Total assets 2410 2599 2895 3098 3300
Asset turnover
ratio 0.92 0.91 0.91 0.82 0.89
Total equity 1098 1270 1346 1429 1550
Return on
equity 19.48% 21.67% 18.70% 16.63% 17.66%
Financial
leverage 2.2 2.19 2.23 2.24 2.2
Interpretation: The DuPont analysis provides broad picture of organization's return on
equity. Generally, organizations pinpoints and strengthens areas where is presence of scope for
improvement aspect. From year 2014 to 2018, Flight center's is having various ups and down as
it was 19.48% in 2014 and 17.66% in 2017. It might be because of accelerated depreciation in
initial years (Jin, 2017).
replicated as best example. Generally. Business must not analyze technology of industry along
with speed through which industry is disrupted. Technological factors impacts the things are
stated below:
Cost structure on consumer service industry impacted through technology.
value chain structure is impacted
technological developments
Technological diffusion's rate
Cost structure is impacted in basis of its cost.
4. Estimating ROE of company for past 5 years with DuPont ROE approach
DuPont Analysis=(Net Income/ Sales)* (Sales/ Total Assets)* (Total assets/ Total equity)
Year 2014 2015 2016 2017 2018
Net income 207 257 245 231 264
Sales 2207 2363 2625 2544 2921
Net profit
margin 9.38% 10.88% 9.33% 9.08% 9.04%
Total assets 2410 2599 2895 3098 3300
Asset turnover
ratio 0.92 0.91 0.91 0.82 0.89
Total equity 1098 1270 1346 1429 1550
Return on
equity 19.48% 21.67% 18.70% 16.63% 17.66%
Financial
leverage 2.2 2.19 2.23 2.24 2.2
Interpretation: The DuPont analysis provides broad picture of organization's return on
equity. Generally, organizations pinpoints and strengthens areas where is presence of scope for
improvement aspect. From year 2014 to 2018, Flight center's is having various ups and down as
it was 19.48% in 2014 and 17.66% in 2017. It might be because of accelerated depreciation in
initial years (Jin, 2017).
⊘ This is a preview!⊘
Do you want full access?
Subscribe today to unlock all pages.
Trusted by 1+ million students worldwide
1 out of 19
Related Documents


Your All-in-One AI-Powered Toolkit for Academic Success.
+13062052269
info@desklib.com
Available 24*7 on WhatsApp / Email
![[object Object]](/_next/static/media/star-bottom.7253800d.svg)
Unlock your academic potential
Copyright © 2020–2026 A2Z Services. All Rights Reserved. Developed and managed by ZUCOL.