Comprehensive Financial Statement Analysis of Flight Centre Group
VerifiedAdded on 2022/11/28
|16
|3600
|190
Report
AI Summary
This report presents a financial statement analysis of the Flight Centre Travel Group, a major travel agency based in Australia. It examines the company's financial performance using profitability, efficiency, liquidity, and capital structure ratios. The analysis includes a review of return on equity, return on assets, gross profit margin, net profit margin, and cash flow to sales to assess profitability. Efficiency is evaluated using asset turnover and inventory turnover ratios. Liquidity is assessed through current, quick, and cash ratios. Capital structure is examined using debt-to-equity and debt-to-assets ratios. The report compares financial data from 2019 and 2020 to identify trends and provide recommendations for improvement. The report highlights Flight Centre's increased profitability in 2020, despite a decline in revenue, and addresses areas for improvement in liquidity and capital structure.
Financial statement
Analysis of Flight
Center
Analysis of Flight
Center
Paraphrase This Document
Need a fresh take? Get an instant paraphrase of this document with our AI Paraphraser
Executive Summary-
In this report, financial statement analysis of company is done. Financial statement analysis is
very important for company to know the performance of company related to its financials.
Financial statement includes balance sheet, cash flow statement and profit and lost statement. In
this report, flight center is analyzed to know its financial performance and compared with past
years to measure the growth of the company.
Table of Contents
Executive Summary-...................................................................................................................................2
Introduction-................................................................................................................................................4
Profitability Ratio-.......................................................................................................................................4
Efficiency ratio-...........................................................................................................................................6
Liquidity ratio-............................................................................................................................................7
Capital structure-.........................................................................................................................................8
Recommendations-....................................................................................................................................10
Conclusion-...............................................................................................................................................10
⊘ This is a preview!⊘
Do you want full access?
Subscribe today to unlock all pages.
Trusted by 1+ million students worldwide
Introduction-
This report is based on measurement of financial performance of the flight center travel group. It
is a travel agency based in Australia. It is founded in 1982 by Graham Turner. Company is
headquartered in Brisbane, Queensland Australia. Company has three divisions which are in
Australia, UK and Canada. Subsidiaries of company are Olympus tours, Student universe, FCM
travel solutions, Liberty travel, Aunt betty and Flight centre exclusive. It is public company. It
was started in a store in 1995. In 2015, company acquired student universe and next year
company introduced its online travel brand Aunt Betty. Company’s aim is to provide services at
lower prices than retail location of flight center. Company operates in more than 80 countries. It
has multiple brands in flight center new Zealand which involves Travel Money NZ and corporate
traveller. Financial statements of Flight center are analyzed in order to see the financial
performance of the company.
Profitability Ratio-
Profitability ratios are to measure the income of the company. It is very important to check
profitability of company. It shows the cash generation capacity of the company. Various types of
profitability ratios are used to measure the income of the company it includes net profit margin,
gross profit margin, operating profit margin, return to equity and return to assets. All these ratio
plays main role in checking the profitability of the company. Some profitability ratios are
calculated as follows-
Return on equity-
Company uses this measure to check its profitability in relation to shareholders equity. In order
to calculate return on equity, net income and equity must be a positive number. Return on equity
can be calculated by following formula-
Return on equity = Net income/ Shareholder’s equity
Shareholder’s equity = Total assets – Total liabilities
Flight center has an increase in its return on equity. In 2019 return on equity was only 17% but in
2020 it is increased by 46%. It is very good sign. It means company is generating more profit
when it is compared to past year. Performance of company is very strong in 2020. In 2019,
Paraphrase This Document
Need a fresh take? Get an instant paraphrase of this document with our AI Paraphraser
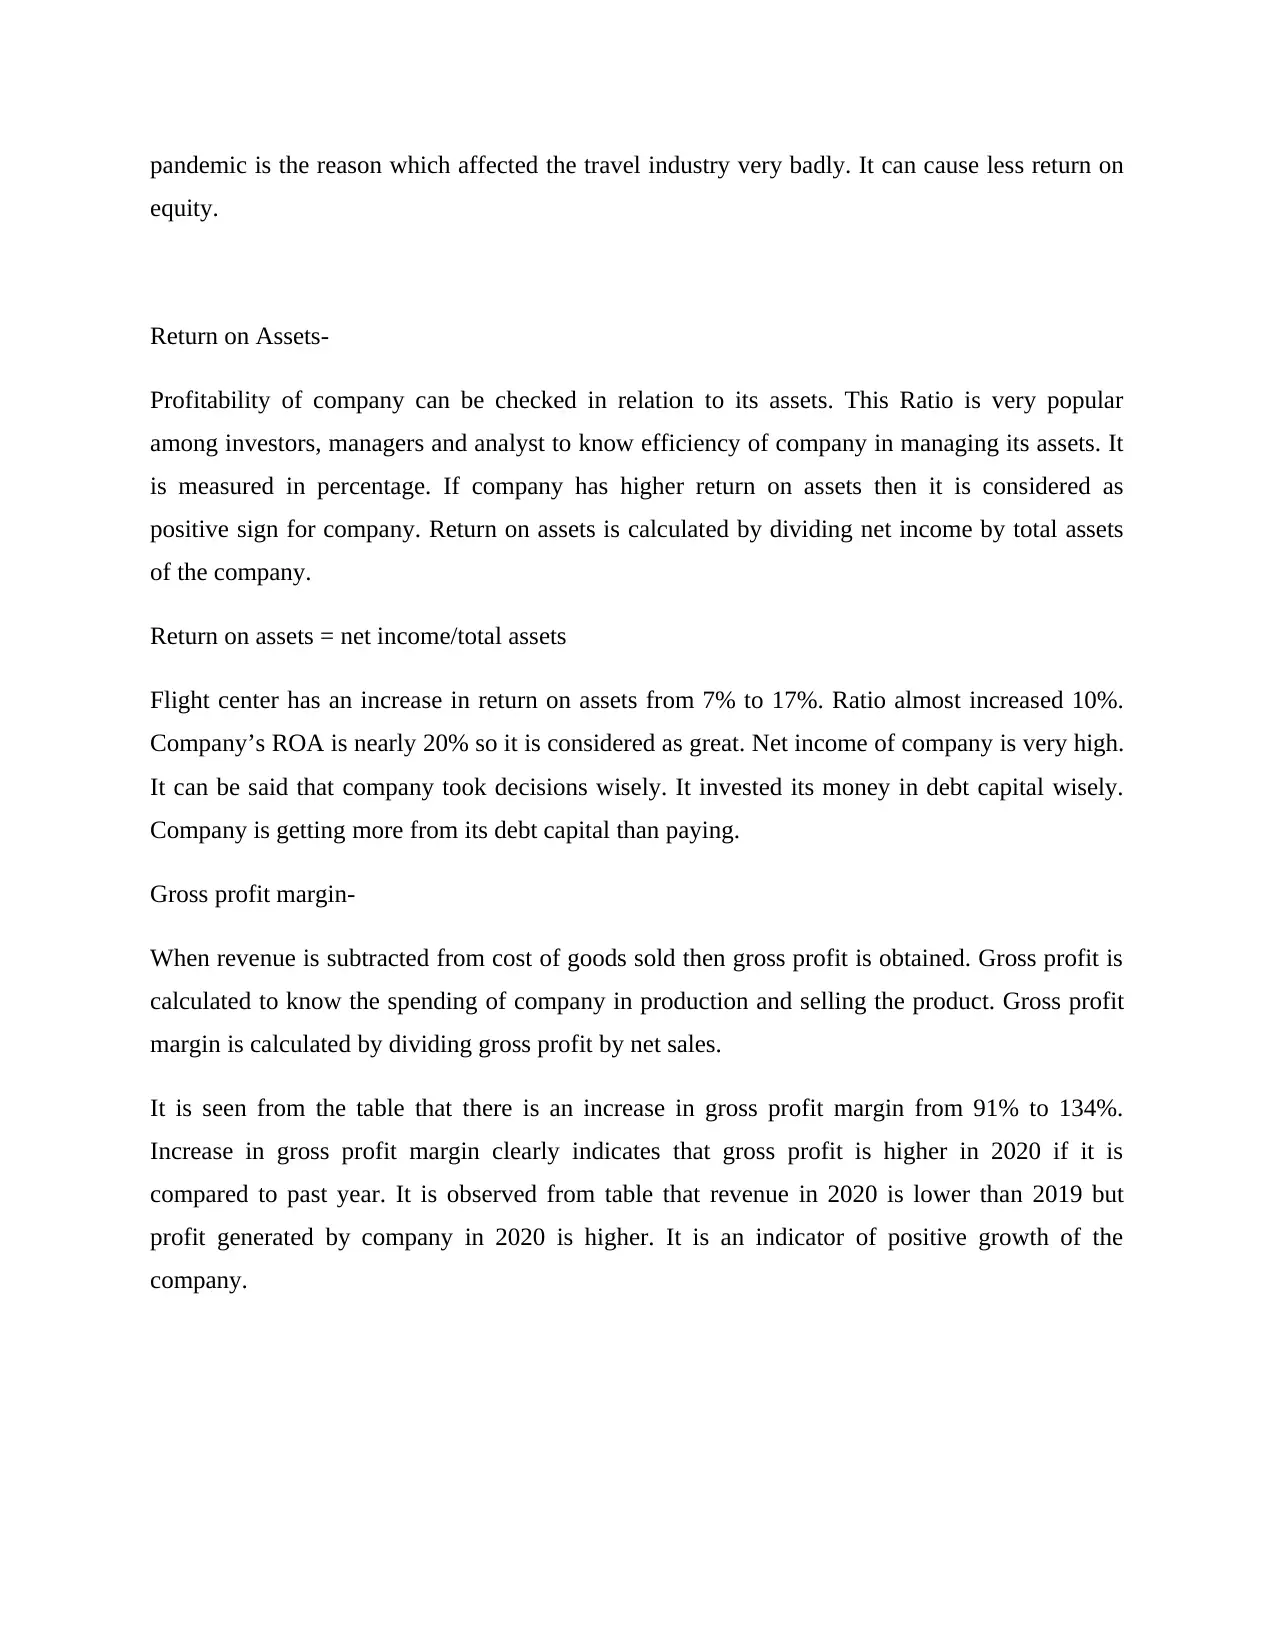
pandemic is the reason which affected the travel industry very badly. It can cause less return on
equity.
Return on Assets-
Profitability of company can be checked in relation to its assets. This Ratio is very popular
among investors, managers and analyst to know efficiency of company in managing its assets. It
is measured in percentage. If company has higher return on assets then it is considered as
positive sign for company. Return on assets is calculated by dividing net income by total assets
of the company.
Return on assets = net income/total assets
Flight center has an increase in return on assets from 7% to 17%. Ratio almost increased 10%.
Company’s ROA is nearly 20% so it is considered as great. Net income of company is very high.
It can be said that company took decisions wisely. It invested its money in debt capital wisely.
Company is getting more from its debt capital than paying.
Gross profit margin-
When revenue is subtracted from cost of goods sold then gross profit is obtained. Gross profit is
calculated to know the spending of company in production and selling the product. Gross profit
margin is calculated by dividing gross profit by net sales.
It is seen from the table that there is an increase in gross profit margin from 91% to 134%.
Increase in gross profit margin clearly indicates that gross profit is higher in 2020 if it is
compared to past year. It is observed from table that revenue in 2020 is lower than 2019 but
profit generated by company in 2020 is higher. It is an indicator of positive growth of the
company.
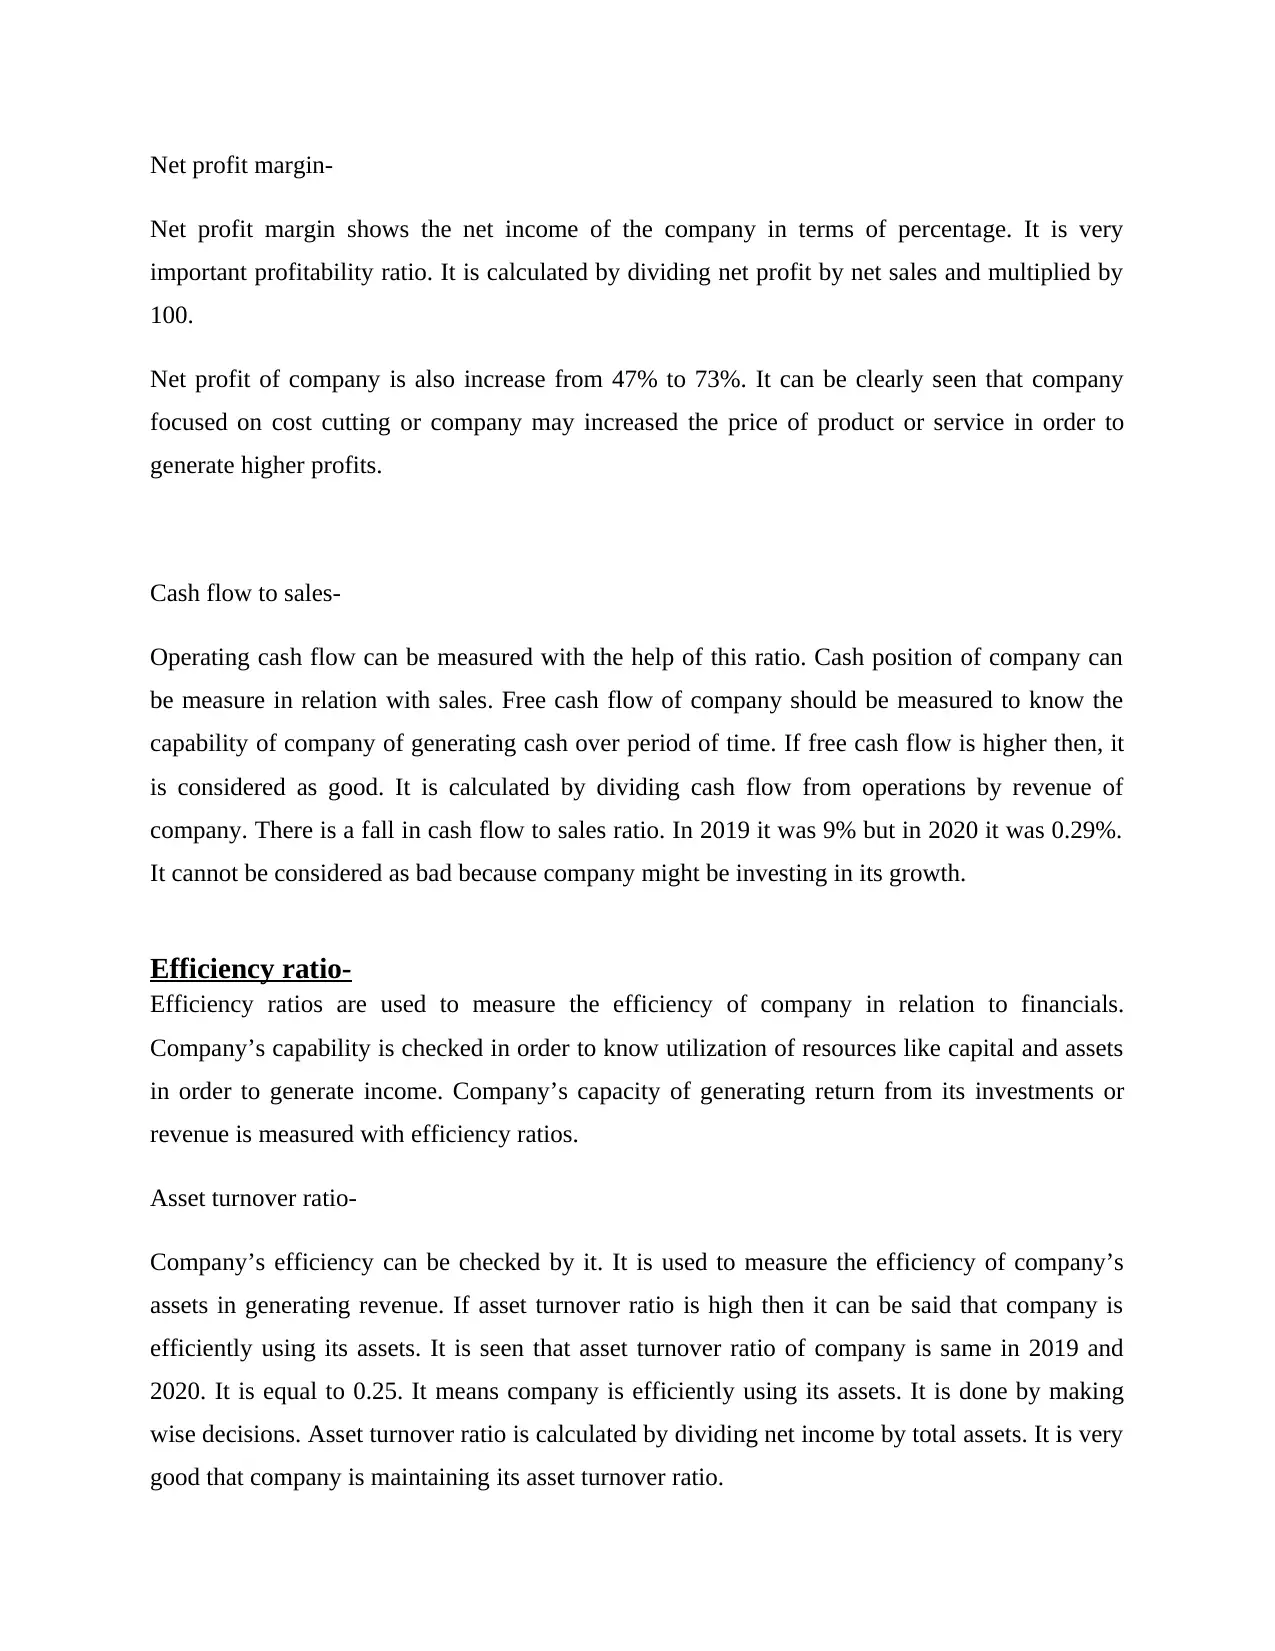
Net profit margin-
Net profit margin shows the net income of the company in terms of percentage. It is very
important profitability ratio. It is calculated by dividing net profit by net sales and multiplied by
100.
Net profit of company is also increase from 47% to 73%. It can be clearly seen that company
focused on cost cutting or company may increased the price of product or service in order to
generate higher profits.
Cash flow to sales-
Operating cash flow can be measured with the help of this ratio. Cash position of company can
be measure in relation with sales. Free cash flow of company should be measured to know the
capability of company of generating cash over period of time. If free cash flow is higher then, it
is considered as good. It is calculated by dividing cash flow from operations by revenue of
company. There is a fall in cash flow to sales ratio. In 2019 it was 9% but in 2020 it was 0.29%.
It cannot be considered as bad because company might be investing in its growth.
Efficiency ratio-
Efficiency ratios are used to measure the efficiency of company in relation to financials.
Company’s capability is checked in order to know utilization of resources like capital and assets
in order to generate income. Company’s capacity of generating return from its investments or
revenue is measured with efficiency ratios.
Asset turnover ratio-
Company’s efficiency can be checked by it. It is used to measure the efficiency of company’s
assets in generating revenue. If asset turnover ratio is high then it can be said that company is
efficiently using its assets. It is seen that asset turnover ratio of company is same in 2019 and
2020. It is equal to 0.25. It means company is efficiently using its assets. It is done by making
wise decisions. Asset turnover ratio is calculated by dividing net income by total assets. It is very
good that company is maintaining its asset turnover ratio.
⊘ This is a preview!⊘
Do you want full access?
Subscribe today to unlock all pages.
Trusted by 1+ million students worldwide
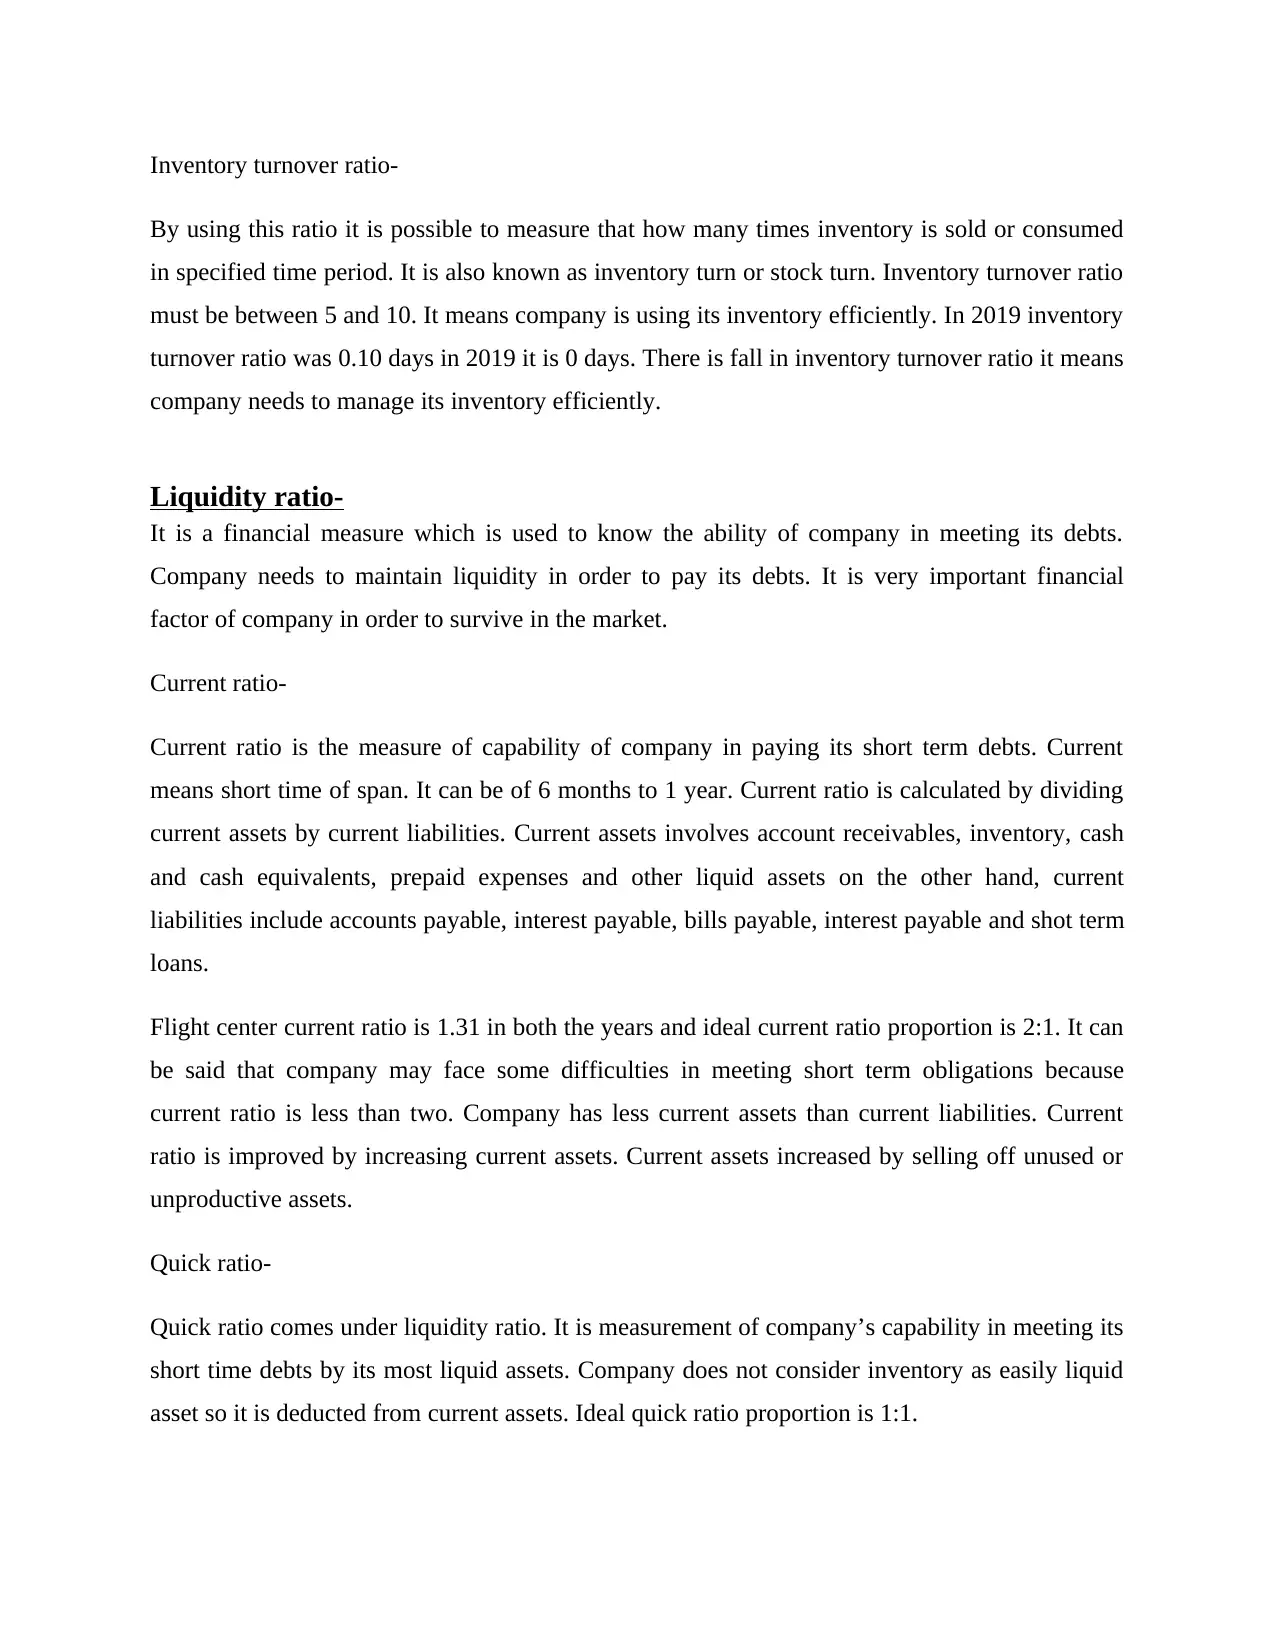
Inventory turnover ratio-
By using this ratio it is possible to measure that how many times inventory is sold or consumed
in specified time period. It is also known as inventory turn or stock turn. Inventory turnover ratio
must be between 5 and 10. It means company is using its inventory efficiently. In 2019 inventory
turnover ratio was 0.10 days in 2019 it is 0 days. There is fall in inventory turnover ratio it means
company needs to manage its inventory efficiently.
Liquidity ratio-
It is a financial measure which is used to know the ability of company in meeting its debts.
Company needs to maintain liquidity in order to pay its debts. It is very important financial
factor of company in order to survive in the market.
Current ratio-
Current ratio is the measure of capability of company in paying its short term debts. Current
means short time of span. It can be of 6 months to 1 year. Current ratio is calculated by dividing
current assets by current liabilities. Current assets involves account receivables, inventory, cash
and cash equivalents, prepaid expenses and other liquid assets on the other hand, current
liabilities include accounts payable, interest payable, bills payable, interest payable and shot term
loans.
Flight center current ratio is 1.31 in both the years and ideal current ratio proportion is 2:1. It can
be said that company may face some difficulties in meeting short term obligations because
current ratio is less than two. Company has less current assets than current liabilities. Current
ratio is improved by increasing current assets. Current assets increased by selling off unused or
unproductive assets.
Quick ratio-
Quick ratio comes under liquidity ratio. It is measurement of company’s capability in meeting its
short time debts by its most liquid assets. Company does not consider inventory as easily liquid
asset so it is deducted from current assets. Ideal quick ratio proportion is 1:1.
Paraphrase This Document
Need a fresh take? Get an instant paraphrase of this document with our AI Paraphraser
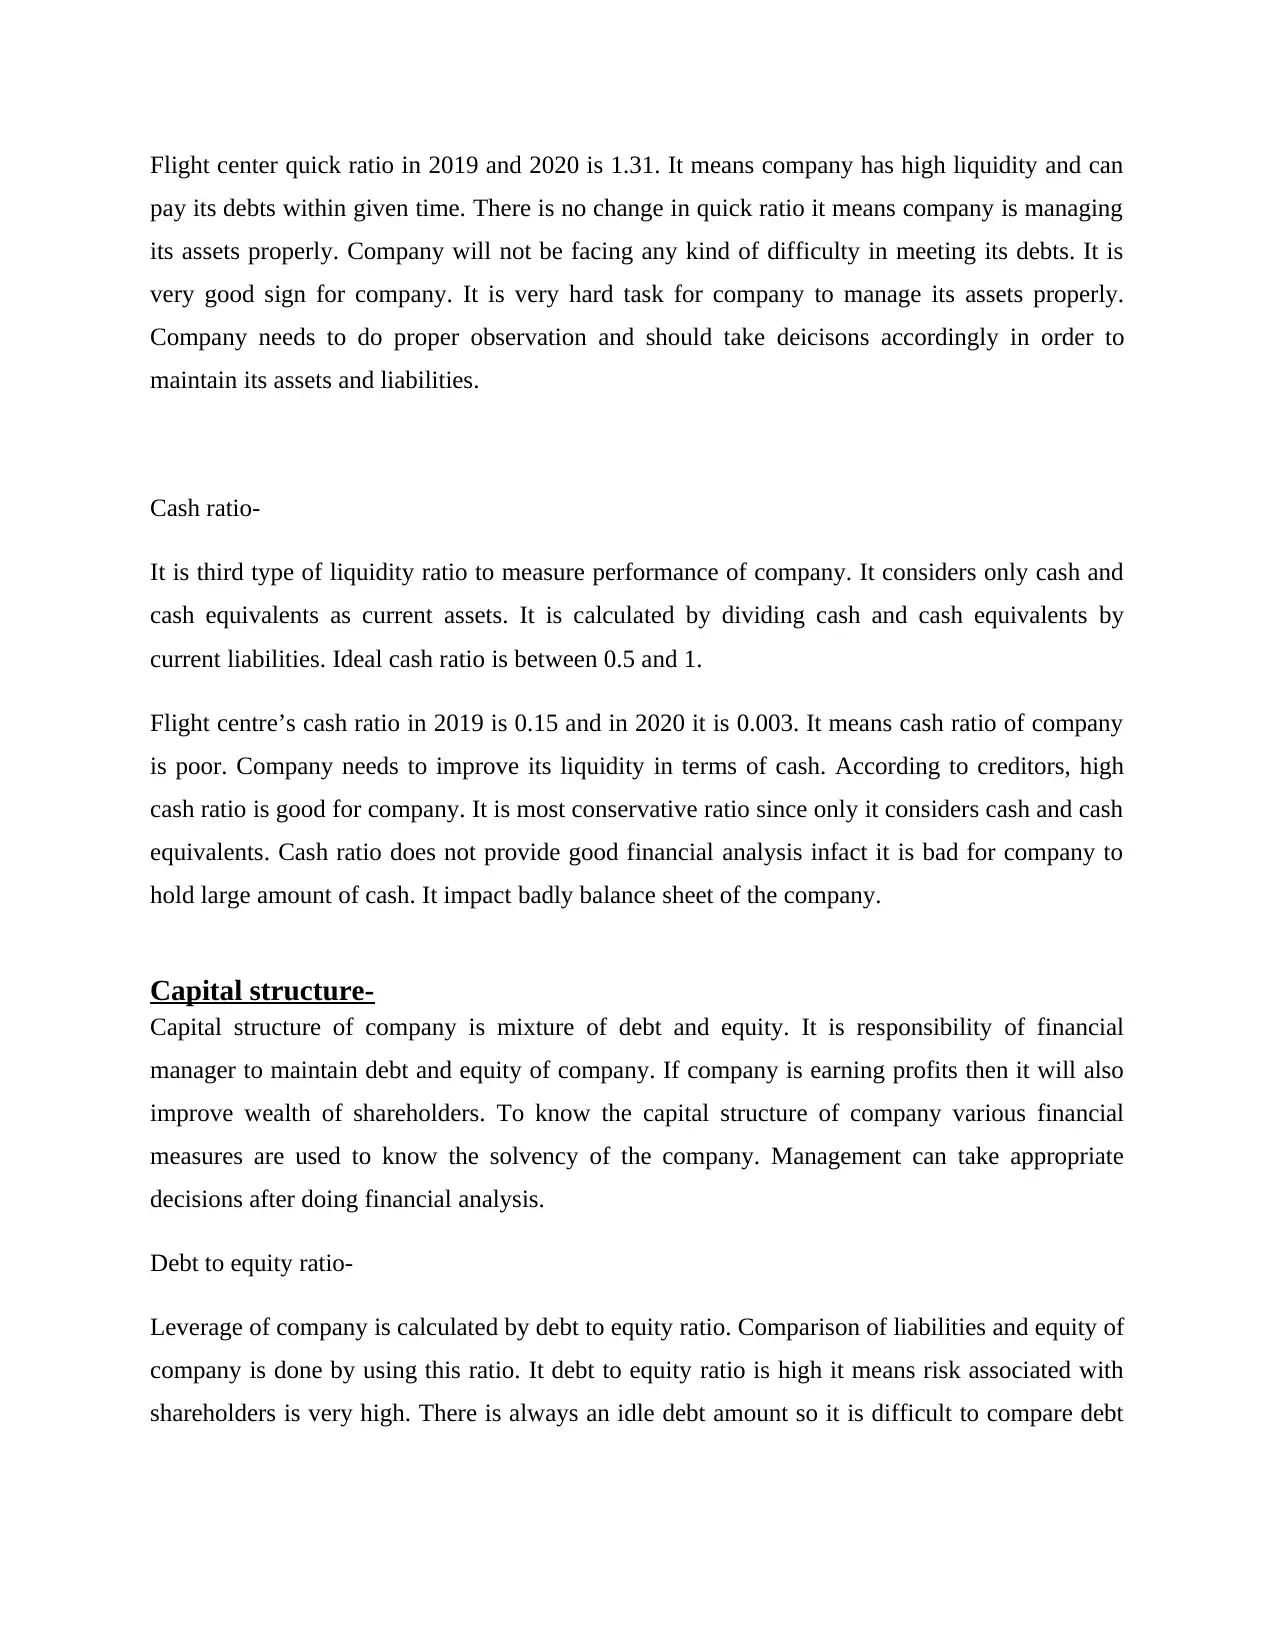
Flight center quick ratio in 2019 and 2020 is 1.31. It means company has high liquidity and can
pay its debts within given time. There is no change in quick ratio it means company is managing
its assets properly. Company will not be facing any kind of difficulty in meeting its debts. It is
very good sign for company. It is very hard task for company to manage its assets properly.
Company needs to do proper observation and should take deicisons accordingly in order to
maintain its assets and liabilities.
Cash ratio-
It is third type of liquidity ratio to measure performance of company. It considers only cash and
cash equivalents as current assets. It is calculated by dividing cash and cash equivalents by
current liabilities. Ideal cash ratio is between 0.5 and 1.
Flight centre’s cash ratio in 2019 is 0.15 and in 2020 it is 0.003. It means cash ratio of company
is poor. Company needs to improve its liquidity in terms of cash. According to creditors, high
cash ratio is good for company. It is most conservative ratio since only it considers cash and cash
equivalents. Cash ratio does not provide good financial analysis infact it is bad for company to
hold large amount of cash. It impact badly balance sheet of the company.
Capital structure-
Capital structure of company is mixture of debt and equity. It is responsibility of financial
manager to maintain debt and equity of company. If company is earning profits then it will also
improve wealth of shareholders. To know the capital structure of company various financial
measures are used to know the solvency of the company. Management can take appropriate
decisions after doing financial analysis.
Debt to equity ratio-
Leverage of company is calculated by debt to equity ratio. Comparison of liabilities and equity of
company is done by using this ratio. It debt to equity ratio is high it means risk associated with
shareholders is very high. There is always an idle debt amount so it is difficult to compare debt
to equity ratio across the industry. Company’s investors mainly focus on long term debt because
there is difference between risk associate with long term liabilities and short term liabilities.
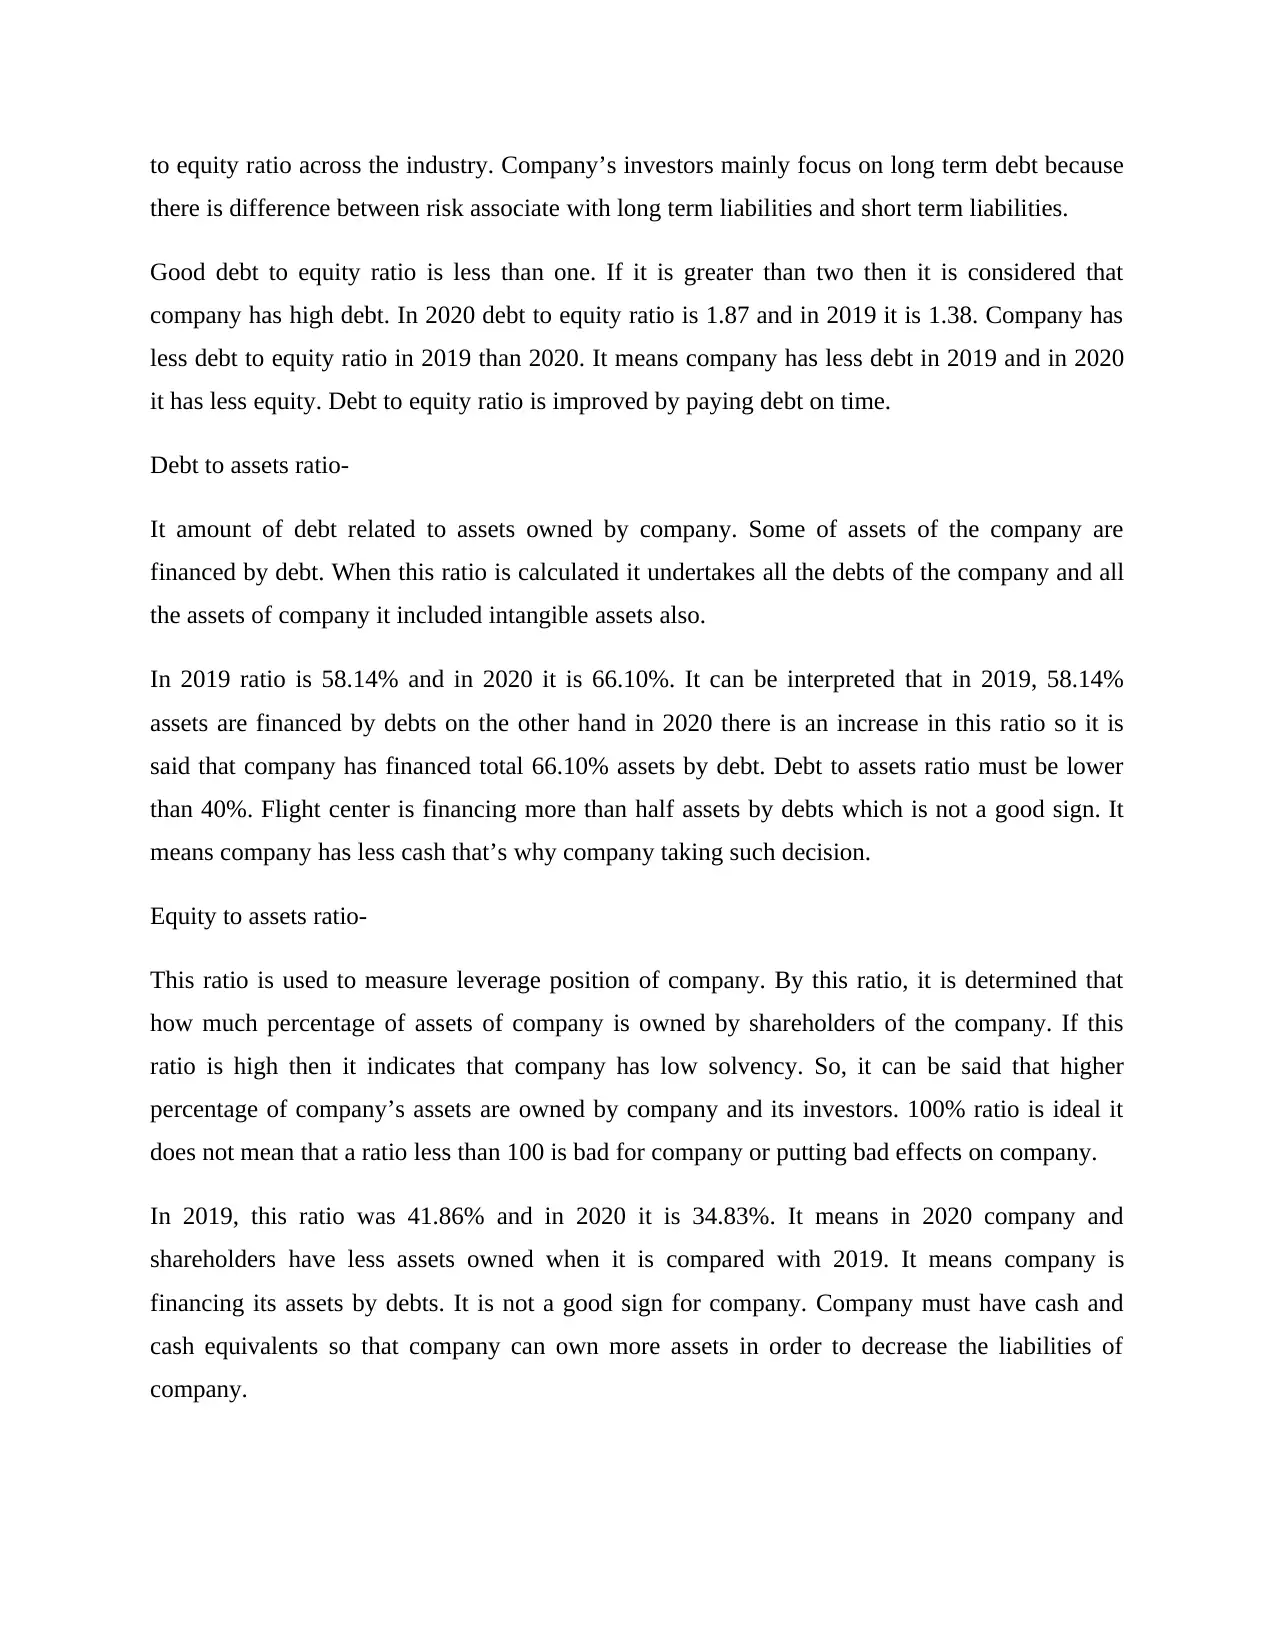
Good debt to equity ratio is less than one. If it is greater than two then it is considered that
company has high debt. In 2020 debt to equity ratio is 1.87 and in 2019 it is 1.38. Company has
less debt to equity ratio in 2019 than 2020. It means company has less debt in 2019 and in 2020
it has less equity. Debt to equity ratio is improved by paying debt on time.
Debt to assets ratio-
It amount of debt related to assets owned by company. Some of assets of the company are
financed by debt. When this ratio is calculated it undertakes all the debts of the company and all
the assets of company it included intangible assets also.
In 2019 ratio is 58.14% and in 2020 it is 66.10%. It can be interpreted that in 2019, 58.14%
assets are financed by debts on the other hand in 2020 there is an increase in this ratio so it is
said that company has financed total 66.10% assets by debt. Debt to assets ratio must be lower
than 40%. Flight center is financing more than half assets by debts which is not a good sign. It
means company has less cash that’s why company taking such decision.
Equity to assets ratio-
This ratio is used to measure leverage position of company. By this ratio, it is determined that
how much percentage of assets of company is owned by shareholders of the company. If this
ratio is high then it indicates that company has low solvency. So, it can be said that higher
percentage of company’s assets are owned by company and its investors. 100% ratio is ideal it
does not mean that a ratio less than 100 is bad for company or putting bad effects on company.
In 2019, this ratio was 41.86% and in 2020 it is 34.83%. It means in 2020 company and
shareholders have less assets owned when it is compared with 2019. It means company is
financing its assets by debts. It is not a good sign for company. Company must have cash and
cash equivalents so that company can own more assets in order to decrease the liabilities of
company.
there is difference between risk associate with long term liabilities and short term liabilities.
Good debt to equity ratio is less than one. If it is greater than two then it is considered that
company has high debt. In 2020 debt to equity ratio is 1.87 and in 2019 it is 1.38. Company has
less debt to equity ratio in 2019 than 2020. It means company has less debt in 2019 and in 2020
it has less equity. Debt to equity ratio is improved by paying debt on time.
Debt to assets ratio-
It amount of debt related to assets owned by company. Some of assets of the company are
financed by debt. When this ratio is calculated it undertakes all the debts of the company and all
the assets of company it included intangible assets also.
In 2019 ratio is 58.14% and in 2020 it is 66.10%. It can be interpreted that in 2019, 58.14%
assets are financed by debts on the other hand in 2020 there is an increase in this ratio so it is
said that company has financed total 66.10% assets by debt. Debt to assets ratio must be lower
than 40%. Flight center is financing more than half assets by debts which is not a good sign. It
means company has less cash that’s why company taking such decision.
Equity to assets ratio-
This ratio is used to measure leverage position of company. By this ratio, it is determined that
how much percentage of assets of company is owned by shareholders of the company. If this
ratio is high then it indicates that company has low solvency. So, it can be said that higher
percentage of company’s assets are owned by company and its investors. 100% ratio is ideal it
does not mean that a ratio less than 100 is bad for company or putting bad effects on company.
In 2019, this ratio was 41.86% and in 2020 it is 34.83%. It means in 2020 company and
shareholders have less assets owned when it is compared with 2019. It means company is
financing its assets by debts. It is not a good sign for company. Company must have cash and
cash equivalents so that company can own more assets in order to decrease the liabilities of
company.
⊘ This is a preview!⊘
Do you want full access?
Subscribe today to unlock all pages.
Trusted by 1+ million students worldwide
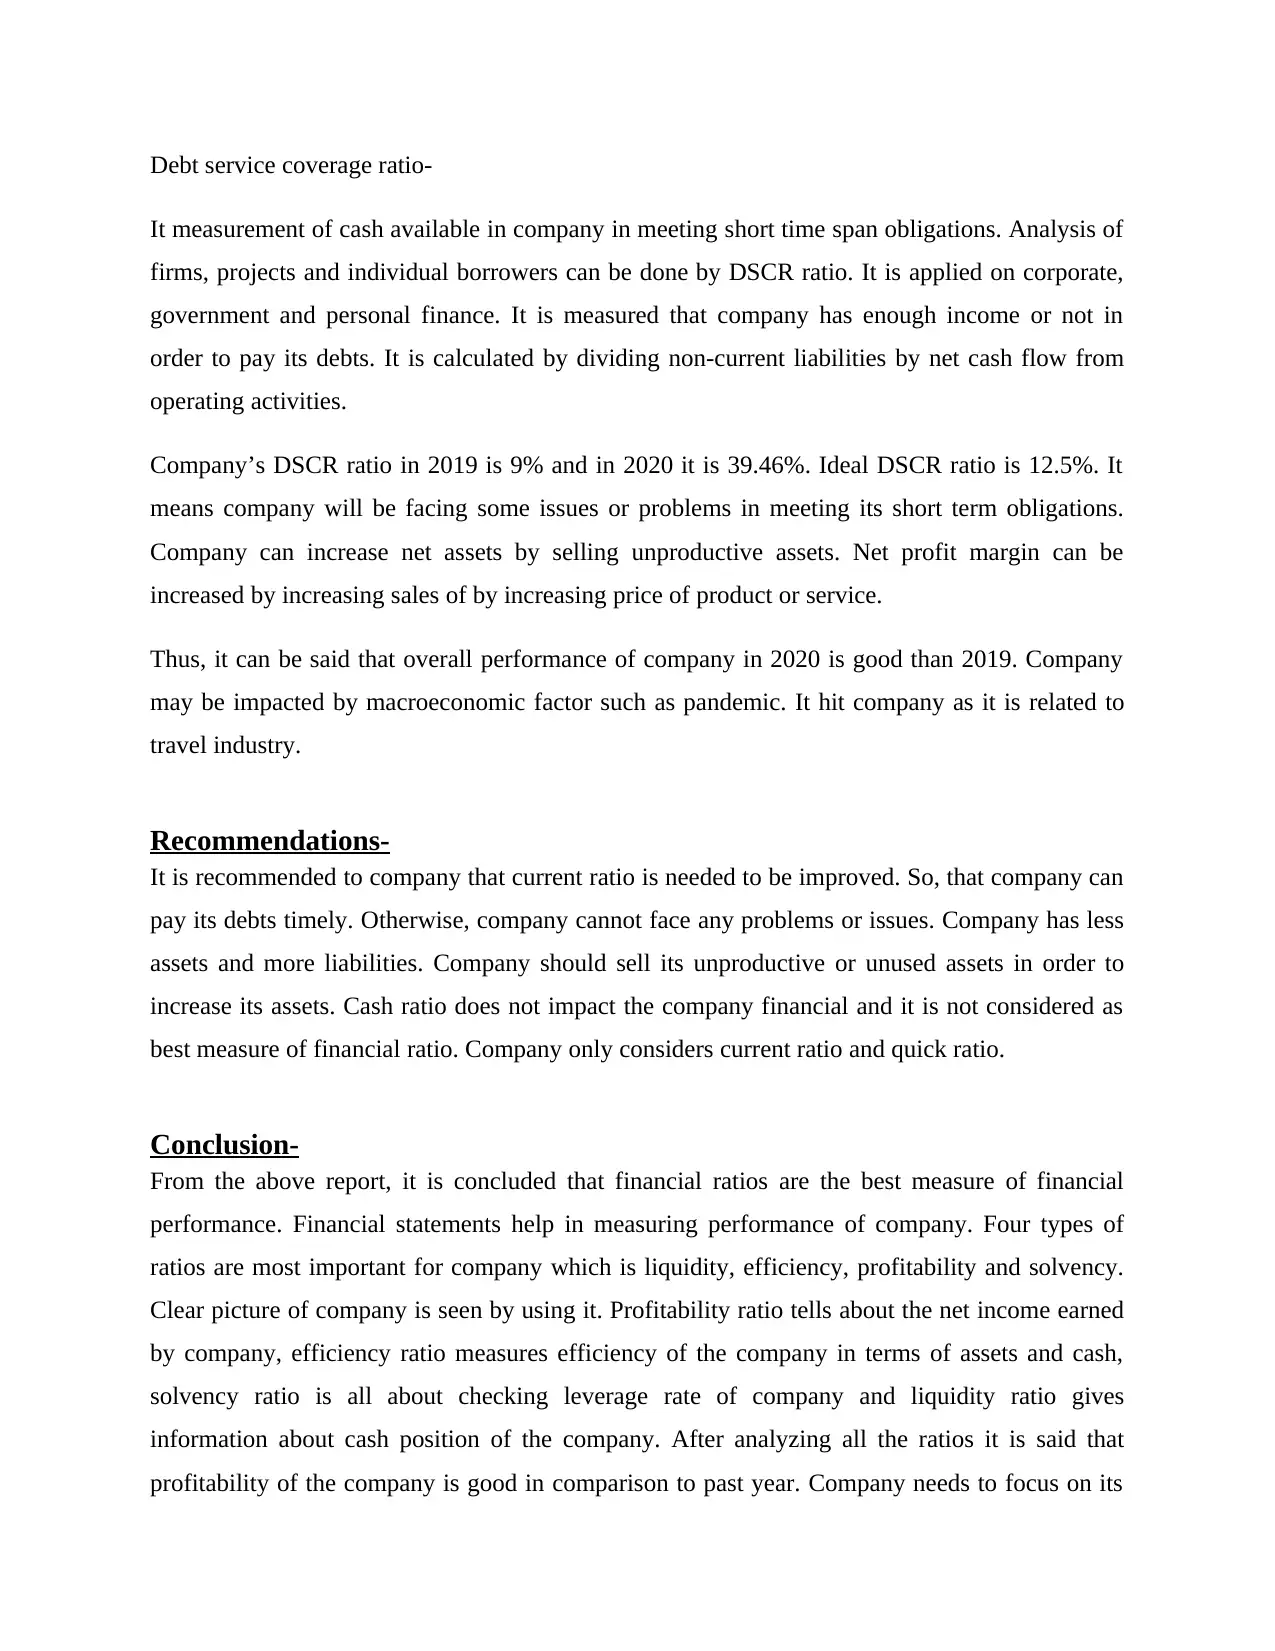
Debt service coverage ratio-
It measurement of cash available in company in meeting short time span obligations. Analysis of
firms, projects and individual borrowers can be done by DSCR ratio. It is applied on corporate,
government and personal finance. It is measured that company has enough income or not in
order to pay its debts. It is calculated by dividing non-current liabilities by net cash flow from
operating activities.
Company’s DSCR ratio in 2019 is 9% and in 2020 it is 39.46%. Ideal DSCR ratio is 12.5%. It
means company will be facing some issues or problems in meeting its short term obligations.
Company can increase net assets by selling unproductive assets. Net profit margin can be
increased by increasing sales of by increasing price of product or service.
Thus, it can be said that overall performance of company in 2020 is good than 2019. Company
may be impacted by macroeconomic factor such as pandemic. It hit company as it is related to
travel industry.
Recommendations-
It is recommended to company that current ratio is needed to be improved. So, that company can
pay its debts timely. Otherwise, company cannot face any problems or issues. Company has less
assets and more liabilities. Company should sell its unproductive or unused assets in order to
increase its assets. Cash ratio does not impact the company financial and it is not considered as
best measure of financial ratio. Company only considers current ratio and quick ratio.
Conclusion-
From the above report, it is concluded that financial ratios are the best measure of financial
performance. Financial statements help in measuring performance of company. Four types of
ratios are most important for company which is liquidity, efficiency, profitability and solvency.
Clear picture of company is seen by using it. Profitability ratio tells about the net income earned
by company, efficiency ratio measures efficiency of the company in terms of assets and cash,
solvency ratio is all about checking leverage rate of company and liquidity ratio gives
information about cash position of the company. After analyzing all the ratios it is said that
profitability of the company is good in comparison to past year. Company needs to focus on its
Paraphrase This Document
Need a fresh take? Get an instant paraphrase of this document with our AI Paraphraser
liquidity so that it can improve its cash generating capacity. Efficiency of the company is
measure that how efficient a company is managing its assets and liabilities. Efficiency of
company is also good but company needs to improve its solvency. Thus, it can be said that
financial ratios are best for measurement of financial performance of the company.
References-
Books and Journals-
Amir, E. and Ghitti, M., 2020. Financial Analysis of Business Combinations (Ratios).
In Financial Analysis of Mergers and Acquisitions (pp. 141-164). Palgrave Macmillan, Cham.
Brigham, E.F. and Houston, J.F., 2021. Fundamentals of financial management. Cengage
Learning.
Campbell, J.L., D'Adduzio, J., Downes, J. and Utke, S., 2020. Do Debt Investors Adjust
Financial Statement Ratios when Financial Statements Fail to Reflect Economic Substance?
Evidence from Cash Flow Hedges. Contemporary Accounting Research, Forthcoming.
Chandra, P., 2020. Fundamentals of Financial Management|. McGraw-Hill Education.
Coenders Gallart, G., Linares Mustaros, S. and Vives Mestres, M., 2018. Financial performance
and distress profiles. From classification according to financial ratios to compositional
classification. Advances in Accounting, 2018, vol. 40, p. 1-10.
Dong, W., Liao, S. and Zhang, Z., 2018. Leveraging financial social media data for corporate
fraud detection. Journal of Management Information Systems, 35(2), pp.461-487.
Haddad, A.E., Shibly, F.B. and Haddad, R., 2020. Voluntary disclosure of accounting ratios and
firm-specific characteristics: the case of GCC. Journal of Financial Reporting and Accounting.
Haghparast, A., Momeni, A., Gord, A. and Mansoori, F., 2021. Imaged financial Ratios and
Bankruptcy Prediction using Convolutional Neural Networks.
Haghparast, A., Momeni, A., GORD, A. and Mansouri, F., 2021. Imaged financial Ratios and
Bankruptcy Prediction using Convolutional Neural Networks and comparison with traditional
models. Accounting and Auditing Review.
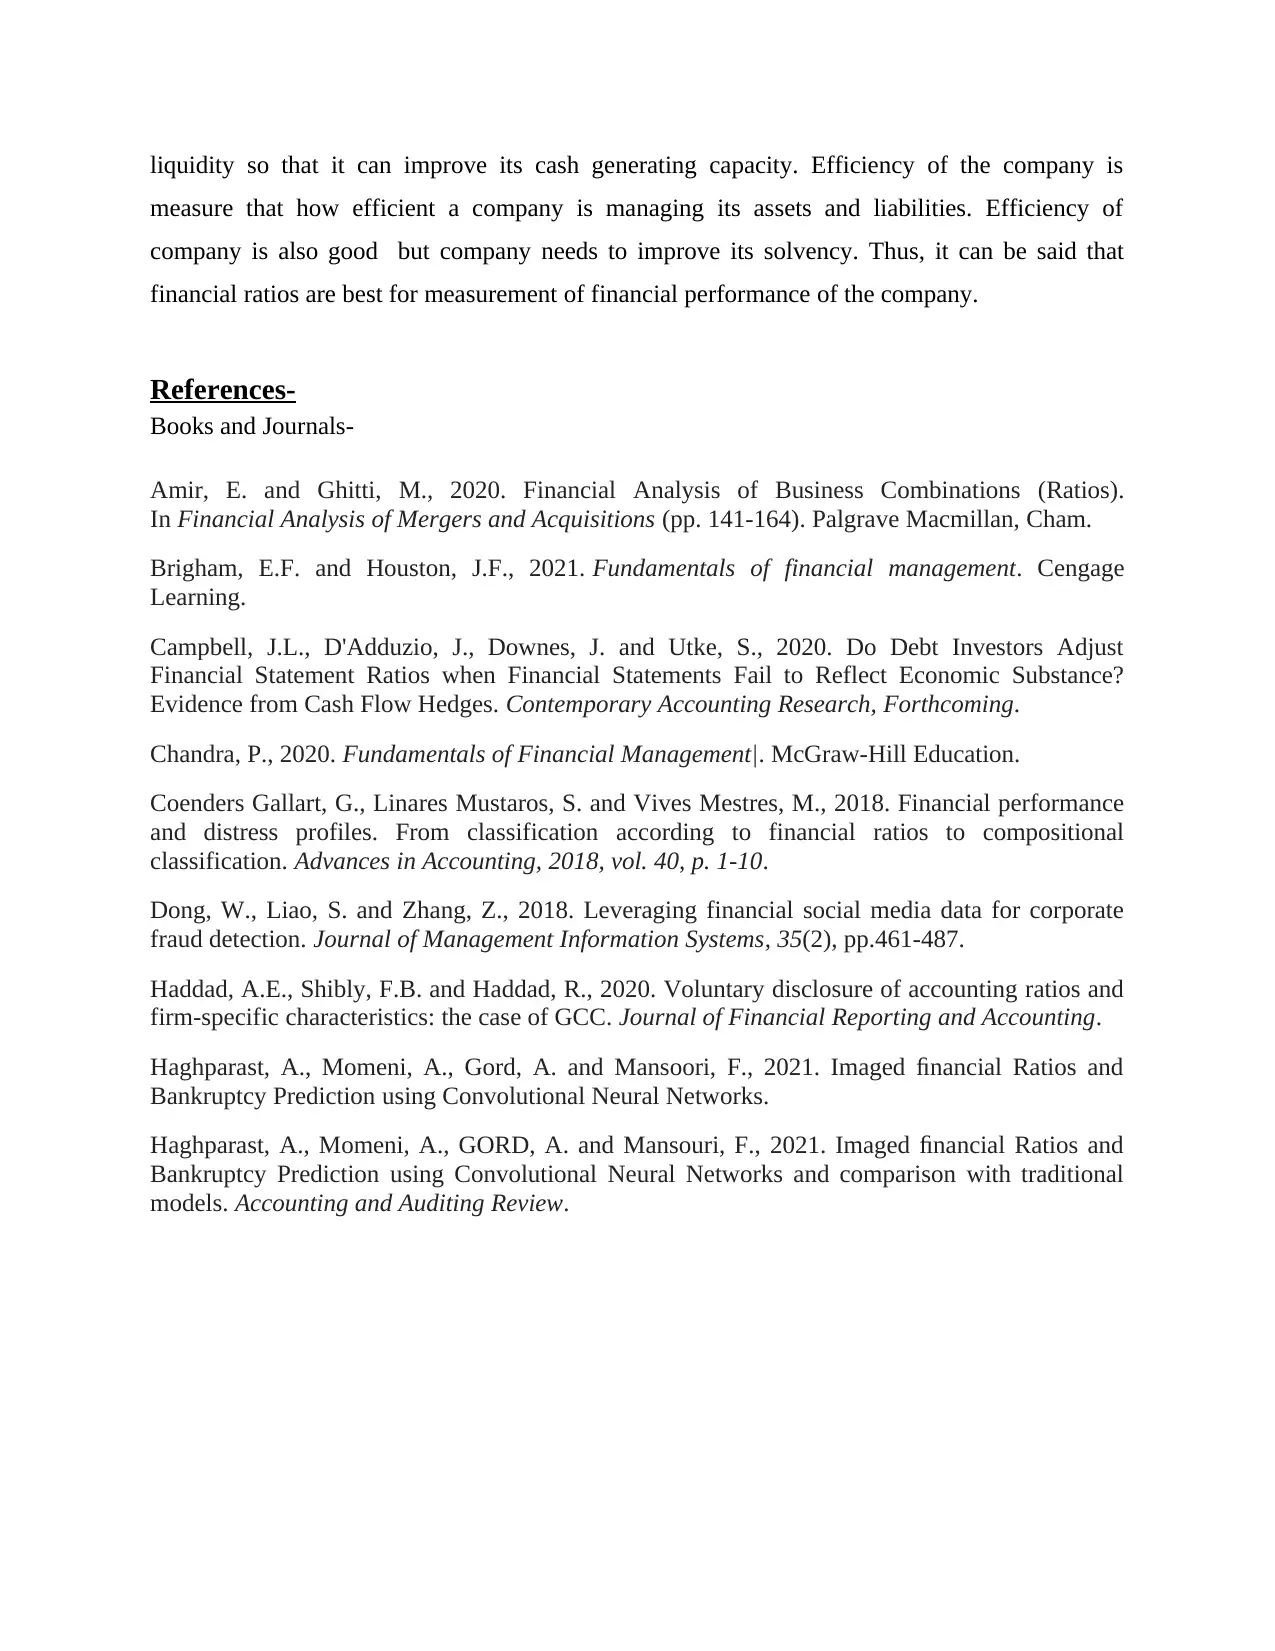
Appendix 1 – Profitability
Appendix 1 - Profitability Ratios
Appendix 1.1 Equation 2020 2019
Return On Equity (ROE) (662109/[1393186+1462319/2])*100 = 46 % (264174/[1462318+1554442/2])*100 = 17 %
Appendix 1.2
Return On Assets (ROA) (662109/[3999066+3493414/2])*100 = 17 % (264174/[3493414+3405219/2])*100 = 7 %
Appendix 1.3
Gross profit margiin (1898085-(662109)/1898085)*100 = 134 % ([3055268-264174]/3055268)*100 = 91 %
Appendix 1.4
Profit margin (1393186/1898085)*100 = 73 % (1462318/3055268)*100 = 47 %
Appendix 1.5
Cash flow to sales (5654/1898085)*100 = 0.29 % (278883/3055268)*100 = 9 %
Net income (profit) X 100 = x %
Average Equity
Net income (profit) X 100 = x %
Average assets
(revenue - cost of sales) X 100 = x %
Sales of revenue
Profit X 100 = x %
Sales of revenue
Cash from operating activities X 100 = x %
Sales of revenue
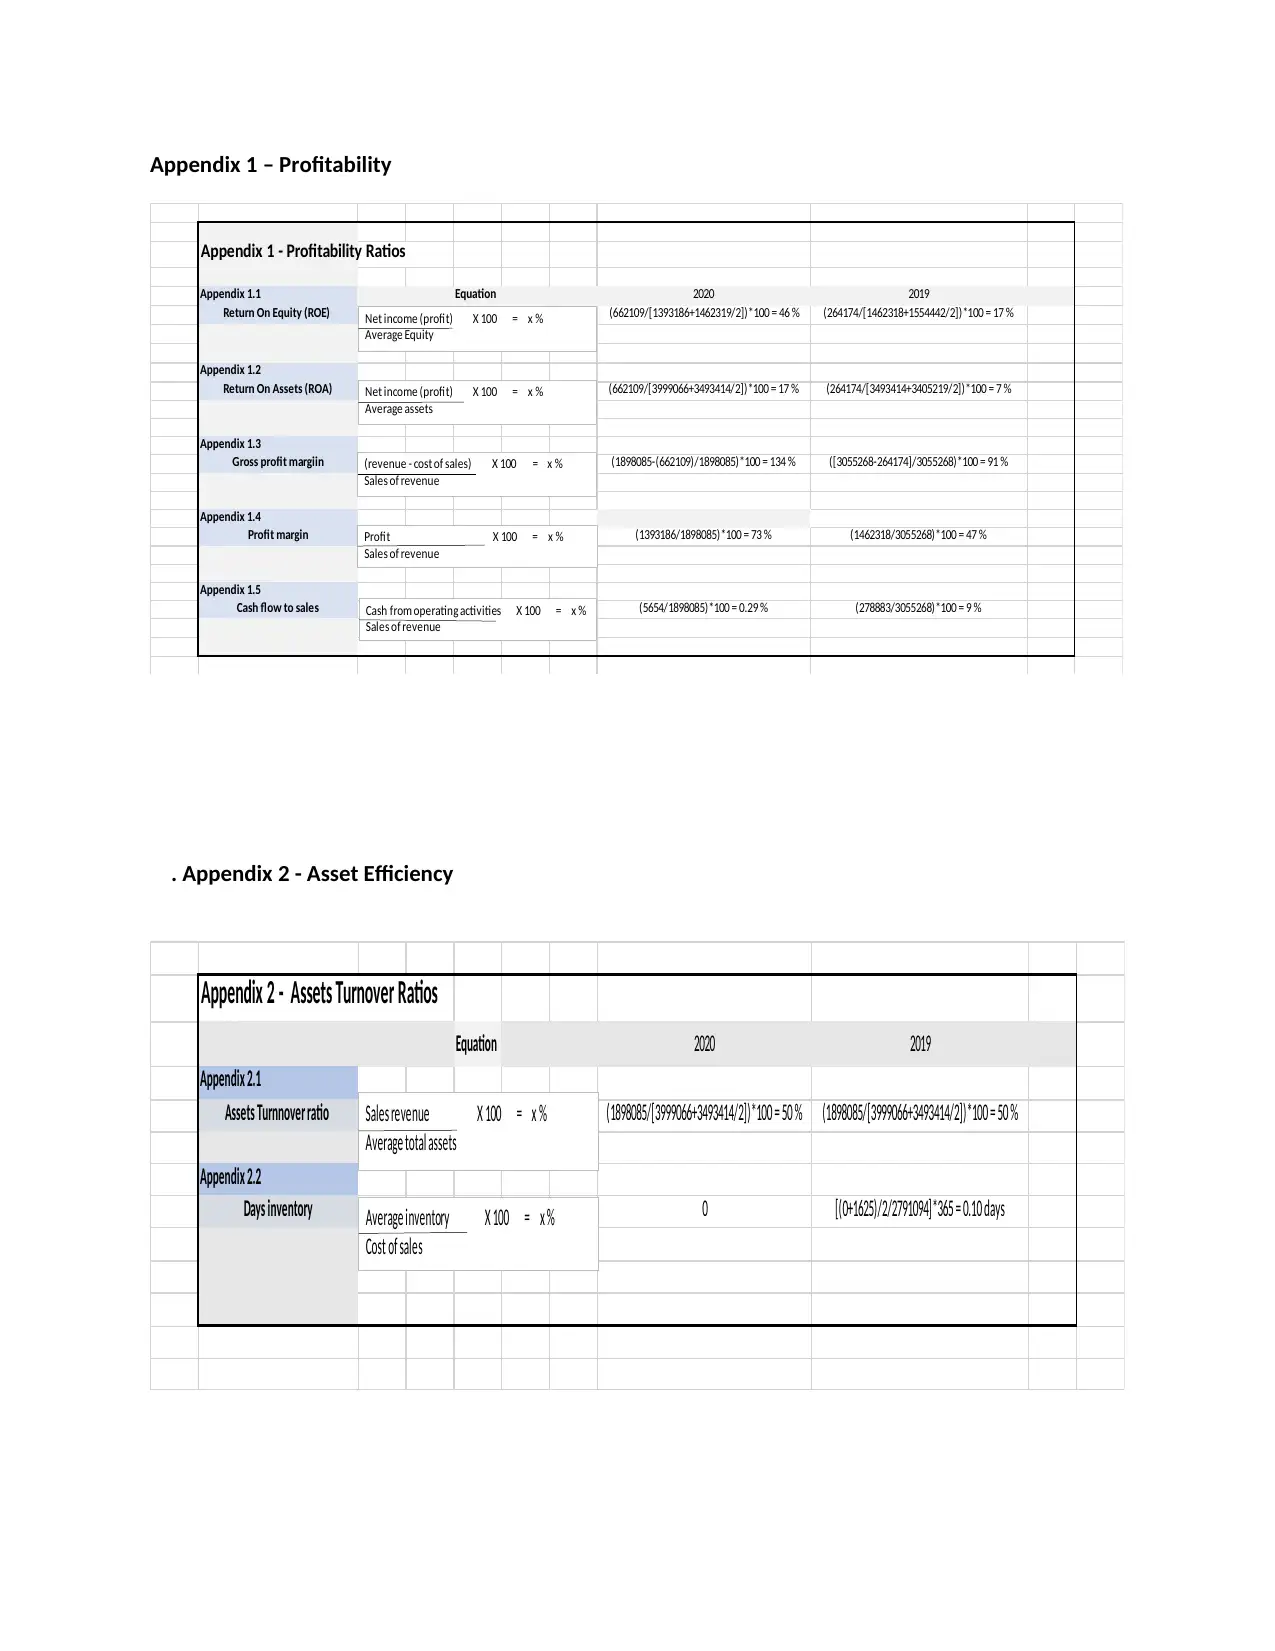
. Appendix 2 - Asset Efficiency
Appendix 2 - Assets Turnover Ratios
Equation 2020 2019
Appendix 2.1
Assets Turnnover ratio (1898085/[3999066+3493414/2])*100 = 50 % (1898085/[3999066+3493414/2])*100 = 50 %
Appendix 2.2
Days inventory 0 [(0+1625)/2/2791094]*365 = 0.10 days
Sales revenue X 100 = x %
Average total assets
Average inventory X 100 = x %
Cost of sales
Appendix 1 - Profitability Ratios
Appendix 1.1 Equation 2020 2019
Return On Equity (ROE) (662109/[1393186+1462319/2])*100 = 46 % (264174/[1462318+1554442/2])*100 = 17 %
Appendix 1.2
Return On Assets (ROA) (662109/[3999066+3493414/2])*100 = 17 % (264174/[3493414+3405219/2])*100 = 7 %
Appendix 1.3
Gross profit margiin (1898085-(662109)/1898085)*100 = 134 % ([3055268-264174]/3055268)*100 = 91 %
Appendix 1.4
Profit margin (1393186/1898085)*100 = 73 % (1462318/3055268)*100 = 47 %
Appendix 1.5
Cash flow to sales (5654/1898085)*100 = 0.29 % (278883/3055268)*100 = 9 %
Net income (profit) X 100 = x %
Average Equity
Net income (profit) X 100 = x %
Average assets
(revenue - cost of sales) X 100 = x %
Sales of revenue
Profit X 100 = x %
Sales of revenue
Cash from operating activities X 100 = x %
Sales of revenue
. Appendix 2 - Asset Efficiency
Appendix 2 - Assets Turnover Ratios
Equation 2020 2019
Appendix 2.1
Assets Turnnover ratio (1898085/[3999066+3493414/2])*100 = 50 % (1898085/[3999066+3493414/2])*100 = 50 %
Appendix 2.2
Days inventory 0 [(0+1625)/2/2791094]*365 = 0.10 days
Sales revenue X 100 = x %
Average total assets
Average inventory X 100 = x %
Cost of sales
⊘ This is a preview!⊘
Do you want full access?
Subscribe today to unlock all pages.
Trusted by 1+ million students worldwide
1 out of 16
Related Documents


Your All-in-One AI-Powered Toolkit for Academic Success.
+13062052269
info@desklib.com
Available 24*7 on WhatsApp / Email
![[object Object]](/_next/static/media/star-bottom.7253800d.svg)
Unlock your academic potential
Copyright © 2020–2026 A2Z Services. All Rights Reserved. Developed and managed by ZUCOL.