Financial Management Report: Flight Centre's Financial Analysis

Verified

Added on  2022/08/26

|9
|1288
|13
Report
AI Summary
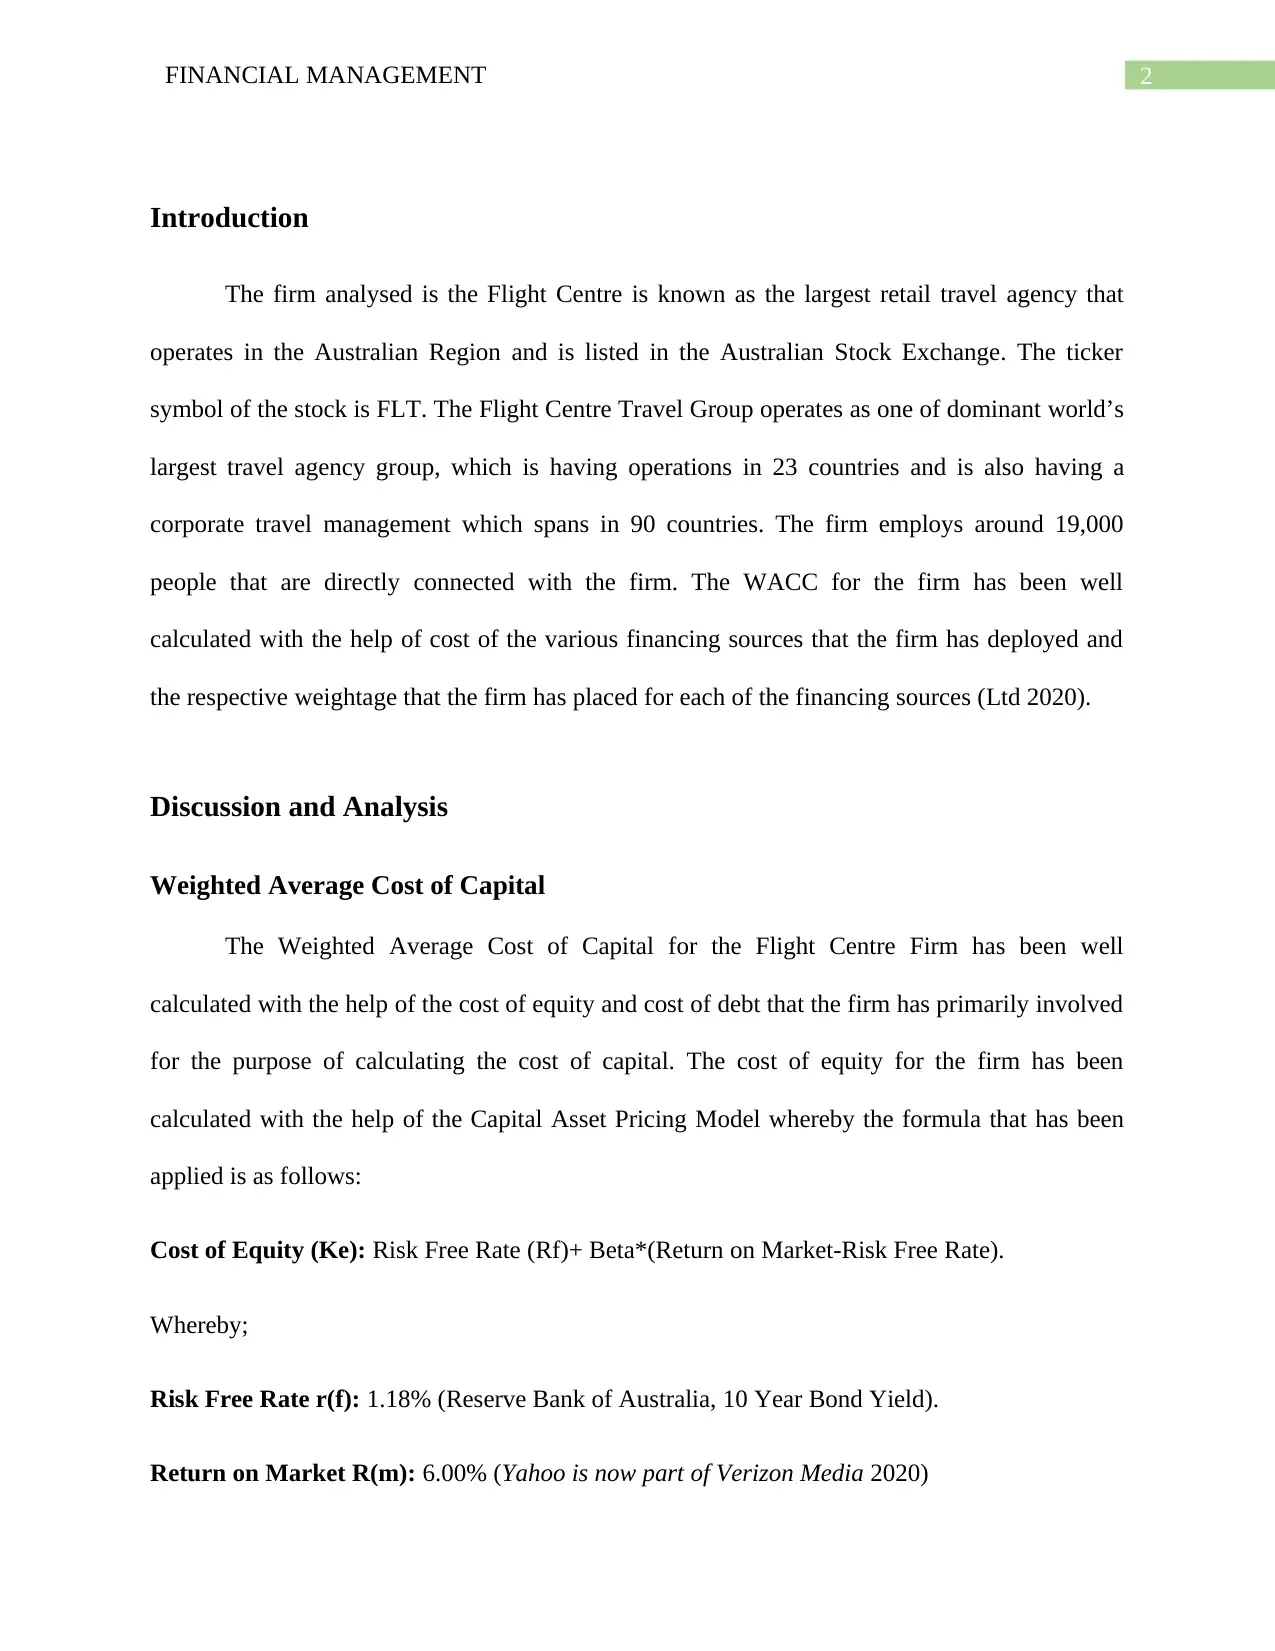
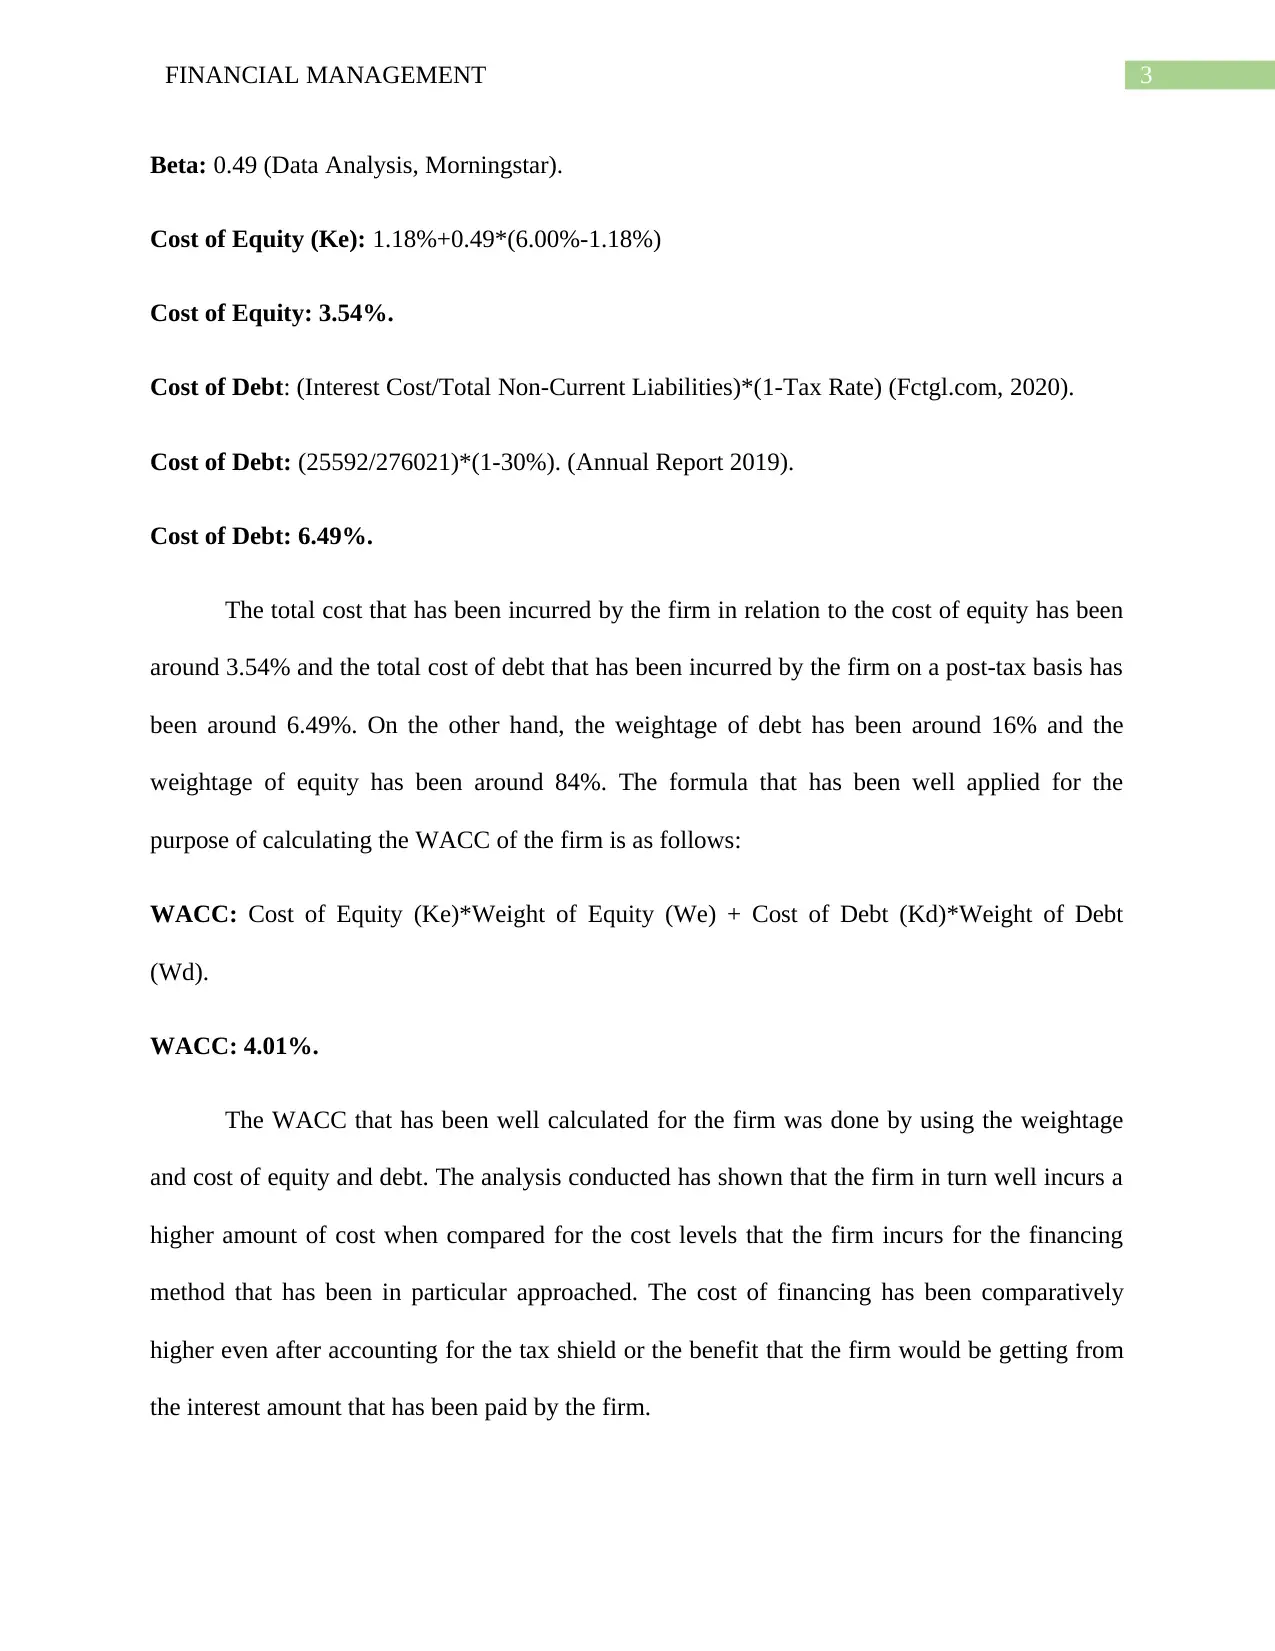
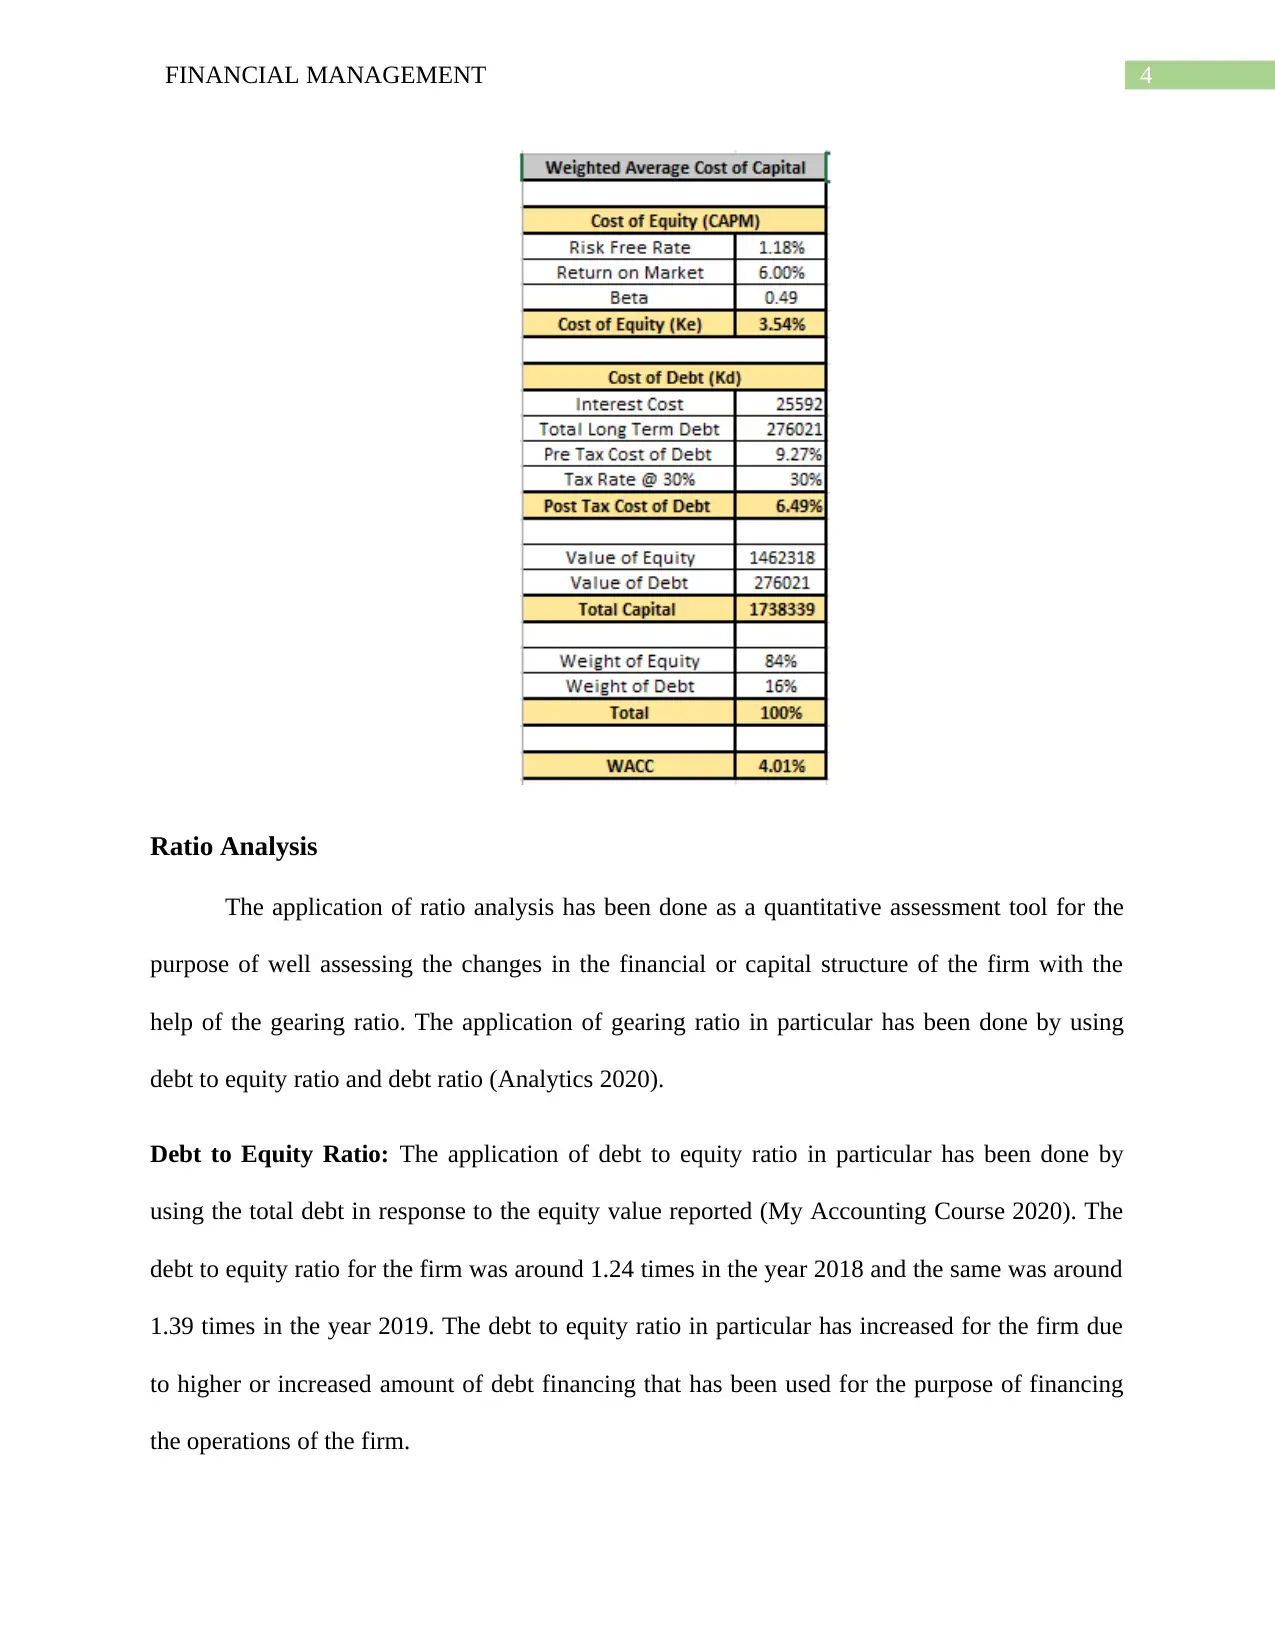
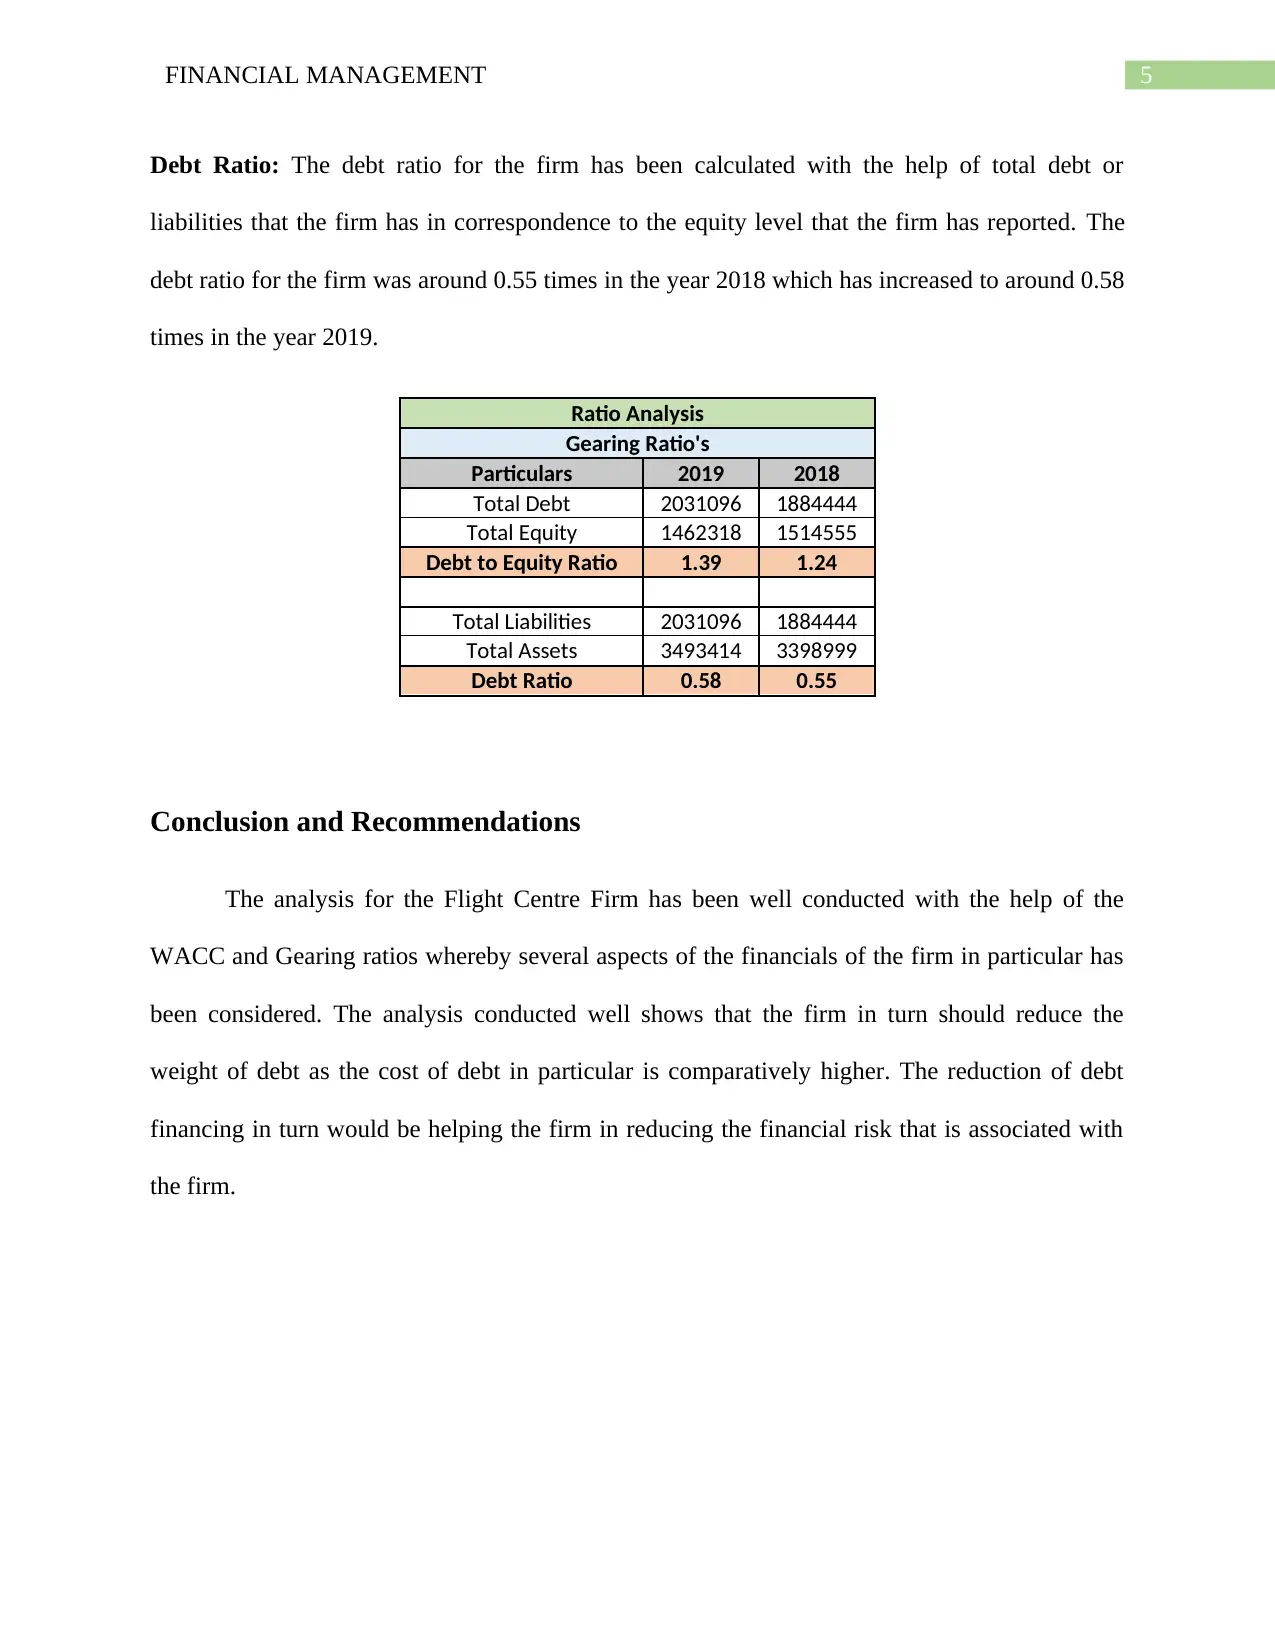
This financial management report provides an in-depth analysis of Flight Centre's financial performance. It begins with an introduction to the company, a major retail travel agency. The report calculates the Weighted Average Cost of Capital (WACC), considering the cost of equity (3.54%) and cost of debt (6.49%), leading to a WACC of 4.01%. It then employs ratio analysis, specifically focusing on the debt-to-equity ratio (increasing from 1.24 to 1.39) and the debt ratio (increasing from 0.55 to 0.58), to assess the company's capital structure. The analysis suggests that Flight Centre should consider reducing its debt weight to mitigate financial risk. The report references various sources, including financial data and academic papers, to support its findings.
tabler-icon-diamond-filled.svg

Contribute Materials

Your contribution can guide someone’s learning journey. Share your documents today.
Document Page
Running head: FINANCIAL MANAGEMENT
Financial Management
Name of the Student:
Name of the University:
Author’s Note:
tabler-icon-diamond-filled.svg

Secure Best Marks with AI Grader

Need help grading? Try our AI Grader for instant feedback on your assignments.
Document Page
1FINANCIAL MANAGEMENT
Table of Contents
Introduction......................................................................................................................................2
Discussion and Analysis..................................................................................................................2
Weighted Average Cost of Capital..............................................................................................2
Ratio Analysis..............................................................................................................................4
Conclusion and Recommendations..................................................................................................5
References........................................................................................................................................6
Document Page
2FINANCIAL MANAGEMENT
Introduction
The firm analysed is the Flight Centre is known as the largest retail travel agency that
operates in the Australian Region and is listed in the Australian Stock Exchange. The ticker
symbol of the stock is FLT. The Flight Centre Travel Group operates as one of dominant world’s
largest travel agency group, which is having operations in 23 countries and is also having a
corporate travel management which spans in 90 countries. The firm employs around 19,000
people that are directly connected with the firm. The WACC for the firm has been well
calculated with the help of cost of the various financing sources that the firm has deployed and
the respective weightage that the firm has placed for each of the financing sources (Ltd 2020).
Discussion and Analysis
Weighted Average Cost of Capital
The Weighted Average Cost of Capital for the Flight Centre Firm has been well
calculated with the help of the cost of equity and cost of debt that the firm has primarily involved
for the purpose of calculating the cost of capital. The cost of equity for the firm has been
calculated with the help of the Capital Asset Pricing Model whereby the formula that has been
applied is as follows:
Cost of Equity (Ke): Risk Free Rate (Rf)+ Beta*(Return on Market-Risk Free Rate).
Whereby;
Risk Free Rate r(f): 1.18% (Reserve Bank of Australia, 10 Year Bond Yield).
Return on Market R(m): 6.00% (Yahoo is now part of Verizon Media 2020)
Document Page
3FINANCIAL MANAGEMENT
Beta: 0.49 (Data Analysis, Morningstar).
Cost of Equity (Ke): 1.18%+0.49*(6.00%-1.18%)
Cost of Equity: 3.54%.
Cost of Debt: (Interest Cost/Total Non-Current Liabilities)*(1-Tax Rate) (Fctgl.com, 2020).
Cost of Debt: (25592/276021)*(1-30%). (Annual Report 2019).
Cost of Debt: 6.49%.
The total cost that has been incurred by the firm in relation to the cost of equity has been
around 3.54% and the total cost of debt that has been incurred by the firm on a post-tax basis has
been around 6.49%. On the other hand, the weightage of debt has been around 16% and the
weightage of equity has been around 84%. The formula that has been well applied for the
purpose of calculating the WACC of the firm is as follows:
WACC: Cost of Equity (Ke)*Weight of Equity (We) + Cost of Debt (Kd)*Weight of Debt
(Wd).
WACC: 4.01%.
The WACC that has been well calculated for the firm was done by using the weightage
and cost of equity and debt. The analysis conducted has shown that the firm in turn well incurs a
higher amount of cost when compared for the cost levels that the firm incurs for the financing
method that has been in particular approached. The cost of financing has been comparatively
higher even after accounting for the tax shield or the benefit that the firm would be getting from
the interest amount that has been paid by the firm.
tabler-icon-diamond-filled.svg

Secure Best Marks with AI Grader

Need help grading? Try our AI Grader for instant feedback on your assignments.
Document Page
4FINANCIAL MANAGEMENT
Ratio Analysis
The application of ratio analysis has been done as a quantitative assessment tool for the
purpose of well assessing the changes in the financial or capital structure of the firm with the
help of the gearing ratio. The application of gearing ratio in particular has been done by using
debt to equity ratio and debt ratio (Analytics 2020).
Debt to Equity Ratio: The application of debt to equity ratio in particular has been done by
using the total debt in response to the equity value reported (My Accounting Course 2020). The
debt to equity ratio for the firm was around 1.24 times in the year 2018 and the same was around
1.39 times in the year 2019. The debt to equity ratio in particular has increased for the firm due
to higher or increased amount of debt financing that has been used for the purpose of financing
the operations of the firm.
Document Page
5FINANCIAL MANAGEMENT
Debt Ratio: The debt ratio for the firm has been calculated with the help of total debt or
liabilities that the firm has in correspondence to the equity level that the firm has reported. The
debt ratio for the firm was around 0.55 times in the year 2018 which has increased to around 0.58
times in the year 2019.
Ratio Analysis
Gearing Ratio's
Particulars 2019 2018
Total Debt 2031096 1884444
Total Equity 1462318 1514555
Debt to Equity Ratio 1.39 1.24
Total Liabilities 2031096 1884444
Total Assets 3493414 3398999
Debt Ratio 0.58 0.55
Conclusion and Recommendations
The analysis for the Flight Centre Firm has been well conducted with the help of the
WACC and Gearing ratios whereby several aspects of the financials of the firm in particular has
been considered. The analysis conducted well shows that the firm in turn should reduce the
weight of debt as the cost of debt in particular is comparatively higher. The reduction of debt
financing in turn would be helping the firm in reducing the financial risk that is associated with
the firm.
Document Page
6FINANCIAL MANAGEMENT
References
Analytics, I. (2020). Flight Centre Travel Group Limited: Levered/Unlevered Beta (FLT | AUS |
Travel & Tourism) - Infront Analytics. Infrontanalytics.com. Retrieved 20 January 2020, from
https://www.infrontanalytics.com/fe-EN/30253AA/Flight-Centre-Travel-Group-Limited/beta
Boyas, E., & Teeter, R. (2017). Teaching Financial Ratio Analysis using XBRL.
In Developments in Business Simulation and Experiential Learning: Proceedings of the Annual
ABSEL conference (Vol. 44, No. 1).
Fctgl.com. (2020). [online] Available at:
http://www.fctgl.com/wp-content/uploads/2019/10/FLT-Annual-Report-FY19.pdf [Accessed 20
Jan. 2020].
Ltd, F. (2020). Flight Centre Travel Group Ltd (FLT) Quote | Morningstar. [online]
Morningstar.com. Available at: https://www.morningstar.com/stocks/xasx/flt/quote [Accessed 20
Jan. 2020].
My Accounting Course. (2020). Debt Ratio | Formula | Analysis | Example | My Accounting
Course. [online] Available at: https://www.myaccountingcourse.com/financial-ratios/debt-ratio
[Accessed 20 Jan. 2020].
Rakićević, A., Milošević, P., Petrović, B., & Radojević, D. G. (2016). DuPont financial ratio
analysis using logical aggregation. In Soft computing applications (pp. 727-739). Springer,
Cham.
tabler-icon-diamond-filled.svg

Paraphrase This Document

Need a fresh take? Get an instant paraphrase of this document with our AI Paraphraser
Document Page
7FINANCIAL MANAGEMENT
Setiawan, H., & Amboningtyas, D. (2018). FINANCIAL RATIO ANALYSIS FOR
PREDICTING FINANCIAL DISTRESS CONDITIONS (Study on Telecommunication
Companies Listed In Indonesia Stock Exchange Period 2010-2016). Journal of
Management, 4(4).
Yahoo is now part of Verizon Media. (2020). Finance.yahoo.com. Retrieved 20 January 2020,
from https://finance.yahoo.com/quote/flt.ax?ltr=1
Document Page
8FINANCIAL MANAGEMENT
Appendix
1) Share Price Data
Date Price Change (%) Date Price Change (%)
2/1/2015 41.26 2/1/2015 5898.5
3/1/2015 39.65 -3.90% 3/1/2015 5861.9 -0.62%
4/1/2015 43.43 9.53% 4/1/2015 5773.7 -1.50%
5/1/2015 46.55 7.18% 5/1/2015 5774.9 0.02%
6/1/2015 34.11 -26.72% 6/1/2015 5451.2 -5.61%
7/1/2015 35.62 4.43% 7/1/2015 5681.7 4.23%
8/1/2015 37.01 3.90% 8/1/2015 5222.1 -8.09%
9/1/2015 36.1 -2.46% 9/1/2015 5058.6 -3.13%
10/1/2015 37.95 5.12% 10/1/2015 5288.6 4.55%
11/1/2015 35.98 -5.19% 11/1/2015 5218.2 -1.33%
12/1/2015 39.89 10.87% 12/1/2015 5344.6 2.42%
1/1/2016 39.08 -2.03% 1/1/2016 5056.6 -5.39%
2/1/2016 41.4 5.94% 2/1/2016 4947.9 -2.15%
3/1/2016 43.23 4.42% 3/1/2016 5151.8 4.12%
4/1/2016 39.31 -9.07% 4/1/2016 5316 3.19%
5/1/2016 31.61 -19.59% 5/1/2016 5447.8 2.48%
6/1/2016 31.58 -0.09% 6/1/2016 5310.4 -2.52%
7/1/2016 32.19 1.93% 7/1/2016 5644 6.28%
8/1/2016 36.85 14.48% 8/1/2016 5529.4 -2.03%
9/1/2016 36.38 -1.28% 9/1/2016 5525.2 -0.08%
10/1/2016 33.87 -6.90% 10/1/2016 5402.4 -2.22%
11/1/2016 33.4 -1.39% 11/1/2016 5502.4 1.85%
12/1/2016 31.3 -6.29% 12/1/2016 5719.1 3.94%
1/1/2017 29.94 -4.35% 1/1/2017 5675 -0.77%
2/1/2017 28.84 -3.67% 2/1/2017 5761 1.52%
3/1/2017 28.88 0.14% 3/1/2017 5903.8 2.48%
4/1/2017 31.45 8.90% 4/1/2017 5947.6 0.74%
5/1/2017 35.76 13.70% 5/1/2017 5761.3 -3.13%
6/1/2017 38.3 7.10% 6/1/2017 5764 0.05%
7/1/2017 43.5 13.58% 7/1/2017 5773.9 0.17%
8/1/2017 48.35 11.15% 8/1/2017 5776.3 0.04%
9/1/2017 45.01 -6.91% 9/1/2017 5744.9 -0.54%
10/1/2017 46.8 3.98% 10/1/2017 5976.4 4.03%
11/1/2017 44.76 -4.36% 11/1/2017 6023.5 0.79%
12/1/2017 44.24 -1.16% 12/1/2017 6167.3 2.39%
1/1/2018 51.03 15.35% 1/1/2018 6146.5 -0.34%
2/1/2018 57.79 13.25% 2/1/2018 6117.3 -0.48%
3/1/2018 56.99 -1.38% 3/1/2018 5868.9 -4.06%
4/1/2018 55.9 -1.91% 4/1/2018 6071.6 3.45%
5/1/2018 61.62 10.23% 5/1/2018 6123.5 0.85%
6/1/2018 63.65 3.29% 6/1/2018 6289.7 2.71%
7/1/2018 68.01 6.85% 7/1/2018 6366.2 1.22%
8/1/2018 58.42 -14.10% 8/1/2018 6427.8 0.97%
9/1/2018 53.16 -9.00% 9/1/2018 6325.5 -1.59%
10/1/2018 46.4 -12.72% 10/1/2018 5913.3 -6.52%
11/1/2018 48.85 5.28% 11/1/2018 5749.3 -2.77%
12/1/2018 42.92 -12.14% 12/1/2018 5709.4 -0.69%
1/1/2019 43.03 0.26% 1/1/2019 5937.3 3.99%
2/1/2019 45.77 6.37% 2/1/2019 6252.7 5.31%
3/1/2019 42.05 -8.13% 3/1/2019 6261.7 0.14%
4/1/2019 38.4 -8.68% 4/1/2019 6418.4 2.50%
5/1/2019 43.59 13.52% 5/1/2019 6491.8 1.14%
6/1/2019 41.55 -4.68% 6/1/2019 6699.2 3.19%
7/1/2019 46.09 10.93% 7/1/2019 6896.7 2.95%
8/1/2019 46.51 0.91% 8/1/2019 6698.2 -2.88%
9/1/2019 47.6 2.34% 9/1/2019 6800.6 1.53%
10/1/2019 42.59 -10.53% 10/1/2019 6772.9 -0.41%
11/1/2019 44.03 3.38% 11/1/2019 6948 2.59%
12/1/2019 44.06 0.07% 12/1/2019 6802.4 -2.10%
1/1/2020 43.85 -0.48% 1/1/2020 7180.3 5.56%
1/20/2020 43.05 -1.82% 1/20/2020 7196.3 0.22%
Flight Centre Travel Share Price All Ordinary Share Index
chevron_up_icon
1 out of 9
circle_padding
hide_on_mobile
zoom_out_icon
logo.png

Your All-in-One AI-Powered Toolkit for Academic Success.

Available 24*7 on WhatsApp / Email

[object Object]