FBL5030: Fundamentals of Value Creation - FLT Financial Report
VerifiedAdded on 2023/06/04
|22
|4601
|75
Report
AI Summary
This report provides a detailed financial analysis of Flight Centre Travel Group Ltd (FLT), examining its performance over a five-year period (2014-2018). The analysis focuses on key financial ratios, including profitability ratios (net profit margin, return on equity, return on assets, and return on invested capital), liquidity ratios (current ratio and quick ratio), and solvency ratios. The report includes a comparative analysis with Webjet, a major competitor, to benchmark FLT's financial health. The study uses financial statements from the company's annual reports to compute and analyze these ratios, providing insights into FLT's revenue generation, ability to meet short-term obligations, and long-term financial stability. The report reveals trends and fluctuations in these ratios, offering a comprehensive view of FLT's financial position, and its ability to create value. The report also includes visual aids such as graphs and charts to support the analysis and interpretation of the financial data.
Running head: FUNDAMENTALS OF VALUE CREATION IN BUSINESS
Fundamentals of value creation in business
Name of the Student:
Name of the University:
Author’s Note:
Fundamentals of value creation in business
Name of the Student:
Name of the University:
Author’s Note:
Paraphrase This Document
Need a fresh take? Get an instant paraphrase of this document with our AI Paraphraser
FUNDAMENTALS OF VALUE CREATION OF BUSINESS
Executive Summary
The main purpose of this assessment is to analyze the financial statement of Flight Center Travel
Group Ltd. The analysis includes analysis of the financial statements for a period of five years
considering the performance of the business on the basis of the five years as shown in the annual
report of the business. The report considers key financial ratios computation and analysis for the
same. The analysis of key financial ratios of the business includes profitability ratios, solvency
ratios and liquidity ratios in relation to five years period considering the financial statements of
the company. In addition to this, the report also includes graphs and tables showing calculations
of some key ratios which are included in the profitability analysis, solvency analysis and
liquidity analysis.
FUNDAMENTALS OF VALUE CREATION OF BUSINESS
Table of Contents
Introduction......................................................................................................................................3
Profitability Analysis.......................................................................................................................4
Liquidity Analysis...........................................................................................................................9
Solvency Ratios.............................................................................................................................13
Conclusion.....................................................................................................................................18
References:....................................................................................................................................19
⊘ This is a preview!⊘
Do you want full access?
Subscribe today to unlock all pages.
Trusted by 1+ million students worldwide
FUNDAMENTALS OF VALUE CREATION OF BUSINESS
Introduction
The main purpose of this assessment is to analyze the financial statements of Flight
Center Travel Group Ltd which is engaged in providing flight services to the customers. The
report will be considering the financial information of the business which are taken for the
annual report of the company for a period of five years. The assessment will also be including
computation of key financial ratios of the business which are related to profitability, solvency
and liquidity aspects of the business. The report will also focus on analyzing the key financial
ratios of the company in order to interpret the performance of the company over the last five
years considering from 2014 to 2018.
Flight Center Travel Group Ltd is regarded as one of the largest outlets of retail travel
services which is provided in Australia. The company is known for its swift and smooth travel
services. The company was established in 1982 and has its headquarters in Brisbane, Australia.
As per recent estimates, the company has a turnover of 20 billion and contributes to the
employment needs of the economy by hiring and retaining more than 20000 employees around
its different areas of operations in total. The company has operations in around 23 countries and
has a travel management network which is over 90 countries around the Globe.
The assessment can be sub-divided into two parts which is calculation part where key
financial ratios are to be computed for the company and the analysis part which will be
explaining the position of the business in the market among the close competitors. The analysis
of ratios will also be determining the performance and growth of the business during the year.
The assessment will also be considering another company for the purpose of conducting a
comparative analysis which is known as Webjet. It is a significant competitor of FLT.The ratios
Paraphrase This Document
Need a fresh take? Get an instant paraphrase of this document with our AI Paraphraser
FUNDAMENTALS OF VALUE CREATION OF BUSINESS
will be computed which are related to solvency, liquidity and profitability of the business which
are analyzed for five years The purpose of this comparative analysis is to assess the financial
position of both businesses
Profitability Analysis
The profitability of the business considers the revenue generating capability of the
business from operational activities of the business. The profitability of the business is to be
determined with the help of key financial ratios which are net profit margin, return on assets,
return on equity and return on investments of the business(Lawrence, 2013). The ratios which are
considered for the analysis are considered to be key financial ratios of the business and are
indicators whether the business are in right tracks judging from the goals and objectives of the
business.
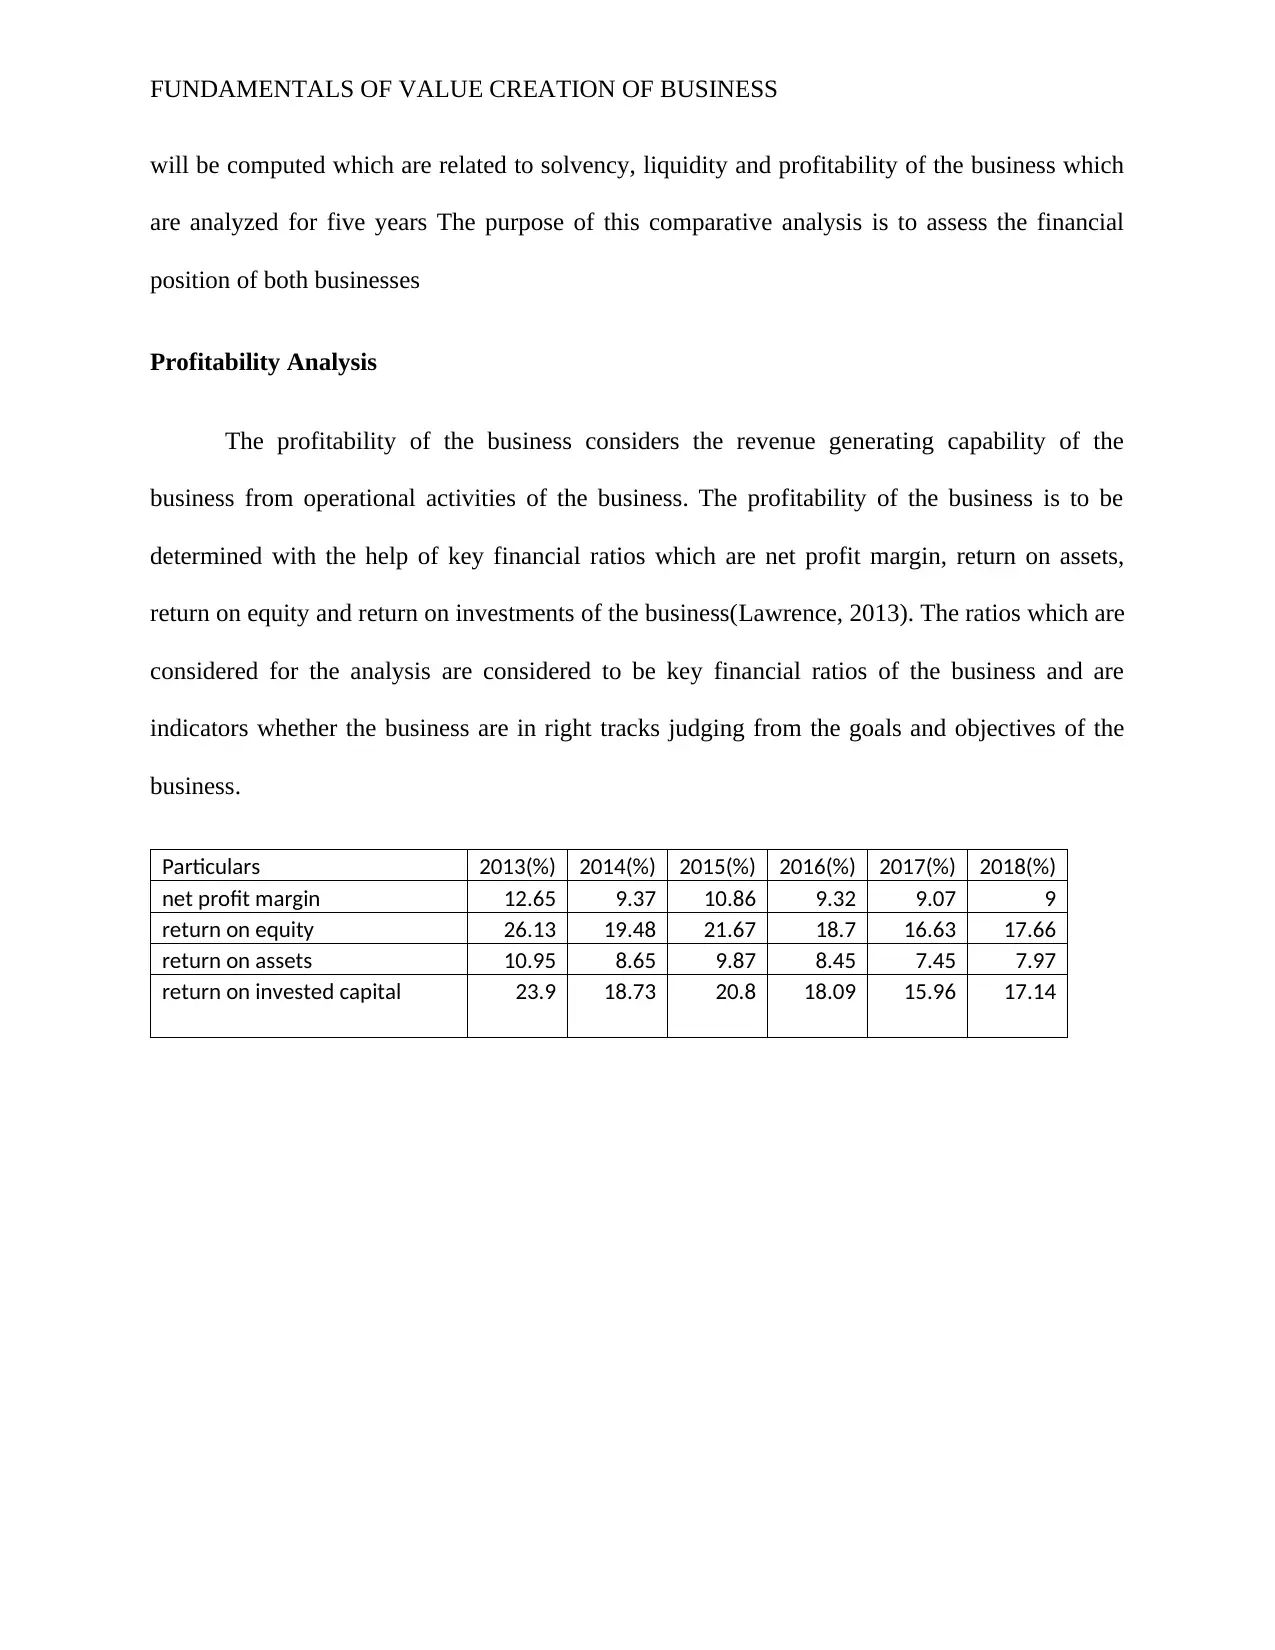
Particulars 2013(%) 2014(%) 2015(%) 2016(%) 2017(%) 2018(%)
net profit margin 12.65 9.37 10.86 9.32 9.07 9
return on equity 26.13 19.48 21.67 18.7 16.63 17.66
return on assets 10.95 8.65 9.87 8.45 7.45 7.97
return on invested capital 23.9 18.73 20.8 18.09 15.96 17.14
will be computed which are related to solvency, liquidity and profitability of the business which
are analyzed for five years The purpose of this comparative analysis is to assess the financial
position of both businesses
Profitability Analysis
The profitability of the business considers the revenue generating capability of the
business from operational activities of the business. The profitability of the business is to be
determined with the help of key financial ratios which are net profit margin, return on assets,
return on equity and return on investments of the business(Lawrence, 2013). The ratios which are
considered for the analysis are considered to be key financial ratios of the business and are
indicators whether the business are in right tracks judging from the goals and objectives of the
business.
Particulars 2013(%) 2014(%) 2015(%) 2016(%) 2017(%) 2018(%)
net profit margin 12.65 9.37 10.86 9.32 9.07 9
return on equity 26.13 19.48 21.67 18.7 16.63 17.66
return on assets 10.95 8.65 9.87 8.45 7.45 7.97
return on invested capital 23.9 18.73 20.8 18.09 15.96 17.14
FUNDAMENTALS OF VALUE CREATION OF BUSINESS
9
17.66
7.97
17.14
2018
net profit margin return on equity
return on assets return on invested capital
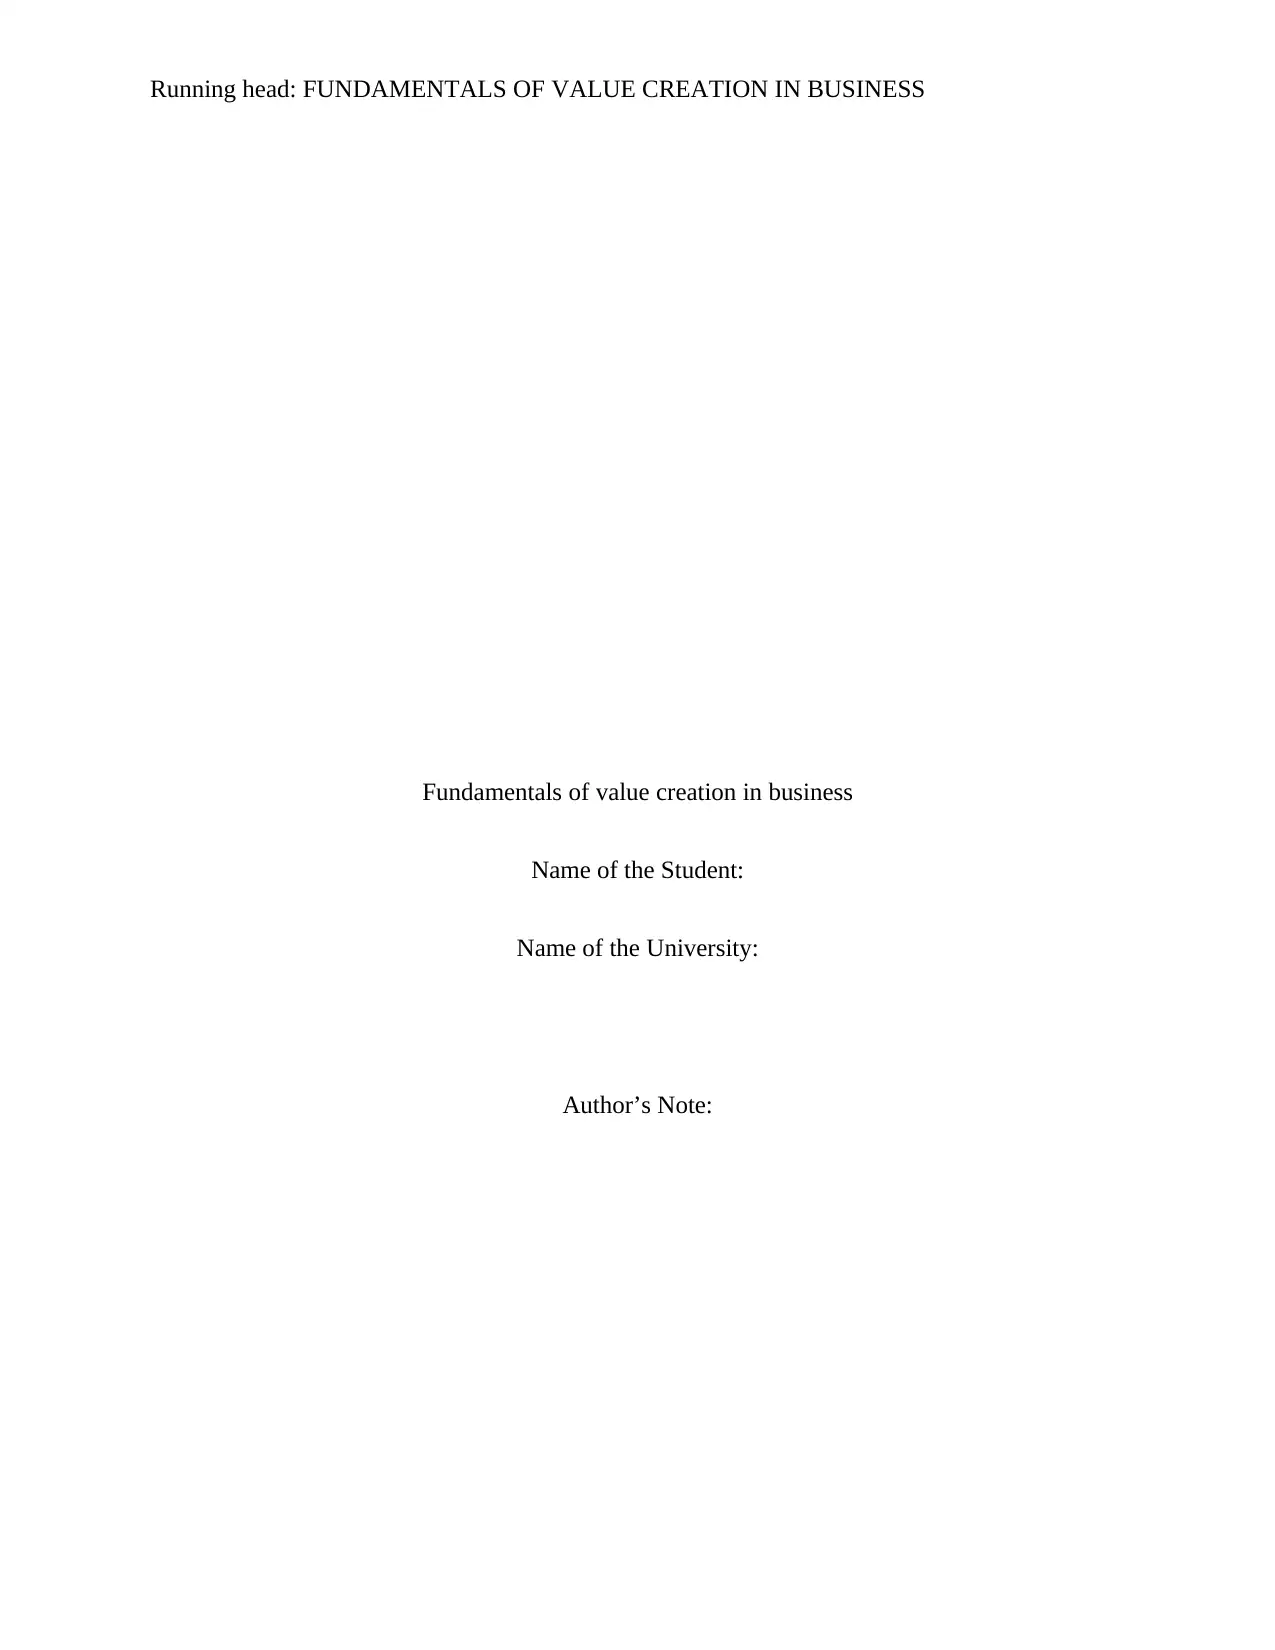
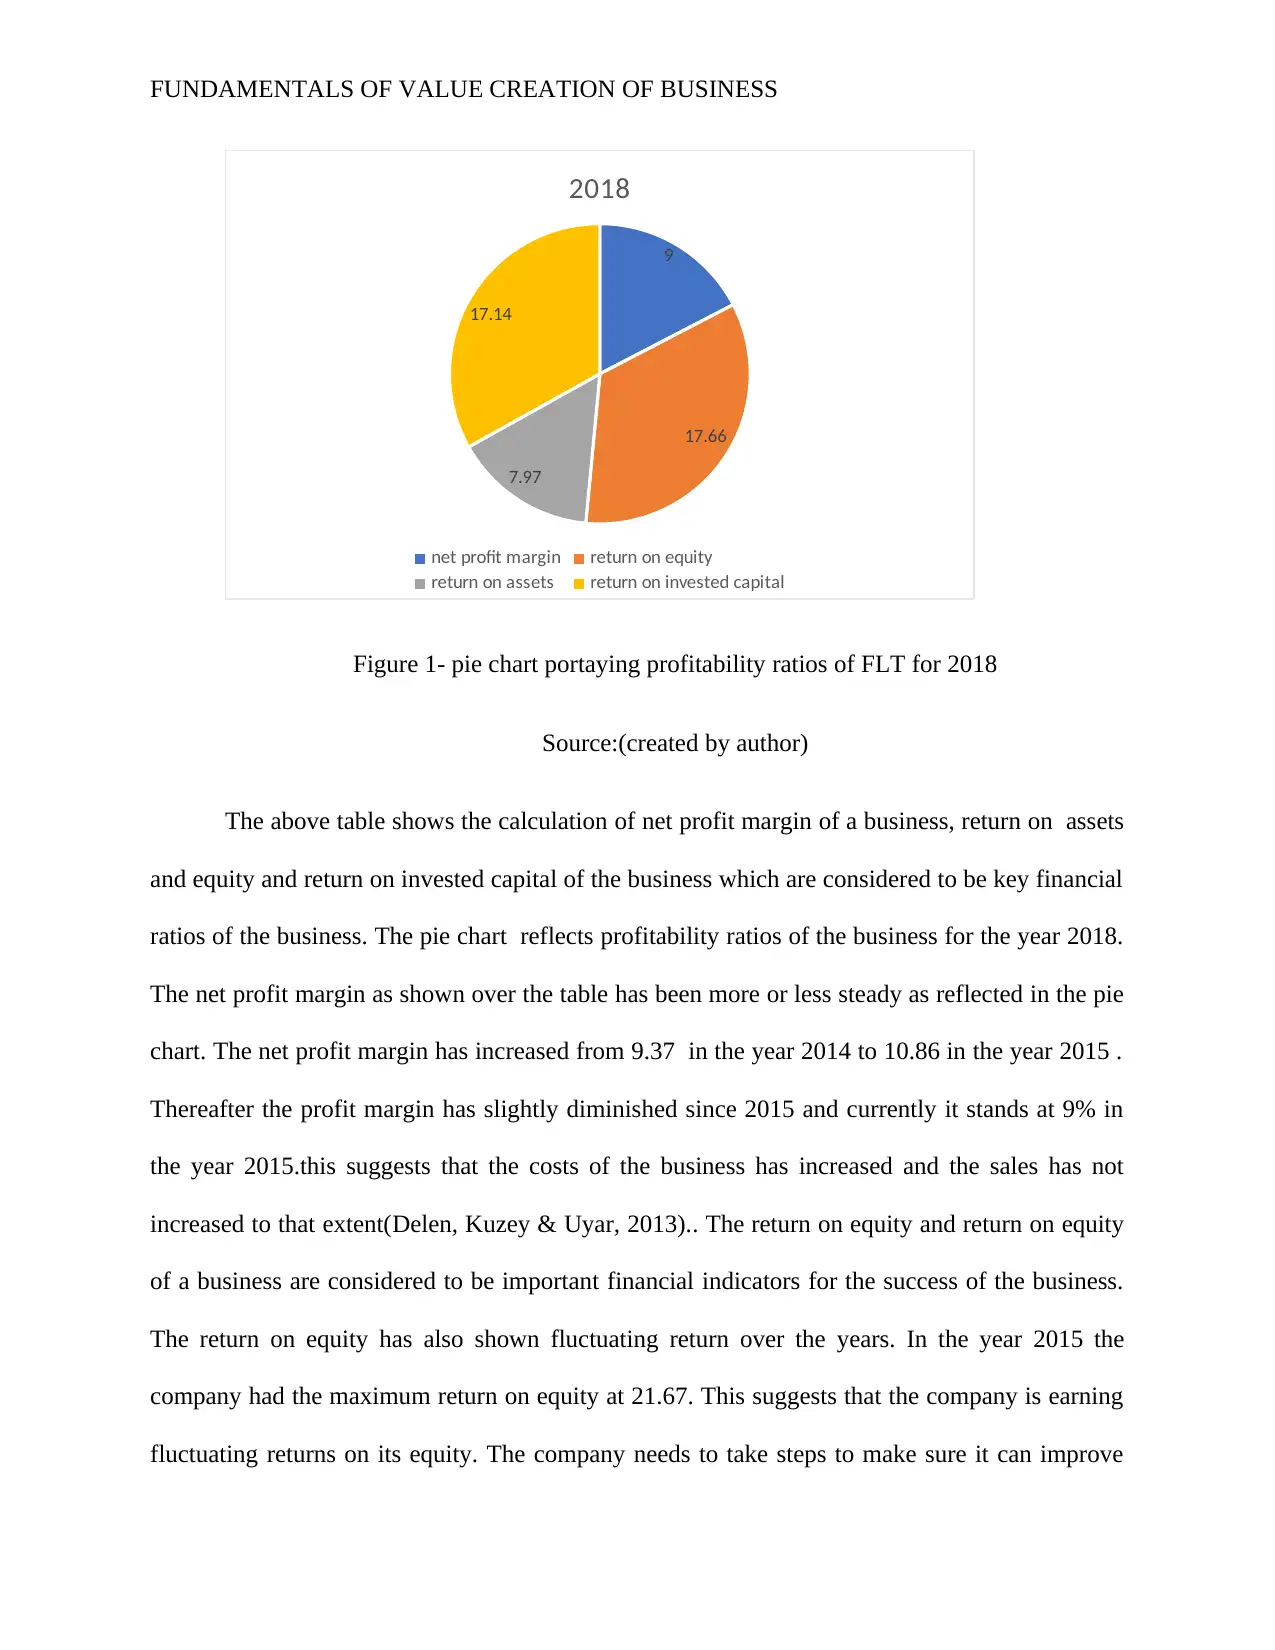
Figure 1- pie chart portaying profitability ratios of FLT for 2018
Source:(created by author)
The above table shows the calculation of net profit margin of a business, return on assets
and equity and return on invested capital of the business which are considered to be key financial
ratios of the business. The pie chart reflects profitability ratios of the business for the year 2018.
The net profit margin as shown over the table has been more or less steady as reflected in the pie
chart. The net profit margin has increased from 9.37 in the year 2014 to 10.86 in the year 2015 .
Thereafter the profit margin has slightly diminished since 2015 and currently it stands at 9% in
the year 2015.this suggests that the costs of the business has increased and the sales has not
increased to that extent(Delen, Kuzey & Uyar, 2013).. The return on equity and return on equity
of a business are considered to be important financial indicators for the success of the business.
The return on equity has also shown fluctuating return over the years. In the year 2015 the
company had the maximum return on equity at 21.67. This suggests that the company is earning
fluctuating returns on its equity. The company needs to take steps to make sure it can improve
9
17.66
7.97
17.14
2018
net profit margin return on equity
return on assets return on invested capital
Figure 1- pie chart portaying profitability ratios of FLT for 2018
Source:(created by author)
The above table shows the calculation of net profit margin of a business, return on assets
and equity and return on invested capital of the business which are considered to be key financial
ratios of the business. The pie chart reflects profitability ratios of the business for the year 2018.
The net profit margin as shown over the table has been more or less steady as reflected in the pie
chart. The net profit margin has increased from 9.37 in the year 2014 to 10.86 in the year 2015 .
Thereafter the profit margin has slightly diminished since 2015 and currently it stands at 9% in
the year 2015.this suggests that the costs of the business has increased and the sales has not
increased to that extent(Delen, Kuzey & Uyar, 2013).. The return on equity and return on equity
of a business are considered to be important financial indicators for the success of the business.
The return on equity has also shown fluctuating return over the years. In the year 2015 the
company had the maximum return on equity at 21.67. This suggests that the company is earning
fluctuating returns on its equity. The company needs to take steps to make sure it can improve
⊘ This is a preview!⊘
Do you want full access?
Subscribe today to unlock all pages.
Trusted by 1+ million students worldwide
FUNDAMENTALS OF VALUE CREATION OF BUSINESS
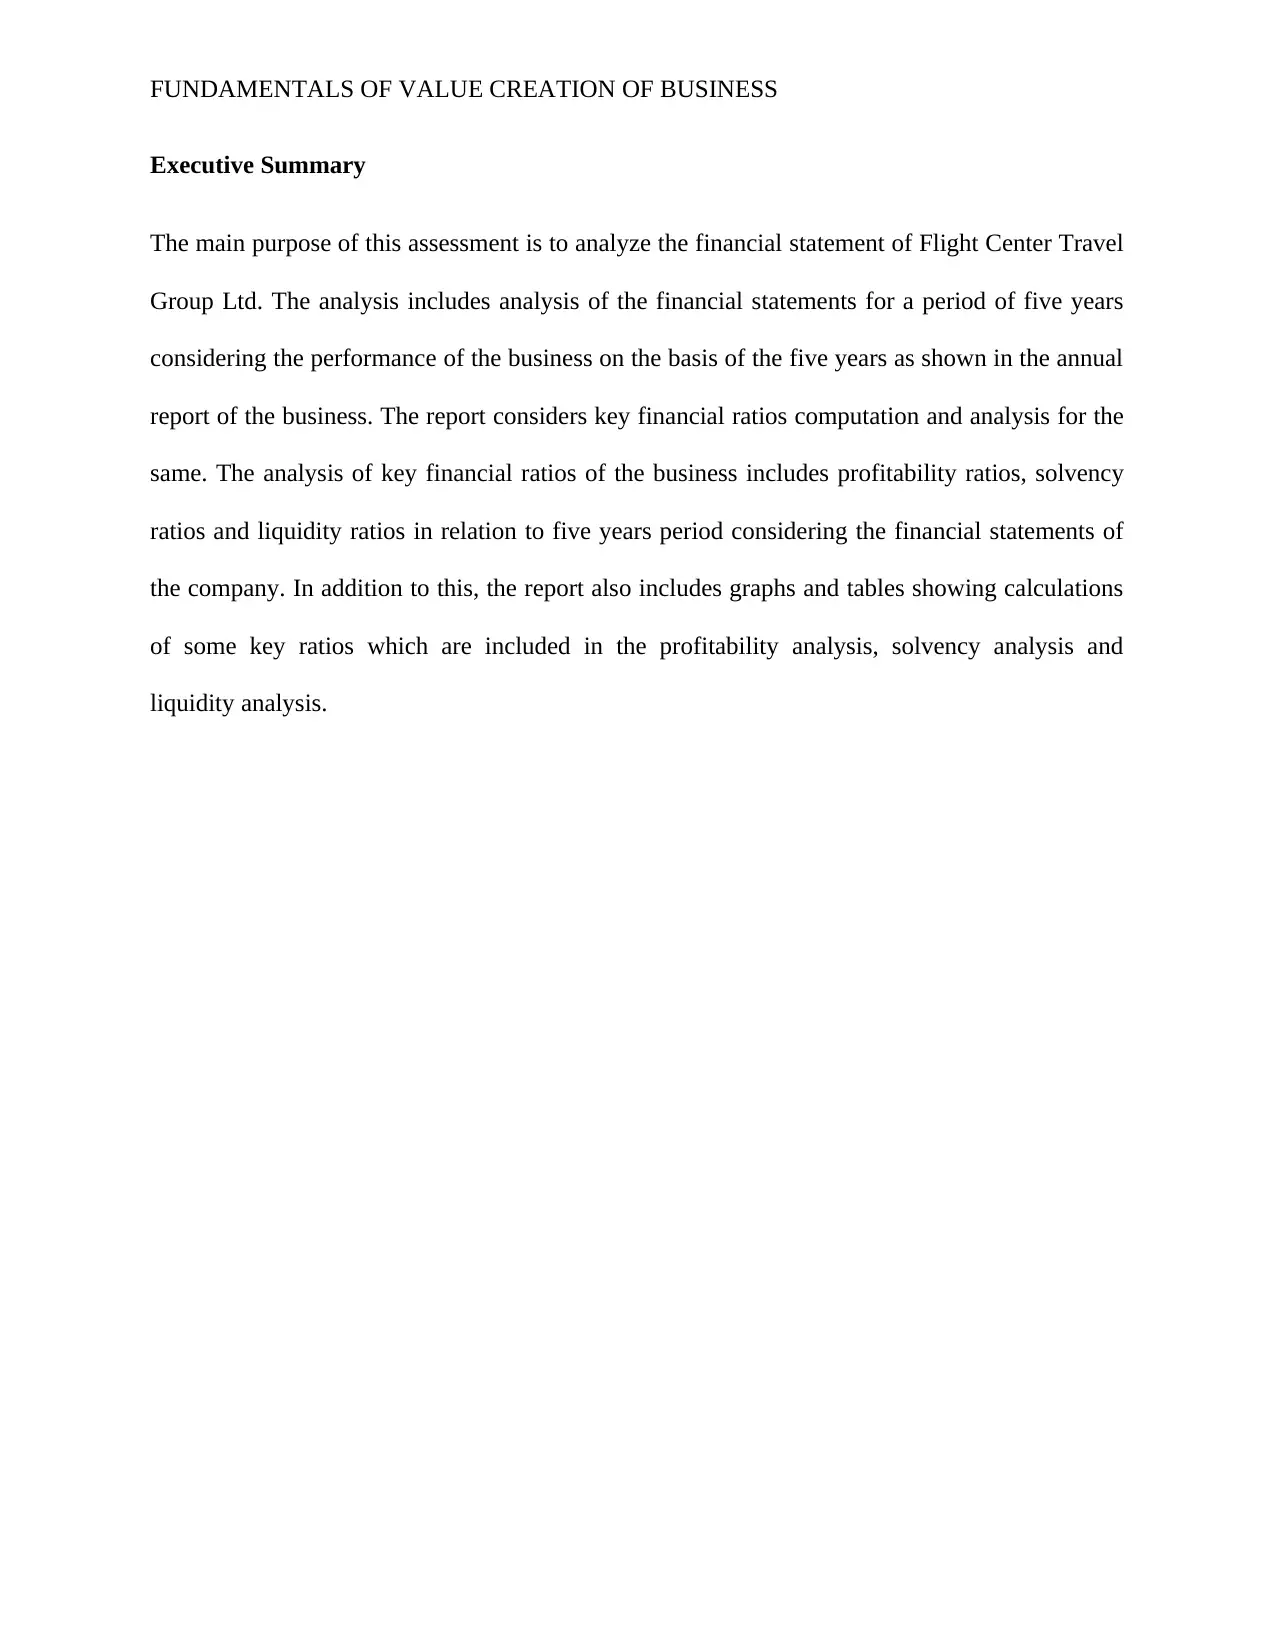
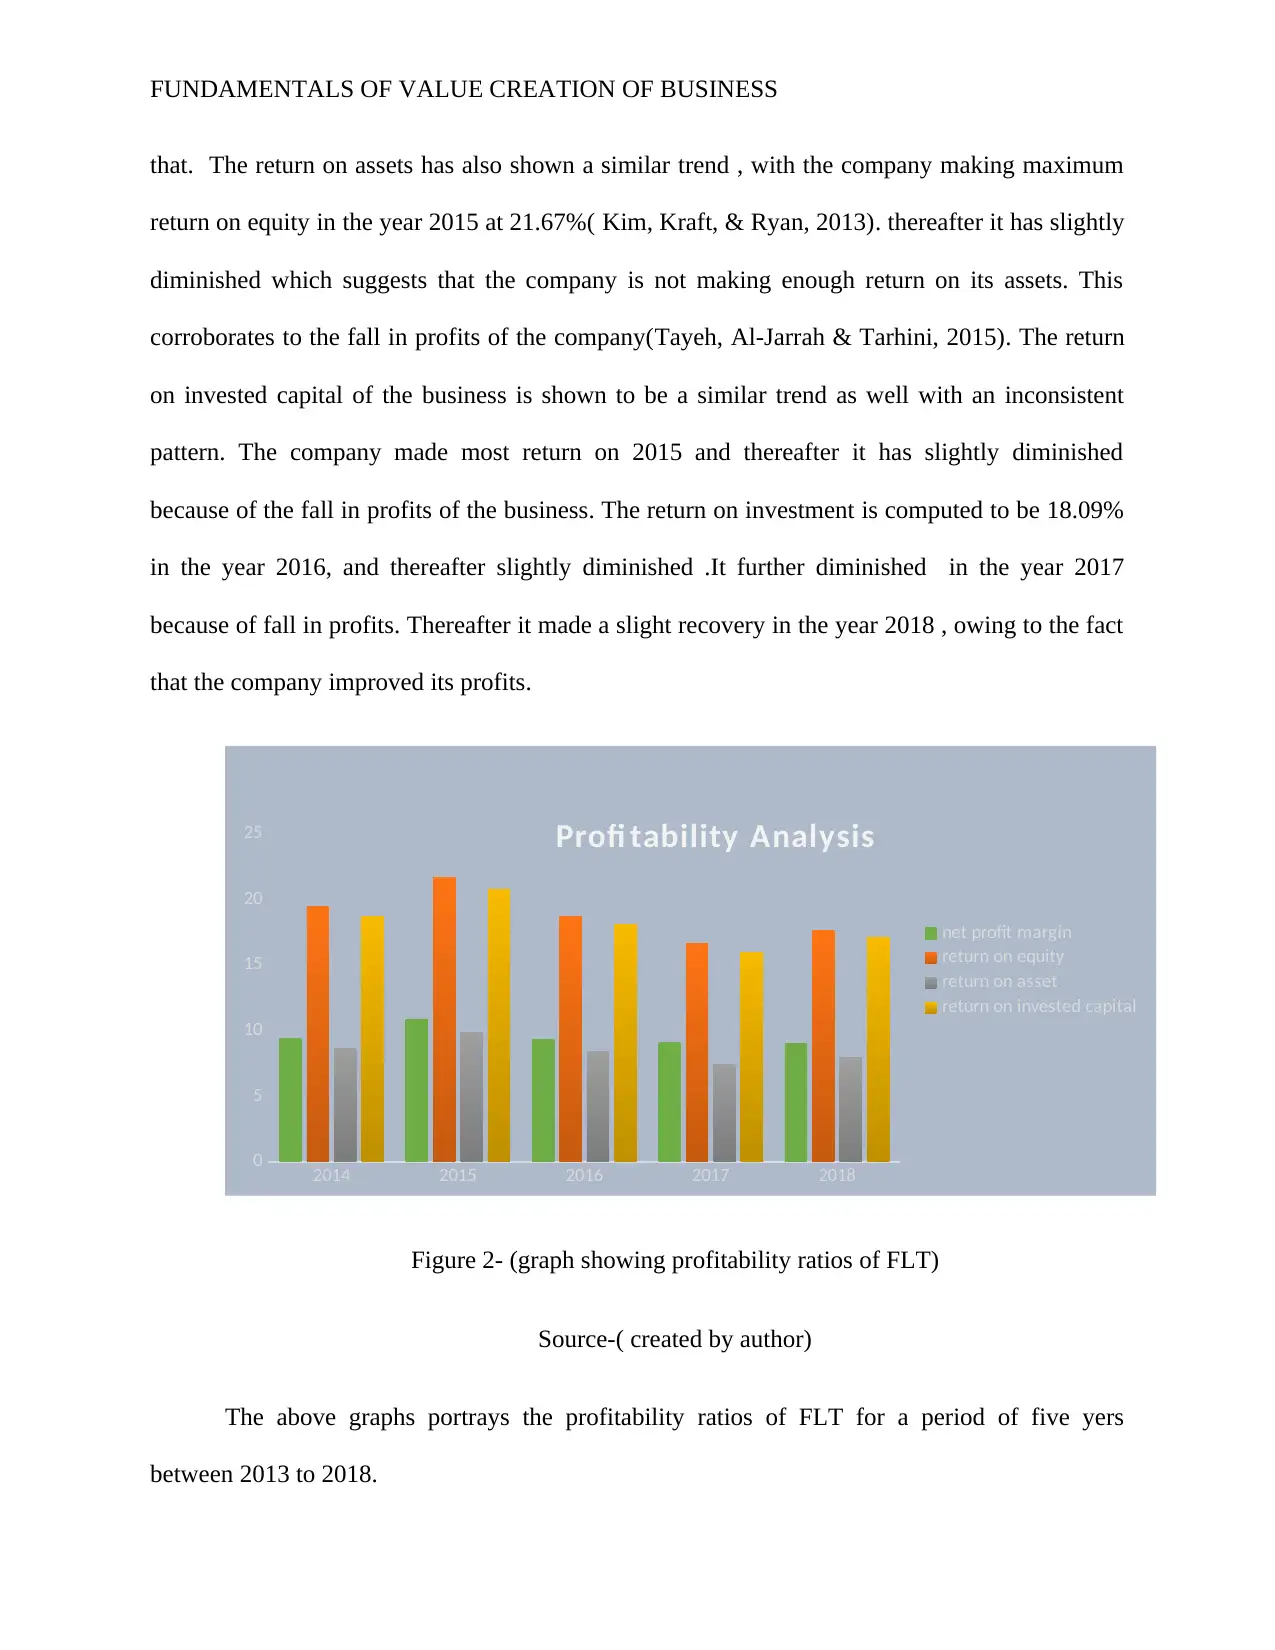
that. The return on assets has also shown a similar trend , with the company making maximum
return on equity in the year 2015 at 21.67%( Kim, Kraft, & Ryan, 2013). thereafter it has slightly
diminished which suggests that the company is not making enough return on its assets. This
corroborates to the fall in profits of the company(Tayeh, Al-Jarrah & Tarhini, 2015). The return
on invested capital of the business is shown to be a similar trend as well with an inconsistent
pattern. The company made most return on 2015 and thereafter it has slightly diminished
because of the fall in profits of the business. The return on investment is computed to be 18.09%
in the year 2016, and thereafter slightly diminished .It further diminished in the year 2017
because of fall in profits. Thereafter it made a slight recovery in the year 2018 , owing to the fact
that the company improved its profits.
2014 2015 2016 2017 2018
0
5
10
15
20
25 Profi tability Analysis
net profit margin
return on equity
return on asset
return on invested capital
Figure 2- (graph showing profitability ratios of FLT)
Source-( created by author)
The above graphs portrays the profitability ratios of FLT for a period of five yers
between 2013 to 2018.
Paraphrase This Document
Need a fresh take? Get an instant paraphrase of this document with our AI Paraphraser
FUNDAMENTALS OF VALUE CREATION OF BUSINESS
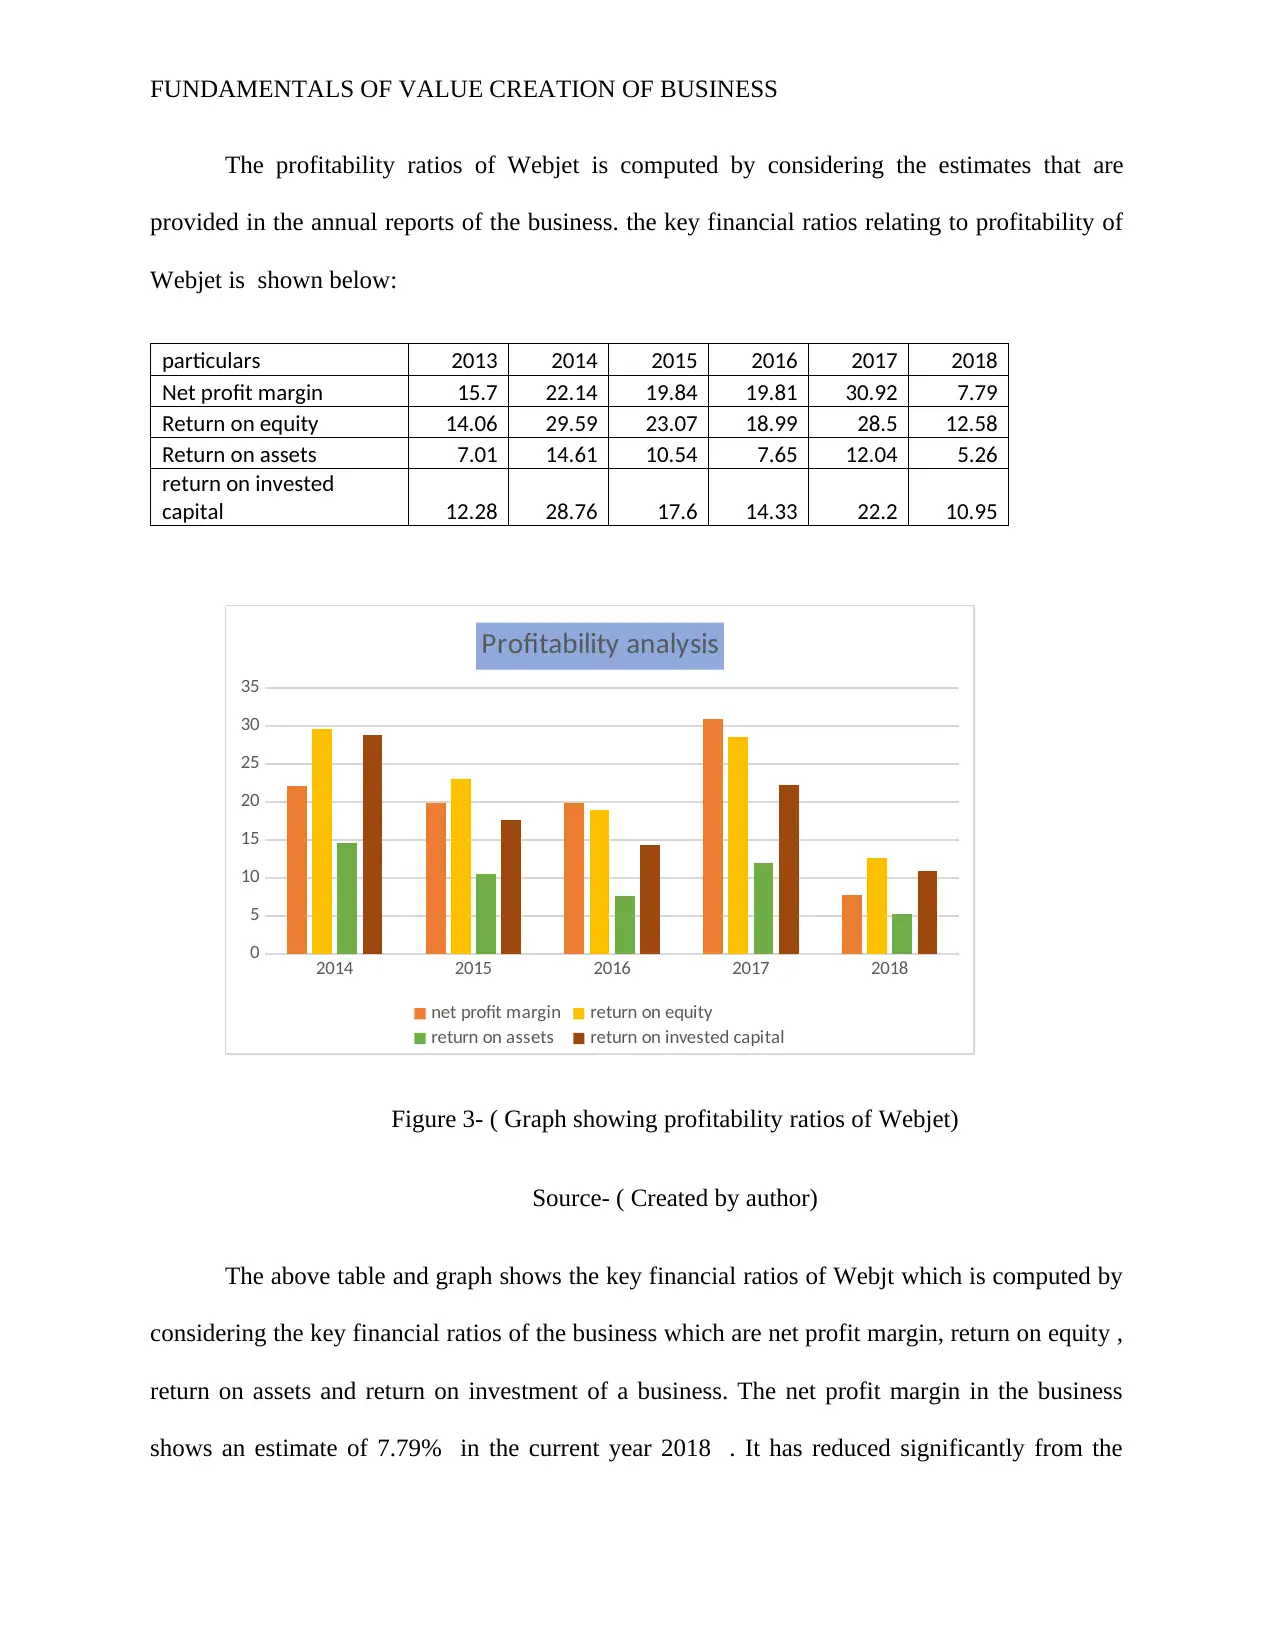
The profitability ratios of Webjet is computed by considering the estimates that are
provided in the annual reports of the business. the key financial ratios relating to profitability of
Webjet is shown below:
particulars 2013 2014 2015 2016 2017 2018
Net profit margin 15.7 22.14 19.84 19.81 30.92 7.79
Return on equity 14.06 29.59 23.07 18.99 28.5 12.58
Return on assets 7.01 14.61 10.54 7.65 12.04 5.26
return on invested
capital 12.28 28.76 17.6 14.33 22.2 10.95
2014 2015 2016 2017 2018
0
5
10
15
20
25
30
35
Profitability analysis
net profit margin return on equity
return on assets return on invested capital
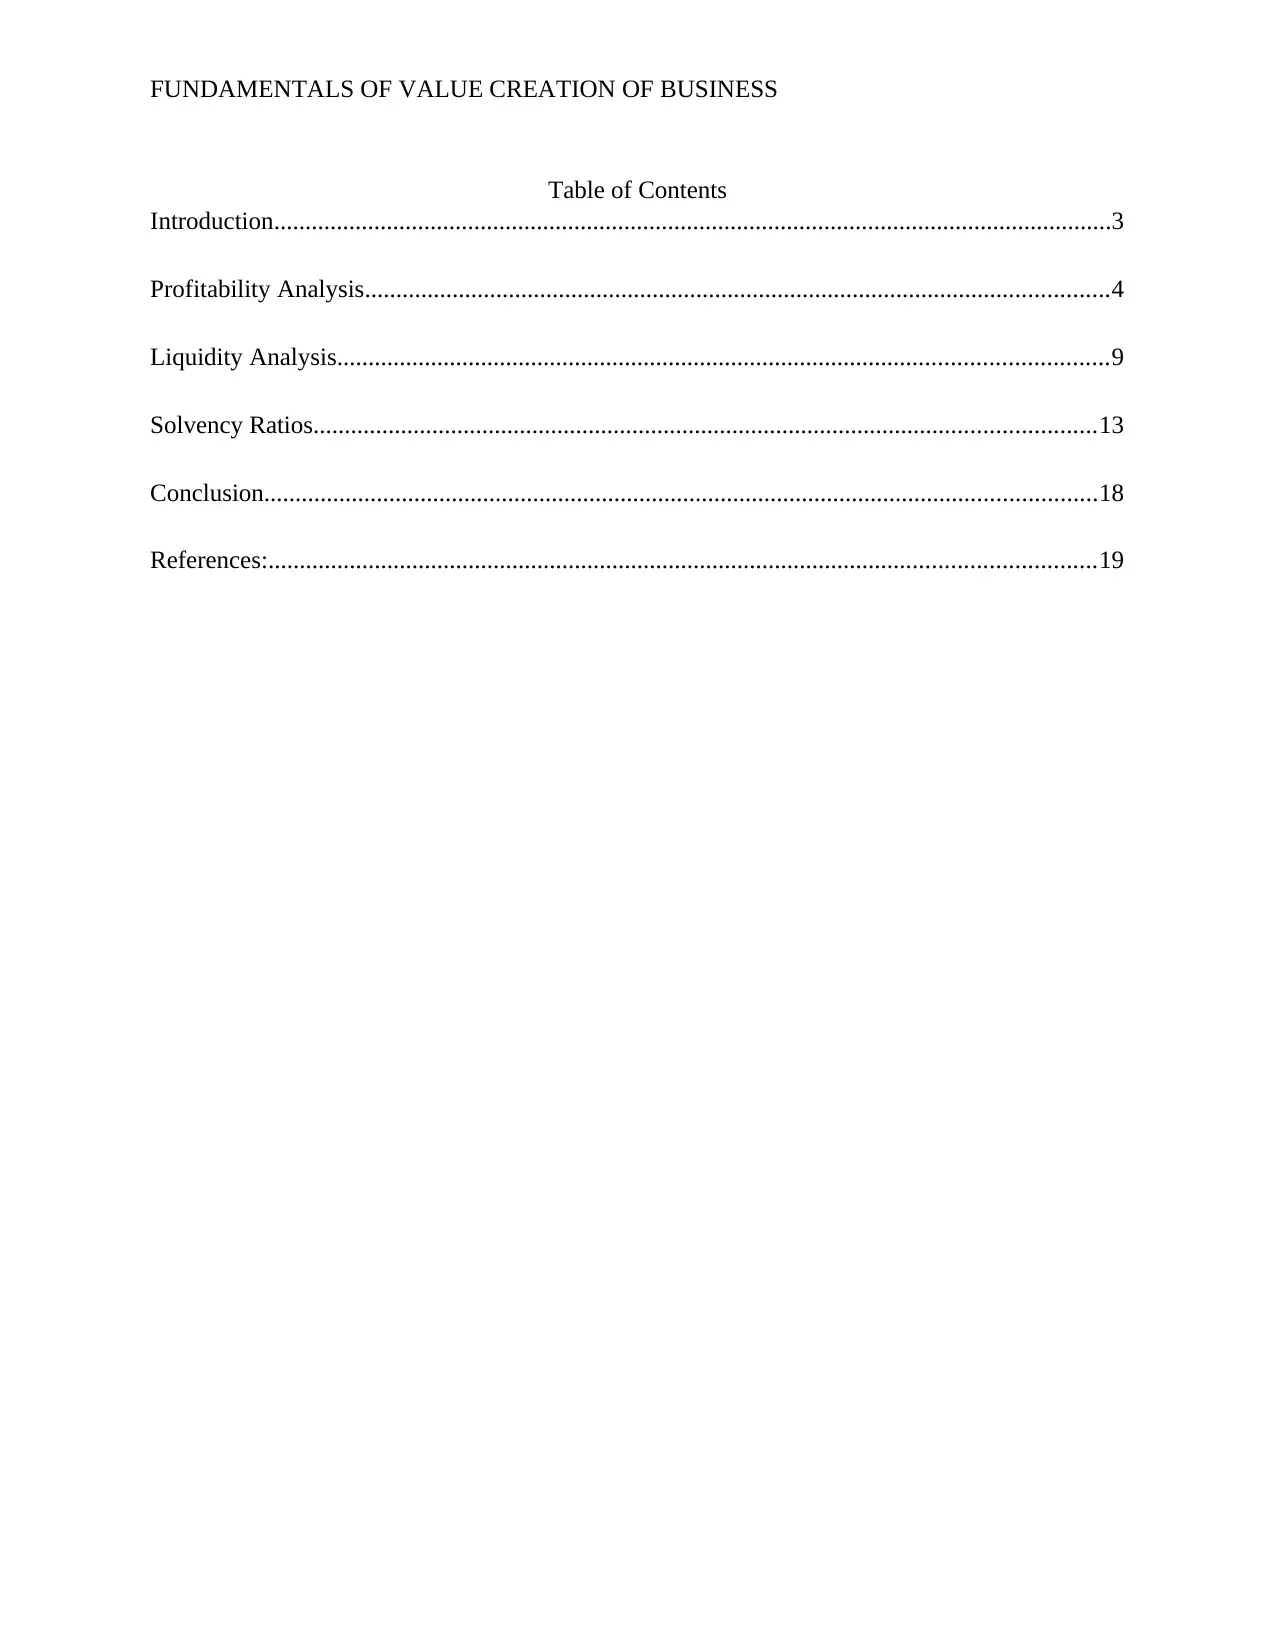
Figure 3- ( Graph showing profitability ratios of Webjet)
Source- ( Created by author)
The above table and graph shows the key financial ratios of Webjt which is computed by
considering the key financial ratios of the business which are net profit margin, return on equity ,
return on assets and return on investment of a business. The net profit margin in the business
shows an estimate of 7.79% in the current year 2018 . It has reduced significantly from the
The profitability ratios of Webjet is computed by considering the estimates that are
provided in the annual reports of the business. the key financial ratios relating to profitability of
Webjet is shown below:
particulars 2013 2014 2015 2016 2017 2018
Net profit margin 15.7 22.14 19.84 19.81 30.92 7.79
Return on equity 14.06 29.59 23.07 18.99 28.5 12.58
Return on assets 7.01 14.61 10.54 7.65 12.04 5.26
return on invested
capital 12.28 28.76 17.6 14.33 22.2 10.95
2014 2015 2016 2017 2018
0
5
10
15
20
25
30
35
Profitability analysis
net profit margin return on equity
return on assets return on invested capital
Figure 3- ( Graph showing profitability ratios of Webjet)
Source- ( Created by author)
The above table and graph shows the key financial ratios of Webjt which is computed by
considering the key financial ratios of the business which are net profit margin, return on equity ,
return on assets and return on investment of a business. The net profit margin in the business
shows an estimate of 7.79% in the current year 2018 . It has reduced significantly from the
FUNDAMENTALS OF VALUE CREATION OF BUSINESS
previous year . which was shown at 30.92% .The reasons for this is due to the fact that the costs
have gone up significantly or the sales have been reduced significantly. The return on equity has
increased significantly in the year 2014, with its maximum of 29.59% achieved by that year. In
the coming years it has shown that it has an inconsistent pattern with the significant reduction in
the year 2018 from 2017. It reduced from 28.5 % to 12.58% in the year from 2017 to 2018. the
return on assets has shown an increasing trend followed by a decreasing trend in the five years.
This is due to a fall in the profits of a company(Elshandidy, T., Fraser & Hussainey, 2013) .
Comparative Analysis
Net profit margin
7
7.5
8
8.5
9
9.5
Net profit margin
WEBJET FTL
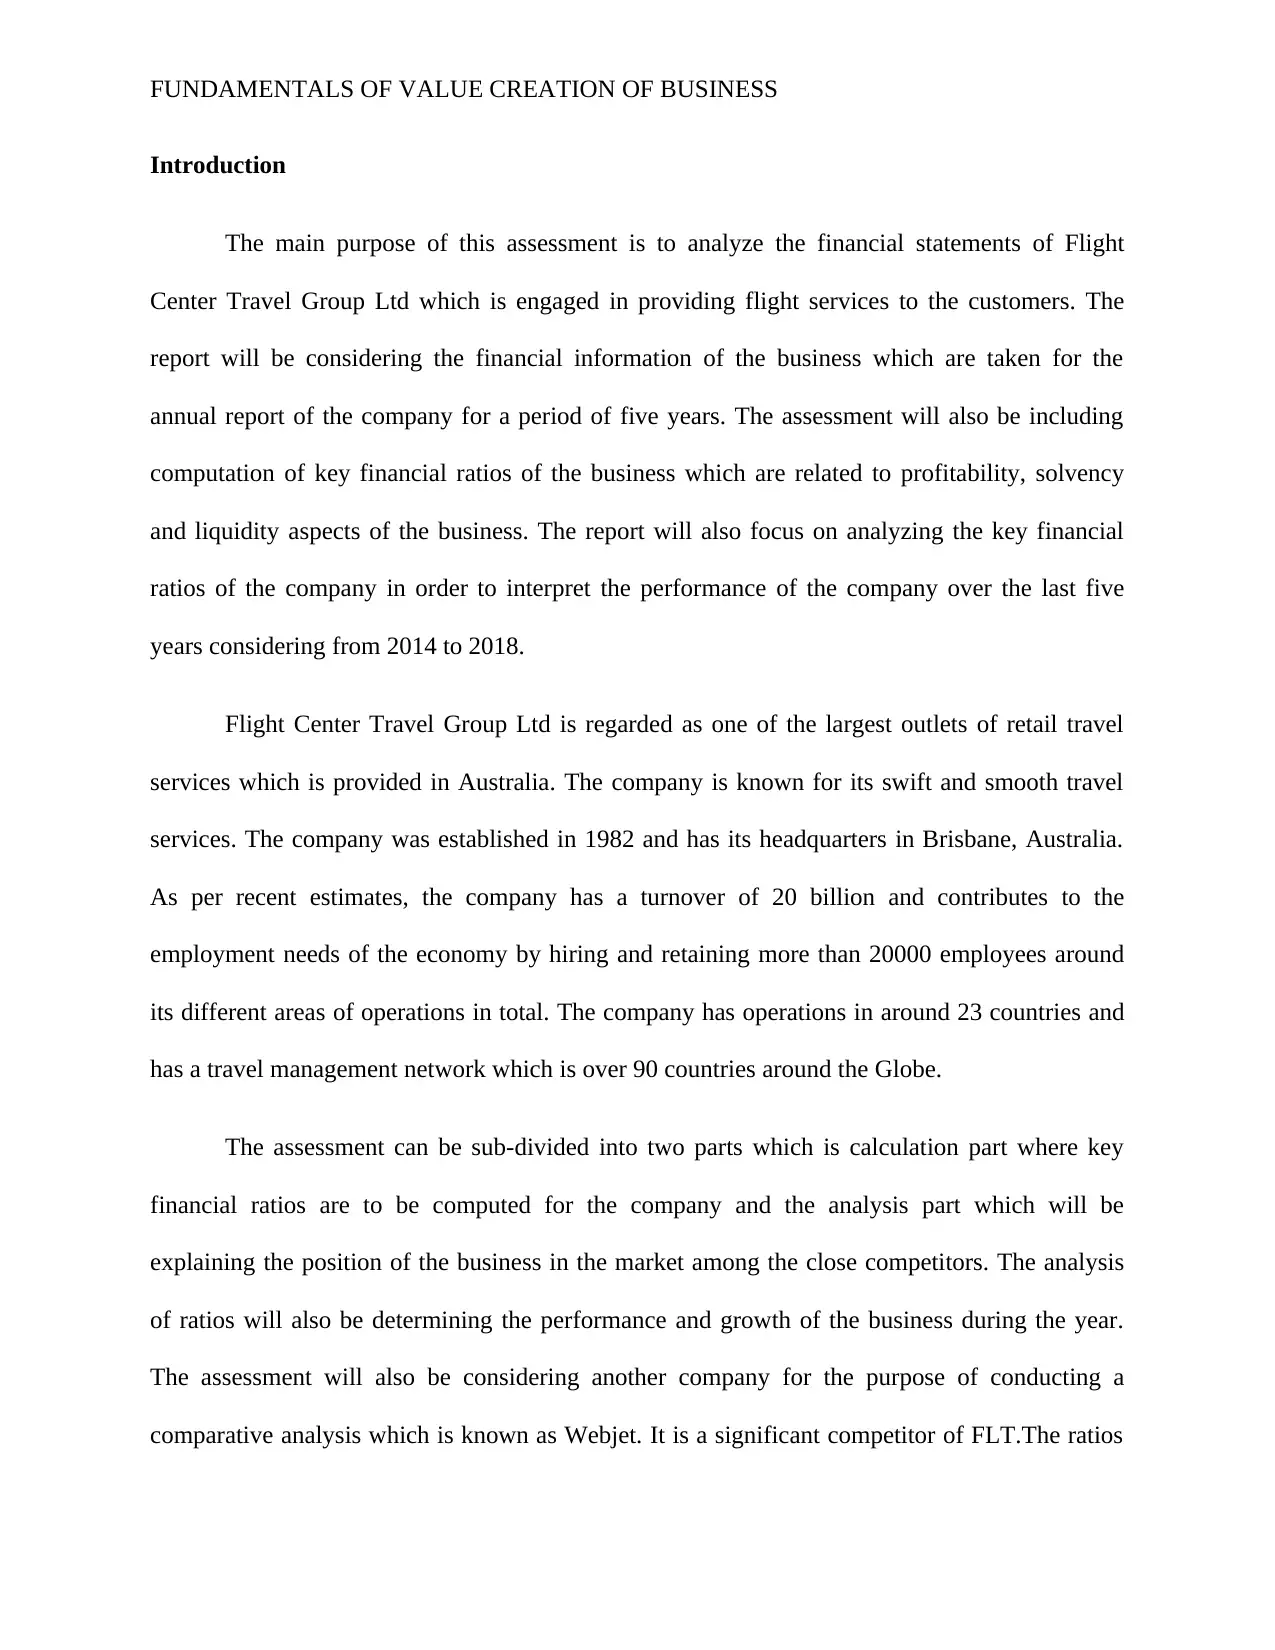
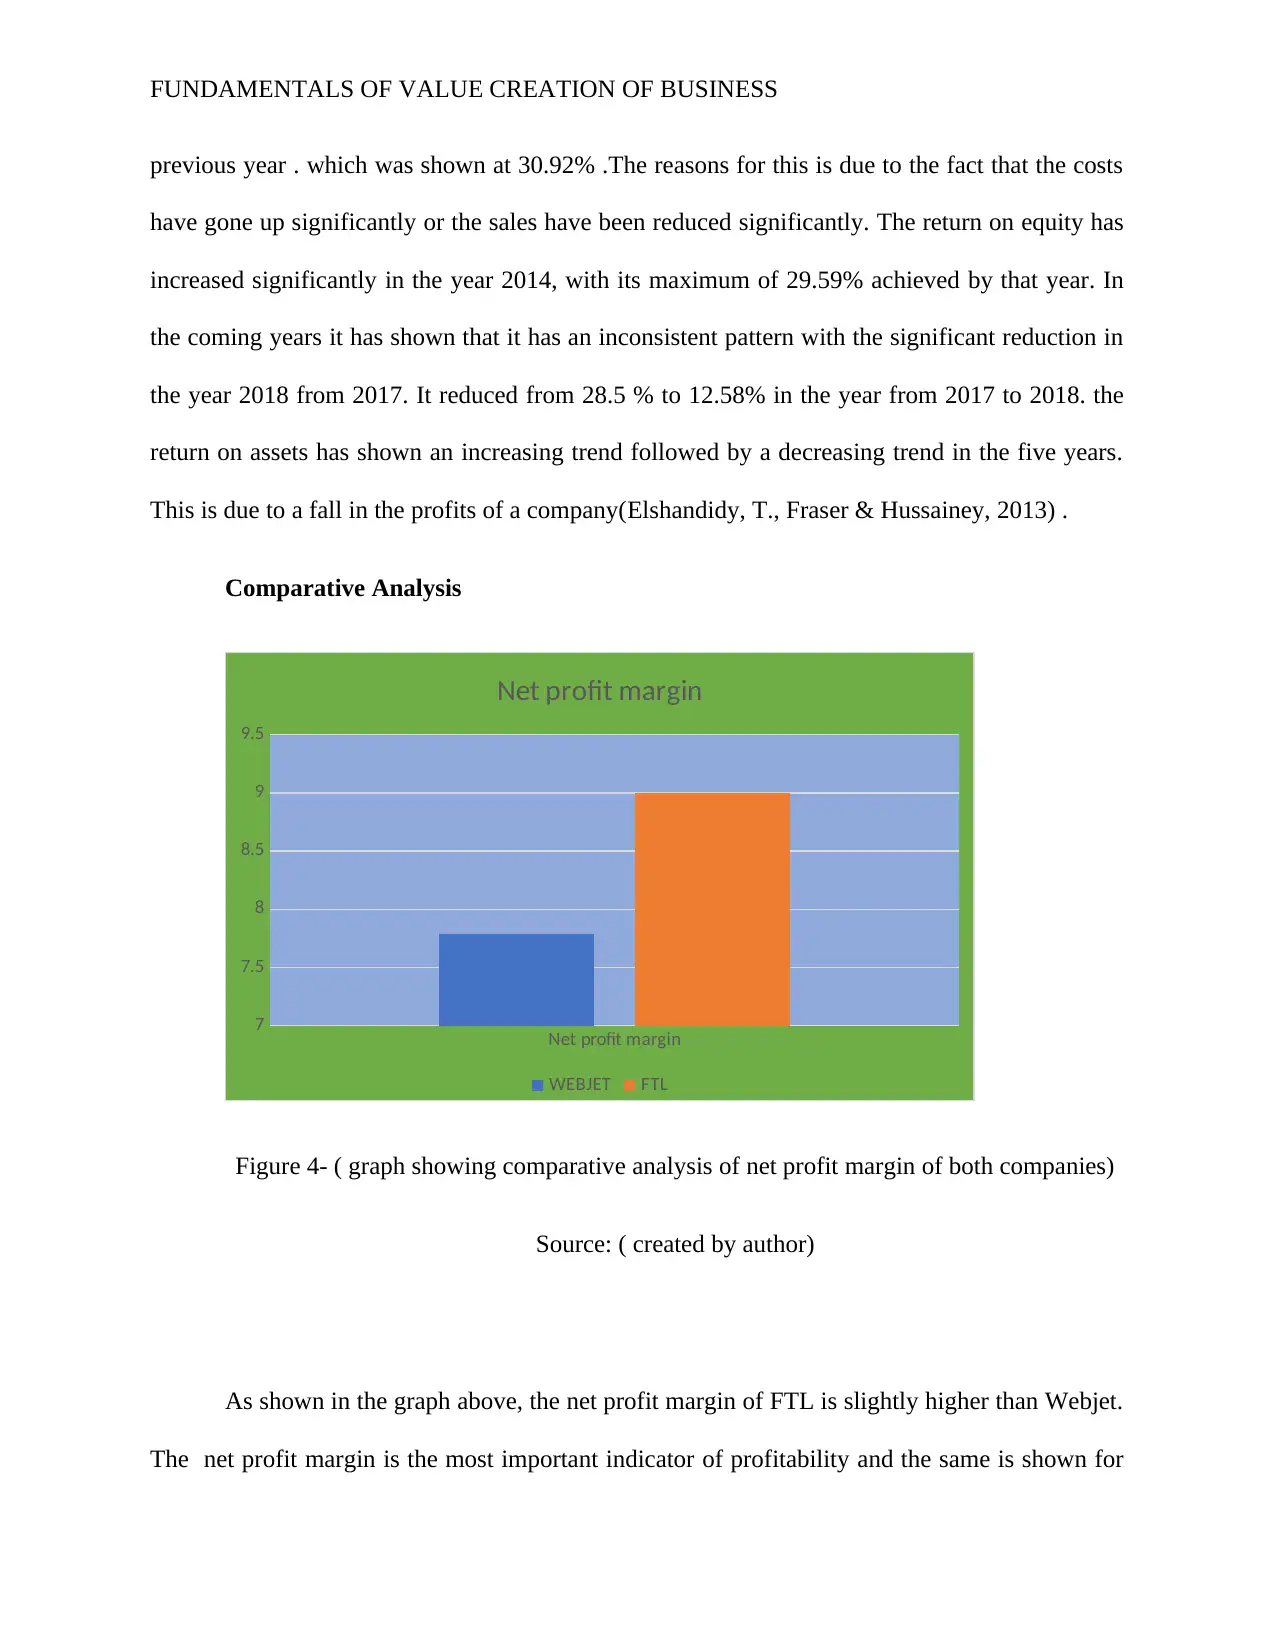
Figure 4- ( graph showing comparative analysis of net profit margin of both companies)
Source: ( created by author)
As shown in the graph above, the net profit margin of FTL is slightly higher than Webjet.
The net profit margin is the most important indicator of profitability and the same is shown for
previous year . which was shown at 30.92% .The reasons for this is due to the fact that the costs
have gone up significantly or the sales have been reduced significantly. The return on equity has
increased significantly in the year 2014, with its maximum of 29.59% achieved by that year. In
the coming years it has shown that it has an inconsistent pattern with the significant reduction in
the year 2018 from 2017. It reduced from 28.5 % to 12.58% in the year from 2017 to 2018. the
return on assets has shown an increasing trend followed by a decreasing trend in the five years.
This is due to a fall in the profits of a company(Elshandidy, T., Fraser & Hussainey, 2013) .
Comparative Analysis
Net profit margin
7
7.5
8
8.5
9
9.5
Net profit margin
WEBJET FTL
Figure 4- ( graph showing comparative analysis of net profit margin of both companies)
Source: ( created by author)
As shown in the graph above, the net profit margin of FTL is slightly higher than Webjet.
The net profit margin is the most important indicator of profitability and the same is shown for
⊘ This is a preview!⊘
Do you want full access?
Subscribe today to unlock all pages.
Trusted by 1+ million students worldwide
FUNDAMENTALS OF VALUE CREATION OF BUSINESS
Webjet as well. By comparing the profitability of the business , it suggests that the operational
structure of the FTL is better than Webjet . Thus the profitability of FTL is better than Webjet .
Hence the management of Webjet needs to think about the profitability aspect of the business.
Liquidity Analysis
The liquidity of the business refers to the ability of the company to effectively meet the
current obligations of the business(Ball, Li & Shivakumar, (2015). The ratios which will be
computed and considered in this section are current ratio and quick ratio which are discussed in
details in coming paragraphs. The liquidity position of Flight Center Travel Group Ltd is to be
judged from the analysis of current and quick ratio of the business. The liquidity ratios of the
business consist of quick ratio and current ratio which are considered to be an important
indicator for the success of the business(. In the case of FLT. the liquidity ratios of the business
is computed to considering the financial statements of the business for five yaer and the same is
presented in the table below.
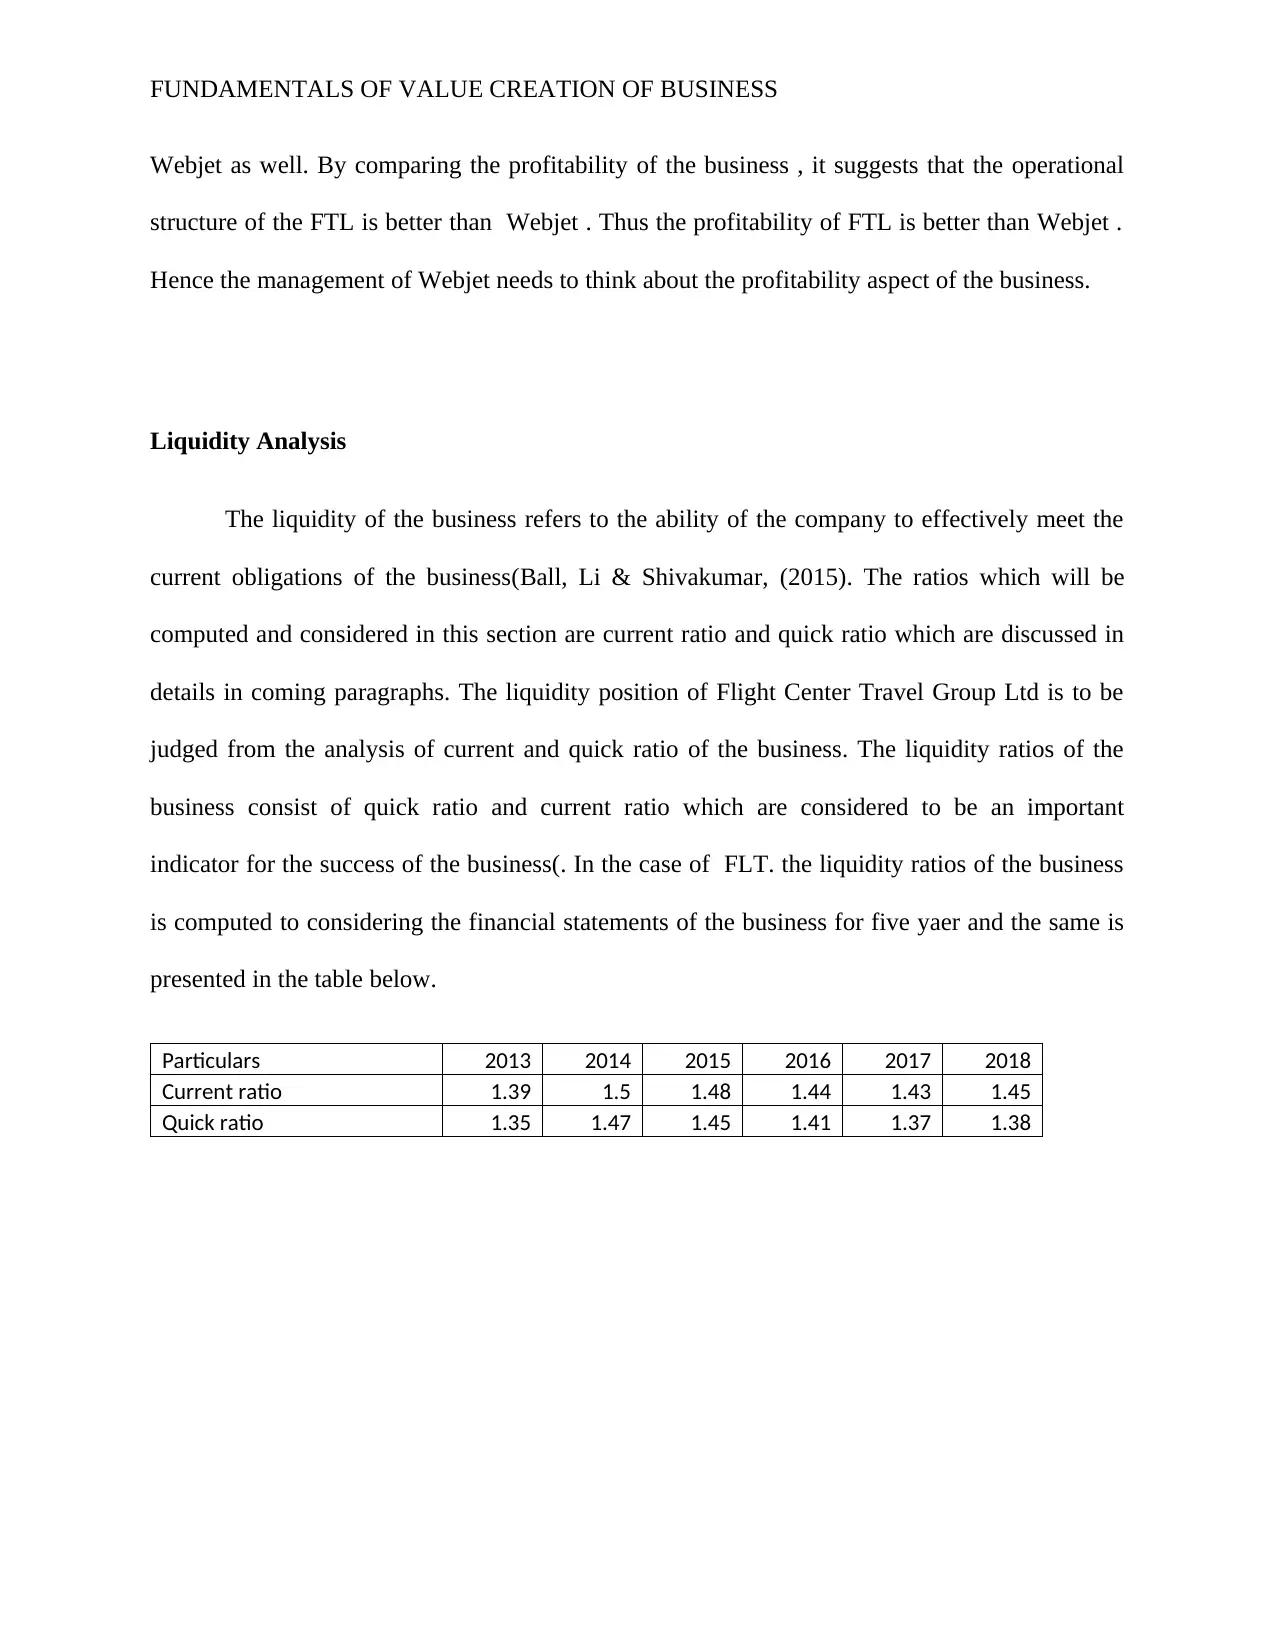
Particulars 2013 2014 2015 2016 2017 2018
Current ratio 1.39 1.5 1.48 1.44 1.43 1.45
Quick ratio 1.35 1.47 1.45 1.41 1.37 1.38
Webjet as well. By comparing the profitability of the business , it suggests that the operational
structure of the FTL is better than Webjet . Thus the profitability of FTL is better than Webjet .
Hence the management of Webjet needs to think about the profitability aspect of the business.
Liquidity Analysis
The liquidity of the business refers to the ability of the company to effectively meet the
current obligations of the business(Ball, Li & Shivakumar, (2015). The ratios which will be
computed and considered in this section are current ratio and quick ratio which are discussed in
details in coming paragraphs. The liquidity position of Flight Center Travel Group Ltd is to be
judged from the analysis of current and quick ratio of the business. The liquidity ratios of the
business consist of quick ratio and current ratio which are considered to be an important
indicator for the success of the business(. In the case of FLT. the liquidity ratios of the business
is computed to considering the financial statements of the business for five yaer and the same is
presented in the table below.
Particulars 2013 2014 2015 2016 2017 2018
Current ratio 1.39 1.5 1.48 1.44 1.43 1.45
Quick ratio 1.35 1.47 1.45 1.41 1.37 1.38
Paraphrase This Document
Need a fresh take? Get an instant paraphrase of this document with our AI Paraphraser
FUNDAMENTALS OF VALUE CREATION OF BUSINESS
1.45
1.38
2018
Current ratio
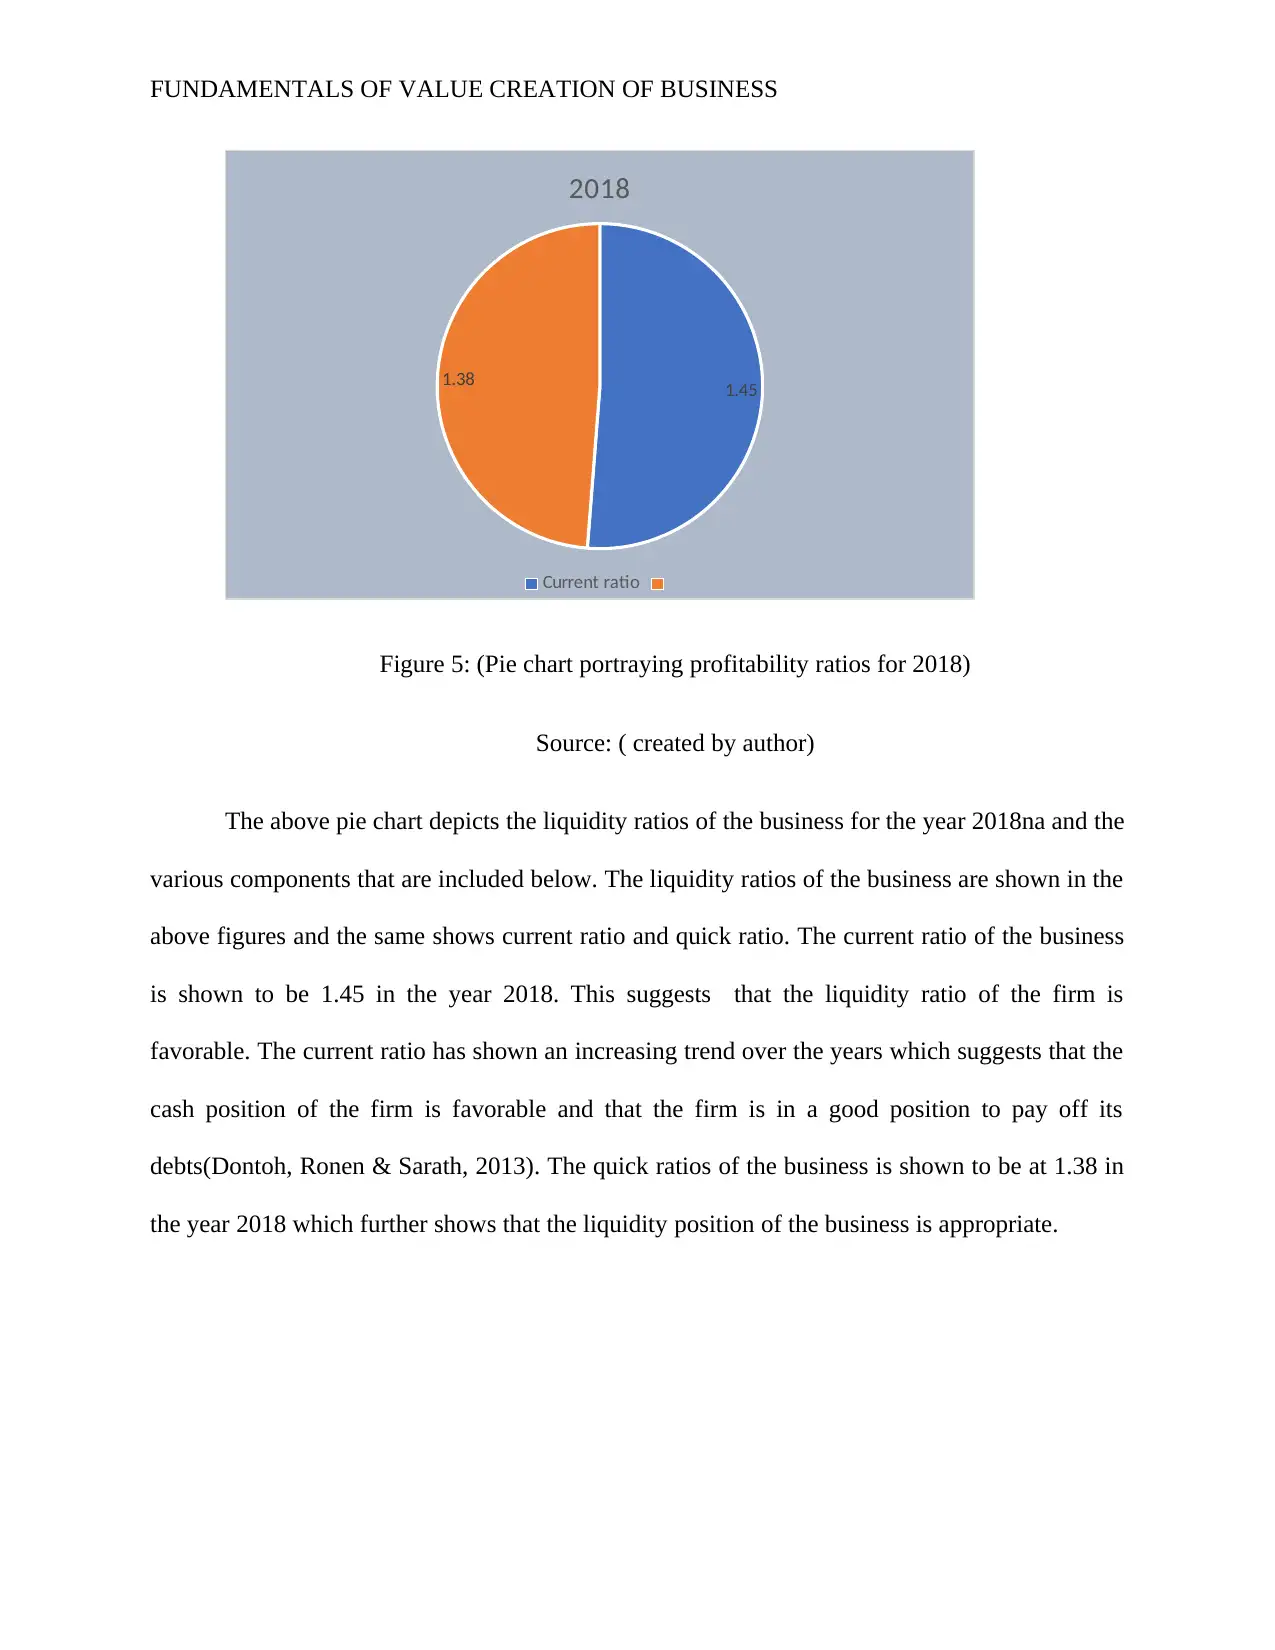
Figure 5: (Pie chart portraying profitability ratios for 2018)
Source: ( created by author)
The above pie chart depicts the liquidity ratios of the business for the year 2018na and the
various components that are included below. The liquidity ratios of the business are shown in the
above figures and the same shows current ratio and quick ratio. The current ratio of the business
is shown to be 1.45 in the year 2018. This suggests that the liquidity ratio of the firm is
favorable. The current ratio has shown an increasing trend over the years which suggests that the
cash position of the firm is favorable and that the firm is in a good position to pay off its
debts(Dontoh, Ronen & Sarath, 2013). The quick ratios of the business is shown to be at 1.38 in
the year 2018 which further shows that the liquidity position of the business is appropriate.
1.45
1.38
2018
Current ratio
Figure 5: (Pie chart portraying profitability ratios for 2018)
Source: ( created by author)
The above pie chart depicts the liquidity ratios of the business for the year 2018na and the
various components that are included below. The liquidity ratios of the business are shown in the
above figures and the same shows current ratio and quick ratio. The current ratio of the business
is shown to be 1.45 in the year 2018. This suggests that the liquidity ratio of the firm is
favorable. The current ratio has shown an increasing trend over the years which suggests that the
cash position of the firm is favorable and that the firm is in a good position to pay off its
debts(Dontoh, Ronen & Sarath, 2013). The quick ratios of the business is shown to be at 1.38 in
the year 2018 which further shows that the liquidity position of the business is appropriate.
FUNDAMENTALS OF VALUE CREATION OF BUSINESS
2014 2015 2016 2017 2018
1.3
1.35
1.4
1.45
1.5
1.55
1.5
1.48
1.44 1.43
1.45
1.47
1.45
1.41
1.37 1.38
Liquidity analysis
Current ratio Quick ratio
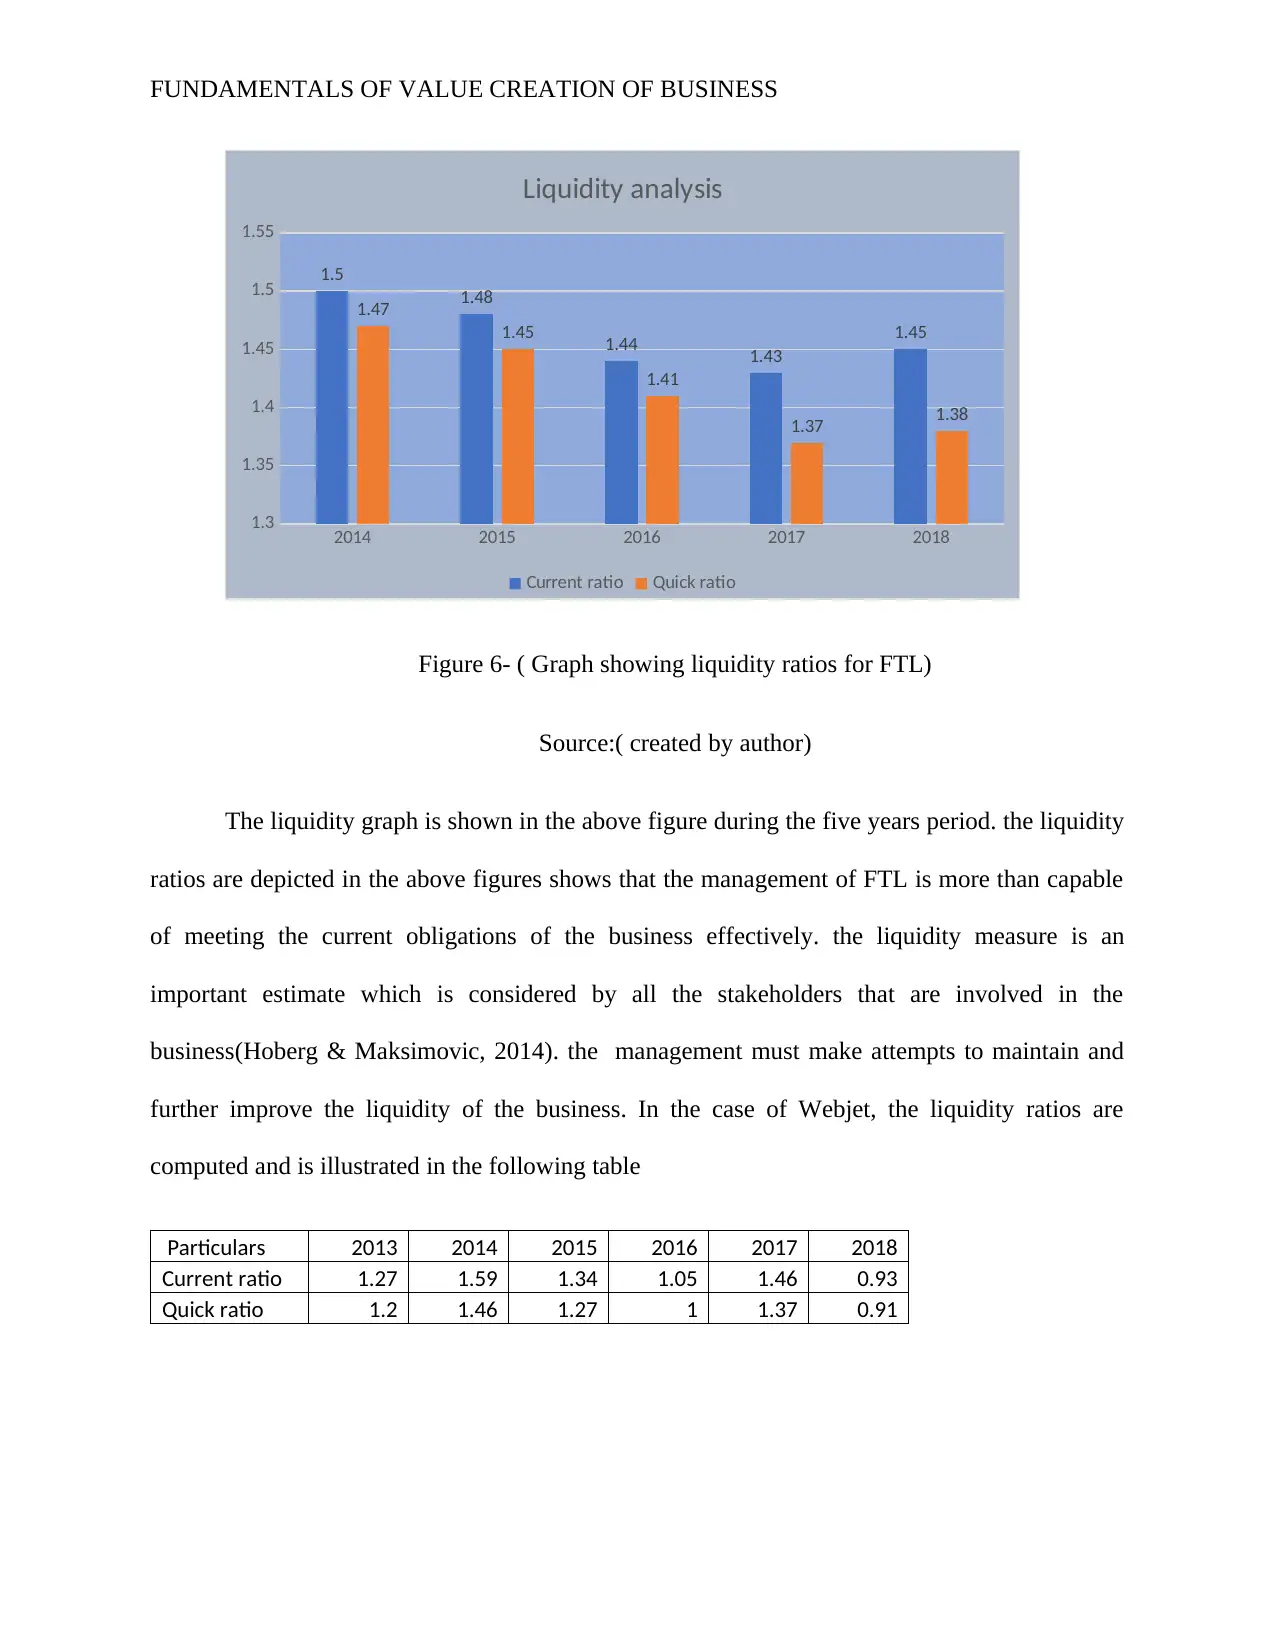
Figure 6- ( Graph showing liquidity ratios for FTL)
Source:( created by author)
The liquidity graph is shown in the above figure during the five years period. the liquidity
ratios are depicted in the above figures shows that the management of FTL is more than capable
of meeting the current obligations of the business effectively. the liquidity measure is an
important estimate which is considered by all the stakeholders that are involved in the
business(Hoberg & Maksimovic, 2014). the management must make attempts to maintain and
further improve the liquidity of the business. In the case of Webjet, the liquidity ratios are
computed and is illustrated in the following table
Particulars 2013 2014 2015 2016 2017 2018
Current ratio 1.27 1.59 1.34 1.05 1.46 0.93
Quick ratio 1.2 1.46 1.27 1 1.37 0.91
2014 2015 2016 2017 2018
1.3
1.35
1.4
1.45
1.5
1.55
1.5
1.48
1.44 1.43
1.45
1.47
1.45
1.41
1.37 1.38
Liquidity analysis
Current ratio Quick ratio
Figure 6- ( Graph showing liquidity ratios for FTL)
Source:( created by author)
The liquidity graph is shown in the above figure during the five years period. the liquidity
ratios are depicted in the above figures shows that the management of FTL is more than capable
of meeting the current obligations of the business effectively. the liquidity measure is an
important estimate which is considered by all the stakeholders that are involved in the
business(Hoberg & Maksimovic, 2014). the management must make attempts to maintain and
further improve the liquidity of the business. In the case of Webjet, the liquidity ratios are
computed and is illustrated in the following table
Particulars 2013 2014 2015 2016 2017 2018
Current ratio 1.27 1.59 1.34 1.05 1.46 0.93
Quick ratio 1.2 1.46 1.27 1 1.37 0.91
⊘ This is a preview!⊘
Do you want full access?
Subscribe today to unlock all pages.
Trusted by 1+ million students worldwide
1 out of 22
Related Documents


Your All-in-One AI-Powered Toolkit for Academic Success.
+13062052269
info@desklib.com
Available 24*7 on WhatsApp / Email
![[object Object]](/_next/static/media/star-bottom.7253800d.svg)
Unlock your academic potential
Copyright © 2020–2026 A2Z Services. All Rights Reserved. Developed and managed by ZUCOL.