Performance Analysis of Flight Centre Travel (FLT) - HI5002 Finance
VerifiedAdded on 2023/03/17
|16
|5047
|92
Report
AI Summary
This report presents a financial performance analysis of Flight Centre Travel Group Limited (FLT), an ASX-listed company in the travel industry. The analysis, conducted for an international investor, examines FLT's financial health using its 2016, 2017, and 2018 financial statements. The report focuses on profitability, efficiency, working capital, and financial structure through the calculation and interpretation of various financial ratios, including gross margin, return on assets, and accounts receivable turnover. The study is divided into two main parts, namely the financial analysis of the Flight Centre Travel Group Limited and a recommendation letter based on findings of the performance analysis. The report concludes with recommendations for investment, suggesting that FLT could be part of a diversified investment portfolio, while also highlighting the need for further investigation into its valuation and management.
Performance Analysis 1
Flight Centre Travel (ASX: FLT) Performance Analysis
by Student Name
Class & Course
Professor
University
The City & State
Date
Flight Centre Travel (ASX: FLT) Performance Analysis
by Student Name
Class & Course
Professor
University
The City & State
Date
Paraphrase This Document
Need a fresh take? Get an instant paraphrase of this document with our AI Paraphraser
Performance Analysis 2
Abstract
The report analyses the Flight Centre Travel Company as a potential investment
opportunity for an international company. The analysis focuses more on FLT’s working
capital, financial structure, activity, and profitability. The study is divided into two main
parts, namely the financial analysis of the Flight Centre Travel Group Limited and a
recommendation letter based on findings of the performance analysis. The financial
report is further divided into several sections. Based on the comparative financial
performance analysis, FLT has an unfavourable but a promising future. The company is
not worth investing in as a single investment option. However, the company has a
positive performance outlook, which is encouraging to investors. FLT will be in a position
to sustain its cash requirements in the future. FLT pays 40-60% dividends from its net
income annually after taking future cash and investment requirements into
consideration. The company has paid out a dividend in the past three consecutive years.
The risk associated with the company can be managed by adding it in the diversified
investment portfolio. In conclusion, BACA consultancy recommends that FLT should be
part of the diversified investment portfolio. Further investigation should be conducted on
the company’s valuation and its management team.
Performance Analysis 3
I. Introduction
Financial performance analysis report represents a summarised version of a company’s
annual reports. Performance reports help investors to understand the financial health of
a company before making investment decisions. In this scenario, an international
investor is interested in investing in the Australian market. The investor is particularly
interested in an ASX listed company. BACA Consultancy has been contracted to choose
a potential investment company for the investor. The consultancy has settled for the
Flight Centre Travel (ASX: FLT). However, the BACA has to conduct a financial
performance analysis on the company to evaluate whether or not it is a viable
investment option. The performance analysis relies on the three latest financial
statements of the company-income statements, cash flow statements, and balance
sheets to make an informed opinion about investing in the company as well as
projecting the future performance. The analysis focuses more on FLT’s working capital,
financial structure, activity, and profitability.
The paper is divided into two main parts, namely the financial analysis of the Flight
Centre Travel Group Limited and a recommendation letter based on findings of the
performance analysis. The financial analysis is further divided into several sections. The
sections are;
a) Description of FLT,
b) Performance ratios calculation and analysis,
c) Cash management analysis,
d) Perform a sensitivity analysis,
e) Systemic risks and un-systemic risks,
f) And, dividend payout ratio and dividend policy.
The Consultancy firm believes that the investor will benefit from the report by making the
right investment decision based on the informed opinion presented in this report.
1.0. Financial Analysis of FLT Company
Financial analysis refers to the process of analysing suitability and performance of
businesses. The process applies several analysis techniques such as ratio, risk, cash
management, and sensitivity to evaluate whether or not a business is liquid, stable,
profitable, or solvent enough to invest in (English, 2011, p. 67). This section relies on
2016, 2017, and 2018 financial statements of FLT to conduct a financial analysis.
1.1. Description of FLT Company
Flight Centre Travel Group Ltd (FLT) is an ASX listed company which operates in the
traveling industry. FLT was established in 1982 and had its headquarters in South
Brisbane. The company offers services such as corporate travel management, retail,
and wholesale travelling. FLT offers thirty brands in four business segments, which are
Retail, Wholesale, Corporate, and Leisure across over 50 countries (Flight Centre Travel
Group Limited, 2019, p. 14). The key global destinations for the company are Australia,
Europe, the United States, Africa, the United Kingdom, Asia, and New Zealand. FLT has
over 20,200 employees you have been employed on a full-time basis. Moreover, the
company engages indirectly in the employment of over one million people. The company
⊘ This is a preview!⊘
Do you want full access?
Subscribe today to unlock all pages.
Trusted by 1+ million students worldwide
Performance Analysis 4
posted a 2.9billion during the 2018 financial year which a 10.35% compared to the
revenue realised in 2017.
Several investment decisions contributed to the company's group in recent years. First,
the introduction of low-cost new systems that improved productivity. Second, the
introduction of unique brands and products to the customers. Third, the introduction of
flexible working programs for employees to enhance their performance. Fourth, high
presence on the online and digital market which enhanced the company’s capability to
deliver. And fifth, expanding the organic growth strategy by acquiring in the Mexico,
Netherland, and Malaysia markets (Flight Centre Travel Group Limited, 2018).
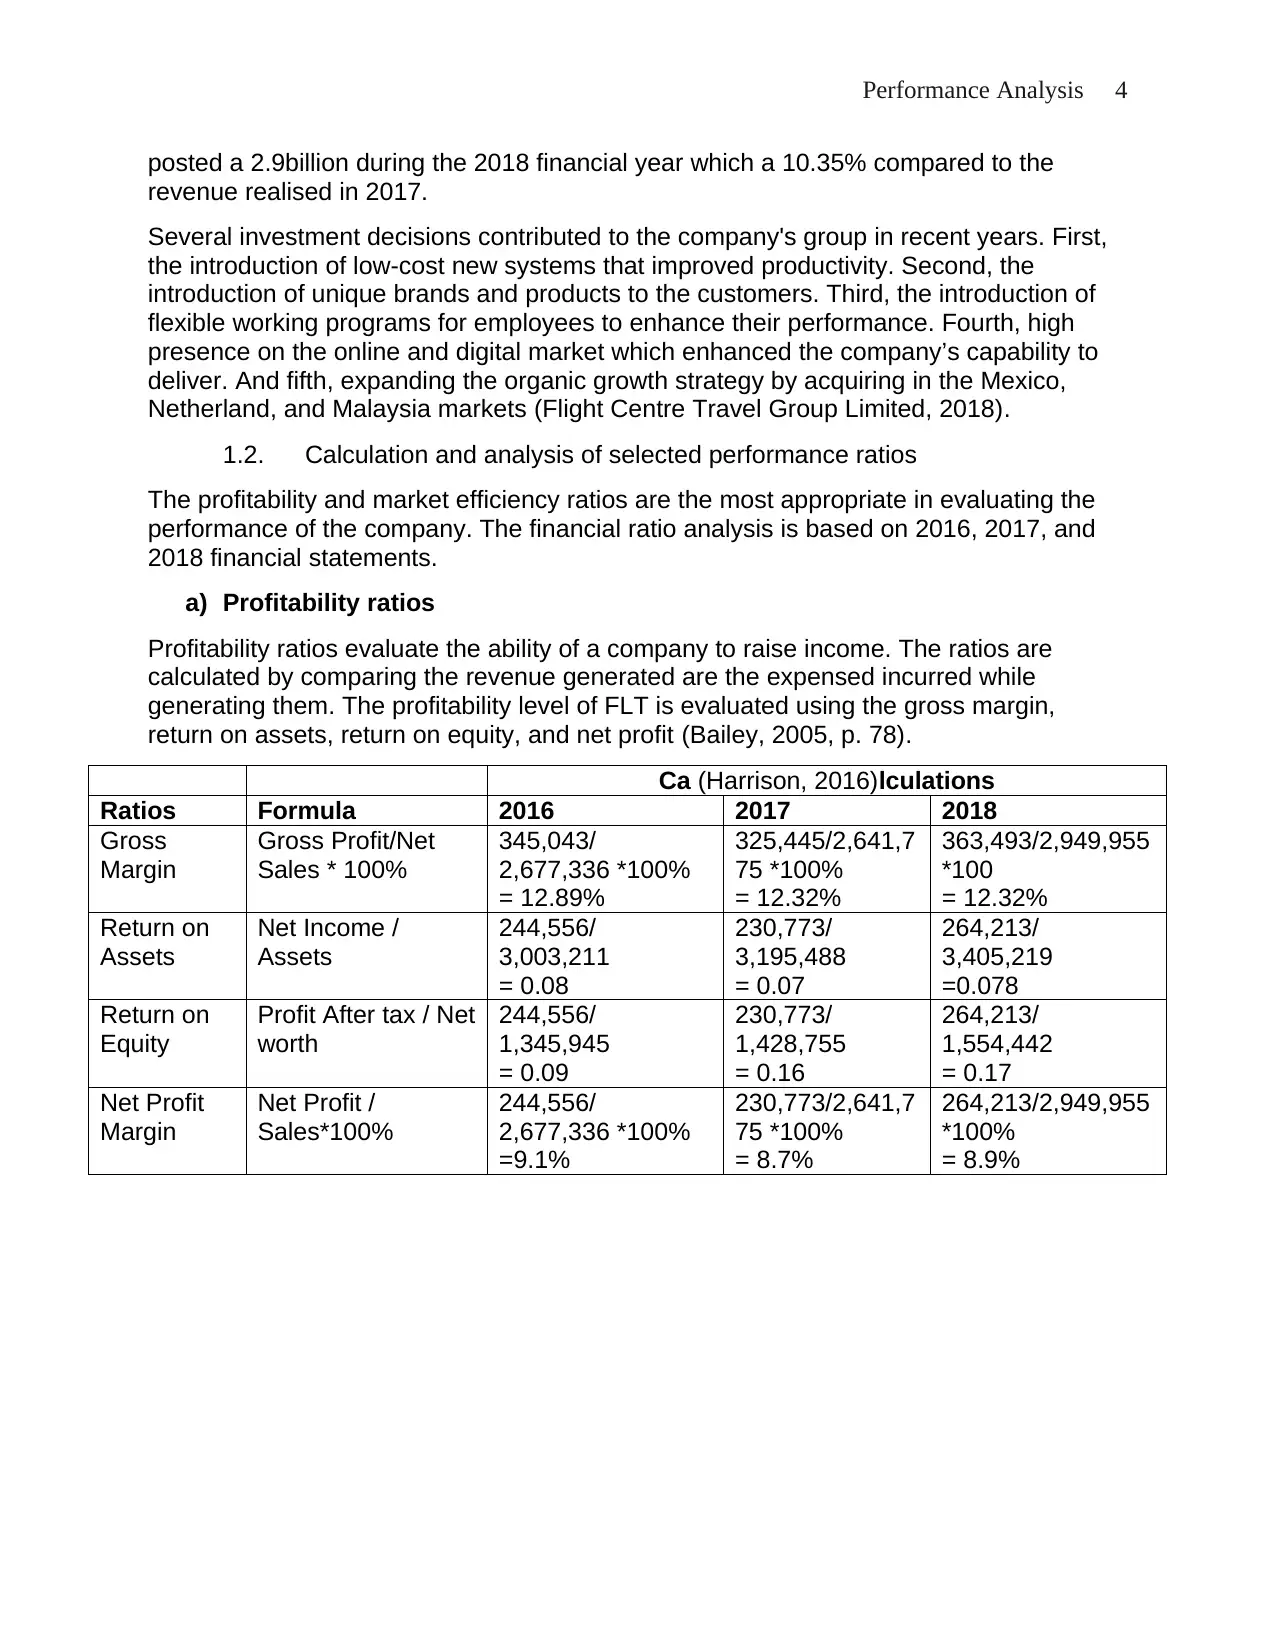
1.2. Calculation and analysis of selected performance ratios
The profitability and market efficiency ratios are the most appropriate in evaluating the
performance of the company. The financial ratio analysis is based on 2016, 2017, and
2018 financial statements.
a) Profitability ratios
Profitability ratios evaluate the ability of a company to raise income. The ratios are
calculated by comparing the revenue generated are the expensed incurred while
generating them. The profitability level of FLT is evaluated using the gross margin,
return on assets, return on equity, and net profit (Bailey, 2005, p. 78).
Ca (Harrison, 2016)lculations
Ratios Formula 2016 2017 2018
Gross
Margin
Gross Profit/Net
Sales * 100%
345,043/
2,677,336 *100%
= 12.89%
325,445/2,641,7
75 *100%
= 12.32%
363,493/2,949,955
*100
= 12.32%
Return on
Assets
Net Income /
Assets
244,556/
3,003,211
= 0.08
230,773/
3,195,488
= 0.07
264,213/
3,405,219
=0.078
Return on
Equity
Profit After tax / Net
worth
244,556/
1,345,945
= 0.09
230,773/
1,428,755
= 0.16
264,213/
1,554,442
= 0.17
Net Profit
Margin
Net Profit /
Sales*100%
244,556/
2,677,336 *100%
=9.1%
230,773/2,641,7
75 *100%
= 8.7%
264,213/2,949,955
*100%
= 8.9%
posted a 2.9billion during the 2018 financial year which a 10.35% compared to the
revenue realised in 2017.
Several investment decisions contributed to the company's group in recent years. First,
the introduction of low-cost new systems that improved productivity. Second, the
introduction of unique brands and products to the customers. Third, the introduction of
flexible working programs for employees to enhance their performance. Fourth, high
presence on the online and digital market which enhanced the company’s capability to
deliver. And fifth, expanding the organic growth strategy by acquiring in the Mexico,
Netherland, and Malaysia markets (Flight Centre Travel Group Limited, 2018).
1.2. Calculation and analysis of selected performance ratios
The profitability and market efficiency ratios are the most appropriate in evaluating the
performance of the company. The financial ratio analysis is based on 2016, 2017, and
2018 financial statements.
a) Profitability ratios
Profitability ratios evaluate the ability of a company to raise income. The ratios are
calculated by comparing the revenue generated are the expensed incurred while
generating them. The profitability level of FLT is evaluated using the gross margin,
return on assets, return on equity, and net profit (Bailey, 2005, p. 78).
Ca (Harrison, 2016)lculations
Ratios Formula 2016 2017 2018
Gross
Margin
Gross Profit/Net
Sales * 100%
345,043/
2,677,336 *100%
= 12.89%
325,445/2,641,7
75 *100%
= 12.32%
363,493/2,949,955
*100
= 12.32%
Return on
Assets
Net Income /
Assets
244,556/
3,003,211
= 0.08
230,773/
3,195,488
= 0.07
264,213/
3,405,219
=0.078
Return on
Equity
Profit After tax / Net
worth
244,556/
1,345,945
= 0.09
230,773/
1,428,755
= 0.16
264,213/
1,554,442
= 0.17
Net Profit
Margin
Net Profit /
Sales*100%
244,556/
2,677,336 *100%
=9.1%
230,773/2,641,7
75 *100%
= 8.7%
264,213/2,949,955
*100%
= 8.9%
Paraphrase This Document
Need a fresh take? Get an instant paraphrase of this document with our AI Paraphraser
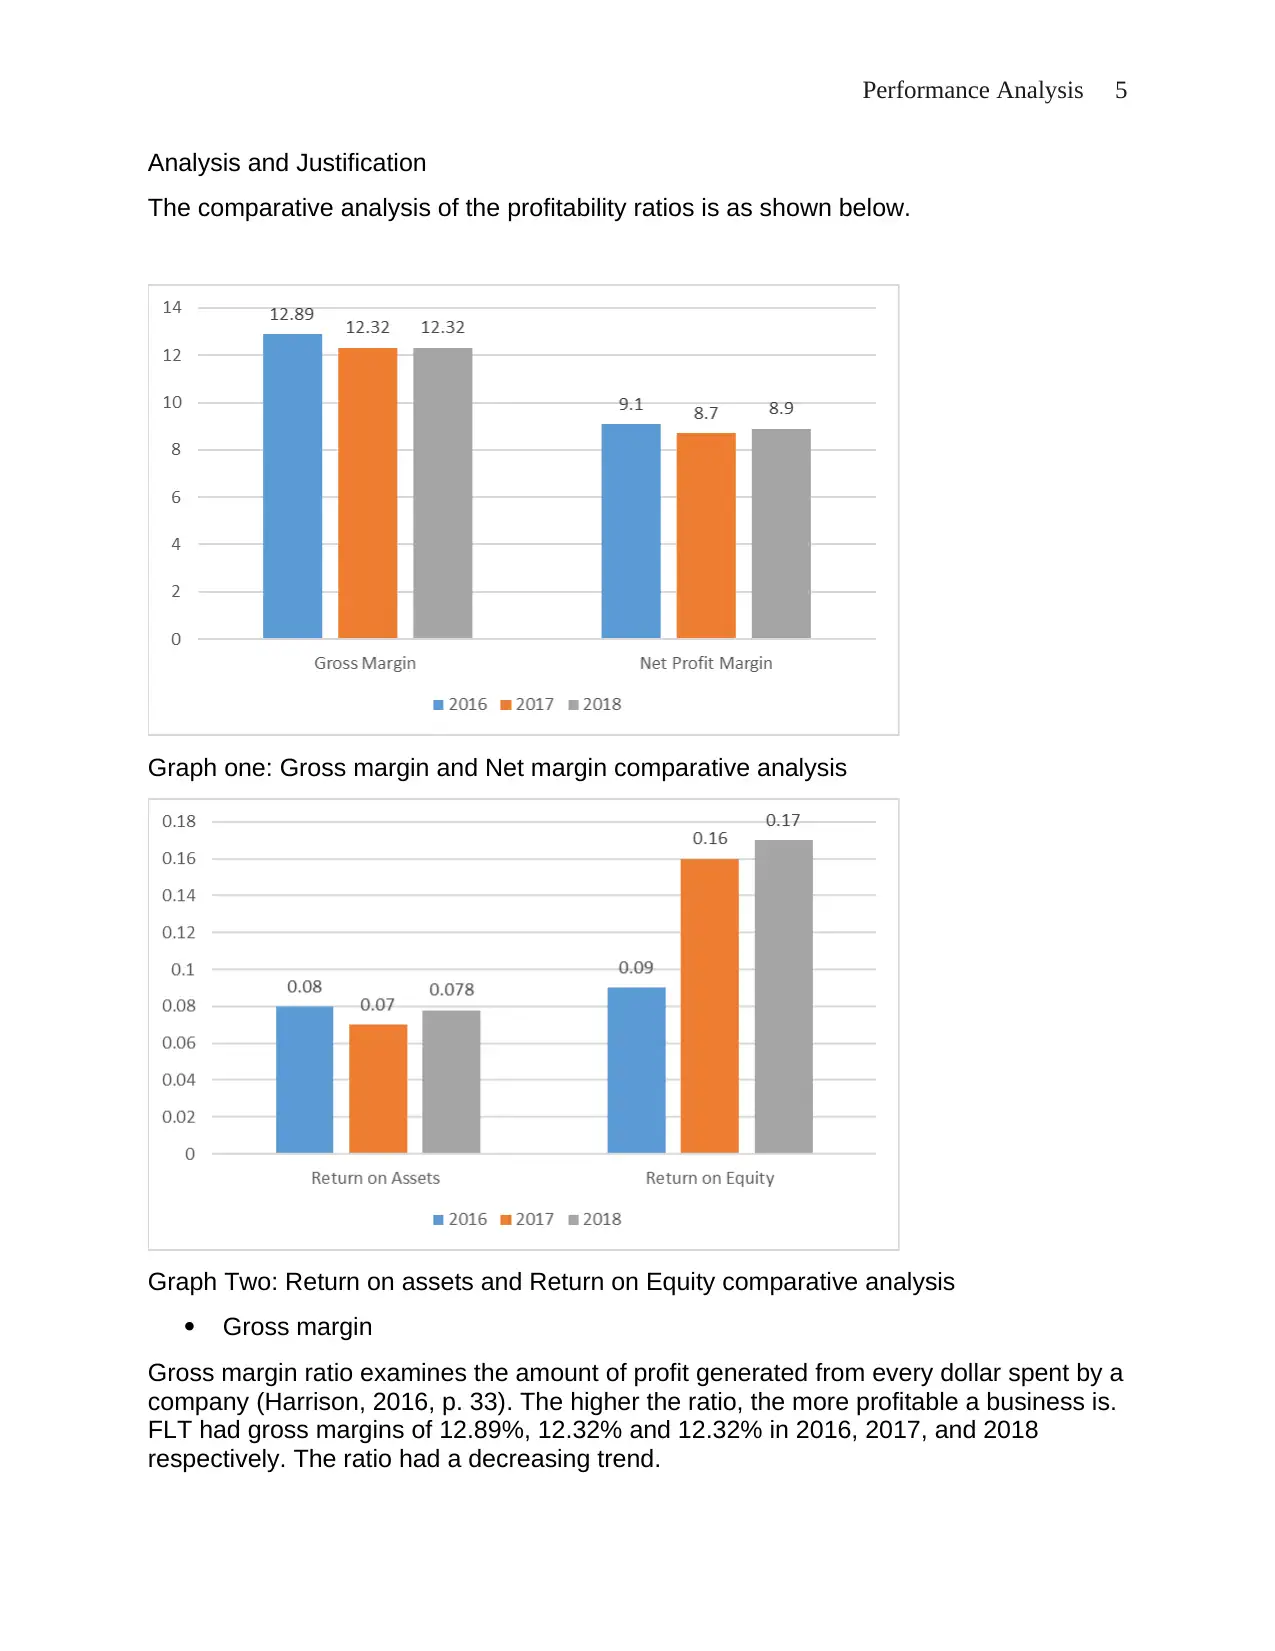
Performance Analysis 5
Analysis and Justification
The comparative analysis of the profitability ratios is as shown below.
Graph one: Gross margin and Net margin comparative analysis
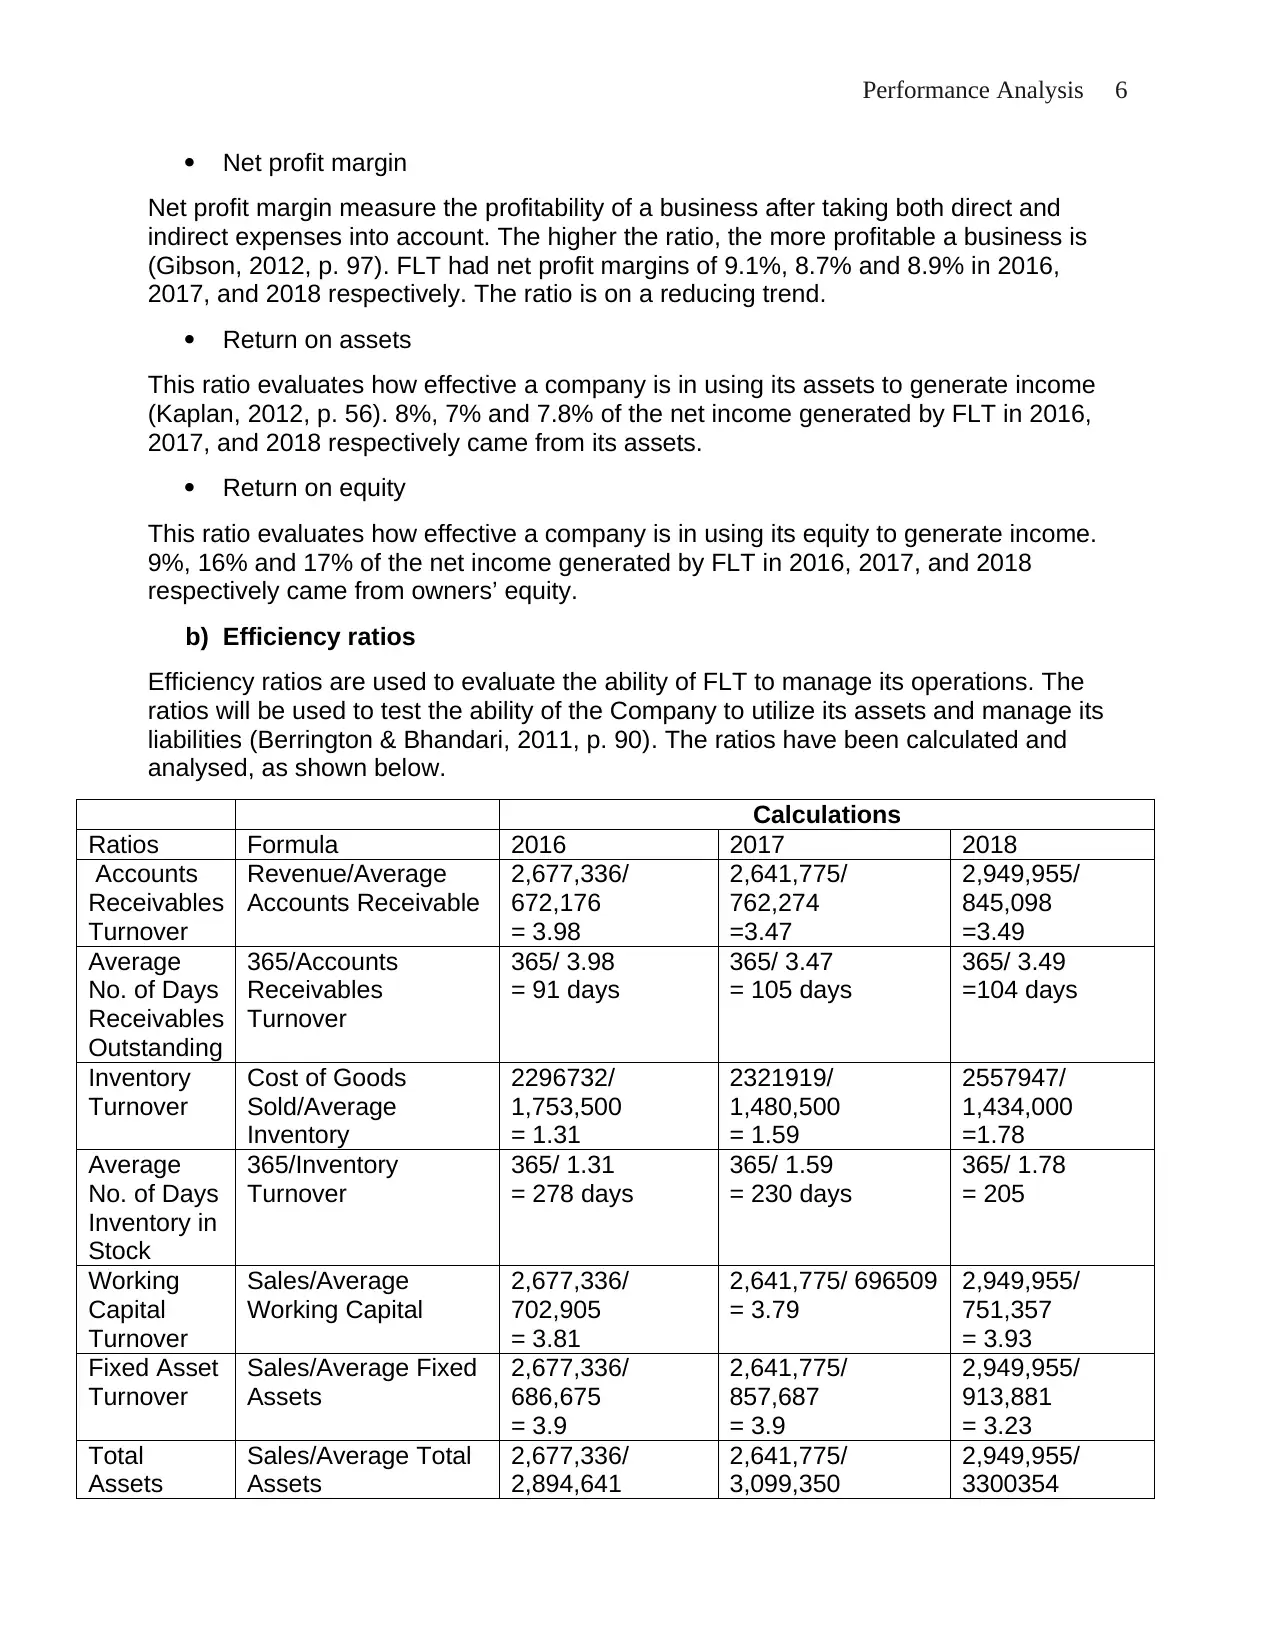
Graph Two: Return on assets and Return on Equity comparative analysis
Gross margin
Gross margin ratio examines the amount of profit generated from every dollar spent by a
company (Harrison, 2016, p. 33). The higher the ratio, the more profitable a business is.
FLT had gross margins of 12.89%, 12.32% and 12.32% in 2016, 2017, and 2018
respectively. The ratio had a decreasing trend.
Analysis and Justification
The comparative analysis of the profitability ratios is as shown below.
Graph one: Gross margin and Net margin comparative analysis
Graph Two: Return on assets and Return on Equity comparative analysis
Gross margin
Gross margin ratio examines the amount of profit generated from every dollar spent by a
company (Harrison, 2016, p. 33). The higher the ratio, the more profitable a business is.
FLT had gross margins of 12.89%, 12.32% and 12.32% in 2016, 2017, and 2018
respectively. The ratio had a decreasing trend.
Performance Analysis 6
Net profit margin
Net profit margin measure the profitability of a business after taking both direct and
indirect expenses into account. The higher the ratio, the more profitable a business is
(Gibson, 2012, p. 97). FLT had net profit margins of 9.1%, 8.7% and 8.9% in 2016,
2017, and 2018 respectively. The ratio is on a reducing trend.
Return on assets
This ratio evaluates how effective a company is in using its assets to generate income
(Kaplan, 2012, p. 56). 8%, 7% and 7.8% of the net income generated by FLT in 2016,
2017, and 2018 respectively came from its assets.
Return on equity
This ratio evaluates how effective a company is in using its equity to generate income.
9%, 16% and 17% of the net income generated by FLT in 2016, 2017, and 2018
respectively came from owners’ equity.
b) Efficiency ratios
Efficiency ratios are used to evaluate the ability of FLT to manage its operations. The
ratios will be used to test the ability of the Company to utilize its assets and manage its
liabilities (Berrington & Bhandari, 2011, p. 90). The ratios have been calculated and
analysed, as shown below.
Calculations
Ratios Formula 2016 2017 2018
Accounts
Receivables
Turnover
Revenue/Average
Accounts Receivable
2,677,336/
672,176
= 3.98
2,641,775/
762,274
=3.47
2,949,955/
845,098
=3.49
Average
No. of Days
Receivables
Outstanding
365/Accounts
Receivables
Turnover
365/ 3.98
= 91 days
365/ 3.47
= 105 days
365/ 3.49
=104 days
Inventory
Turnover
Cost of Goods
Sold/Average
Inventory
2296732/
1,753,500
= 1.31
2321919/
1,480,500
= 1.59
2557947/
1,434,000
=1.78
Average
No. of Days
Inventory in
Stock
365/Inventory
Turnover
365/ 1.31
= 278 days
365/ 1.59
= 230 days
365/ 1.78
= 205
Working
Capital
Turnover
Sales/Average
Working Capital
2,677,336/
702,905
= 3.81
2,641,775/ 696509
= 3.79
2,949,955/
751,357
= 3.93
Fixed Asset
Turnover
Sales/Average Fixed
Assets
2,677,336/
686,675
= 3.9
2,641,775/
857,687
= 3.9
2,949,955/
913,881
= 3.23
Total
Assets
Sales/Average Total
Assets
2,677,336/
2,894,641
2,641,775/
3,099,350
2,949,955/
3300354
⊘ This is a preview!⊘
Do you want full access?
Subscribe today to unlock all pages.
Trusted by 1+ million students worldwide

Performance Analysis 7
Turnover = 0.92 = 0.85 = 0.89
Analysis and Justification
The comparative analysis of the efficiency ratios is as shown below.
Graph Three: Efficiency ratio comparative analysis
Graph Four: Efficiency ratio comparative analysis
Accounts Receivables Turnover
The ratio evaluates the efficiency of a company’s credit policies. Accounts receivable
turnover ratio evaluates how quick customers pay their bills to the company. The lower
the number of days it takes for a company to collect debts from customers, the better.
On the other hand, many collection days shows the inefficiency of a company’s credit
Paraphrase This Document
Need a fresh take? Get an instant paraphrase of this document with our AI Paraphraser
Performance Analysis 8
policy (Gassen & Schwedler, 2010, p. 112). FLT’s account receivables turnover was
3.98, 3.47, and 3.49 in 2016, 2017, and 2018, respectively. The ratio is high meaning
that FLT has ineffective credit policies.
Inventory Turnover
Inventory turnover evaluates the efficiency of a company in managing inventory. A lower
ratio shows that a company has failed in efficiently managing its inventory. On the other
hand, a higher ratio indicates that a company is efficient in managing its inventory (Van,
2009, p. 66). FLT had an inventory turnover ratio of 1.31, 1.59, and 1.78 in 2016, 2017,
and 2018, respectively. The trend is increasing. Therefore, the inventories are staying
longer in the company before they are sold.
Working Capital Turnover
The ratio measures the operating capital that is required by a company to maintain its
sales. A company with a higher working capital turnover is considered to be efficient in
managing its working capital. On the other had a low ratio indicates that a company has
not utilized its working capital to the maximum (Deegan, 2013, p. 71). FLT’s working
capital turnover ratio was 3.81, 3.79, and 3.93 in 2016, 2017, and 2018, respectively.
The ratios show that the company is efficient in managing its working capital.
Fixed Asset Turnover
Fixed asset turnover ratio measures sales that a company generates from its long term
capital investments. The ratio evaluates how efficient is a company’s capital investments
(Demirgüneş, 2015, p. 34). Higher the ratio, the better for a company. FLT’s fixed asset
turnover ratio was 3.9, 3.9, and 3.28 in 2016, 2017, and 2018, respectively. FLT was
efficient in using its long term capital investments to generate sales.
Total Assets Turnover
Total assets turnover ratios measure a company’s efficiency to generate income using
current and fixed assets. A higher ratio is better because it shows how effective a
company is when utilizing its entire funds (Edmonds, et al., 2015, p. 75). FLT’s total
asset turnover ratio was 0.92, 0.85, and 0.89 in 2016, 2017, and 2018 respectively. The
three ratios are less than one showing that FLT was ineffective in utilizing its funds to
generate sales.
Average No. of Days Receivables Outstanding
The ratio measures the number of days in a year; it takes a company to collect a debt
from customers. The lower the number of days, the better. On average it takes FLT a
100 days to collect its debts from customers (Brigham & Ehrhardt, 2014, p. 62). The
collections days were 91, 105, and 104 in 2016, 2017, and 2018, respectively. The
company has an ineffective credit because the number of collection days has increased
between 2016 and 2018.
Average No. of Days Inventory in Stock
The ratio evaluates the number of days it takes before inventory is sold out. The fewer
the days inventory is help before being sold, the better. FLT held its inventory for 278
Performance Analysis 9
days, 230 days, and 205 days before being sold in 2016, 2017, and 2018 respectively.
The number of days it takes to sell inventory has reduced between 2016 and 2018.
1.3. Cash management analysis
Market securities are debts or securities which can be redeemed or sold within one year.
Market securities are part of the current assets if they are most liquid and can be
converted into such within a year. Market securities are a significant part of cash
management because they contribute to the liquidity of a company (Kaplan, 2012)
(Baker & Martin, 2011, p. 121).
According to the 2018 balance sheet statement for FLT, the company had several
market securities under its current assets. The market securities are cash equivalent,
financial asset investments, and derivative cash instruments (George, 2010, p. 61).
Cash equivalents refer to the cash the company received its customers as a prepayment
before the actual delivery of products and services. FLT raised financial asset
investments through ownership claims and contractual rights (Flight Centre Travel
Group Limited, 2019, p. 43).
In 2018, FLT’s cash and cash equivalents account amounted to $ 1,272,992. The
amount comprises of the client cash ($828,456) and ($ 444,536). Likewise, financial
asset investments amounted to $204,148. The figure was constituted of Equity
investments ($1,767), and Debt securities ($ 192,684 (Flight Centre Travel Group
Limited, 2019)).
2.4. Sensitivity analysis with data provided
YEARS
0 1 2 3 4
Cash outflow -2,000,000
Price Per Unit 20 20 20 20
Units sold 300000 300000 300000 300000
Revenues 6000000 6000000 6000000 6000000
Expenses
Fixed Expenses 300000 300000 300000 300000
Variable Expenses 3600000 3600000 3600000 3600000
Total Expenses 3900000 3900000 3900000 3900000
EBITDA 2100000 2100000 2100000 2100000
Less: Depreciation 450000 450000 450000 450000
Gross Profit 1650000 1650000 1650000 1650000
Less: Tax 30% 495000 495000 495000 495000
Net Profit 1155000 1155000 1155000 1155000
Add back: Depreciation 450000 450000 450000 450000
Add: Residual Value 200000
Add: Working Capital 600000
CASH FLOW -2000000 1605000 1605000 1605000 2405000
⊘ This is a preview!⊘
Do you want full access?
Subscribe today to unlock all pages.
Trusted by 1+ million students worldwide
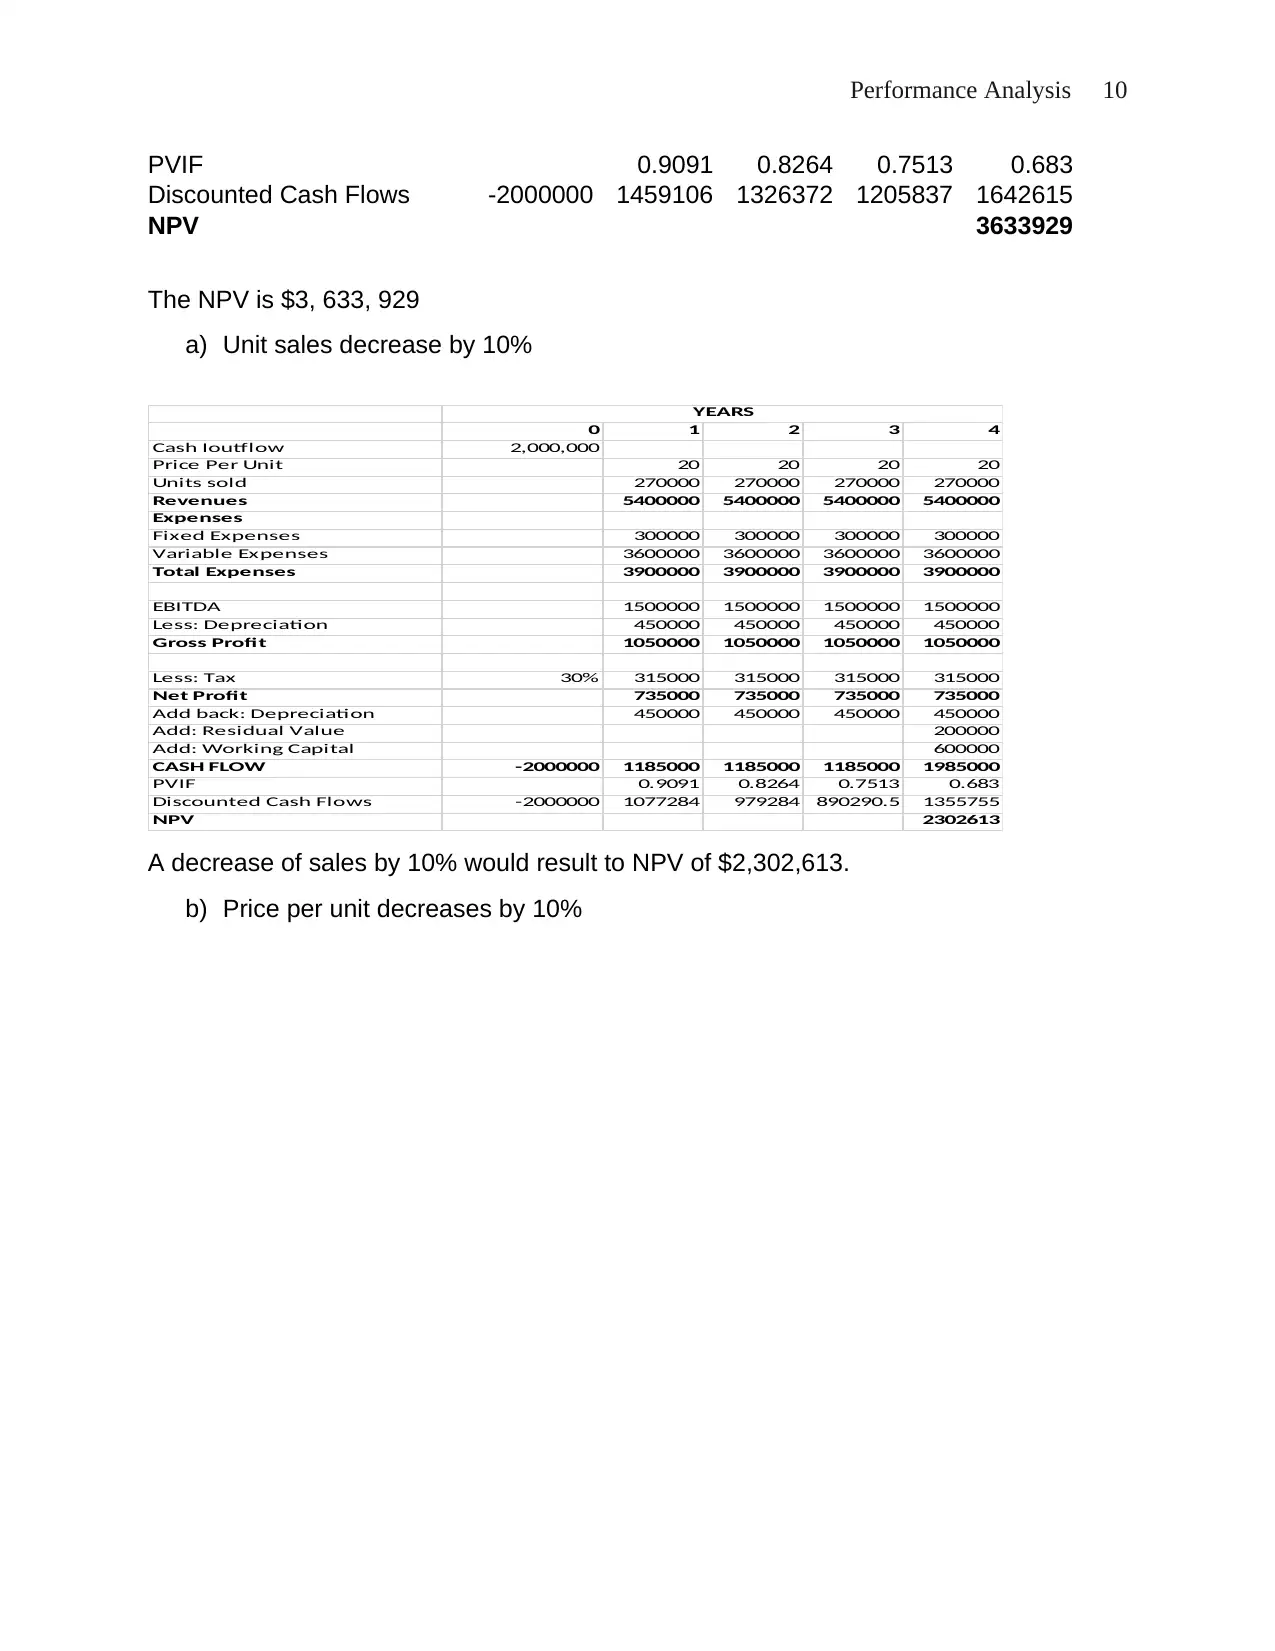
Performance Analysis 10
PVIF 0.9091 0.8264 0.7513 0.683
Discounted Cash Flows -2000000 1459106 1326372 1205837 1642615
NPV 3633929
The NPV is $3, 633, 929
a) Unit sales decrease by 10%
0 1 2 3 4
Cash Ioutflow 2,000,000
Price Per Unit 20 20 20 20
Units sold 270000 270000 270000 270000
Revenues 5400000 5400000 5400000 5400000
Expenses
Fixed Expenses 300000 300000 300000 300000
Variable Expenses 3600000 3600000 3600000 3600000
Total Expenses 3900000 3900000 3900000 3900000
EBITDA 1500000 1500000 1500000 1500000
Less: Depreciation 450000 450000 450000 450000
Gross Profit 1050000 1050000 1050000 1050000
Less: Tax 30% 315000 315000 315000 315000
Net Profit 735000 735000 735000 735000
Add back: Depreciation 450000 450000 450000 450000
Add: Residual Value 200000
Add: Working Capital 600000
CASH FLOW -2000000 1185000 1185000 1185000 1985000
PVIF 0.9091 0.8264 0.7513 0.683
Discounted Cash Flows -2000000 1077284 979284 890290.5 1355755
NPV 2302613
YEARS
A decrease of sales by 10% would result to NPV of $2,302,613.
b) Price per unit decreases by 10%
PVIF 0.9091 0.8264 0.7513 0.683
Discounted Cash Flows -2000000 1459106 1326372 1205837 1642615
NPV 3633929
The NPV is $3, 633, 929
a) Unit sales decrease by 10%
0 1 2 3 4
Cash Ioutflow 2,000,000
Price Per Unit 20 20 20 20
Units sold 270000 270000 270000 270000
Revenues 5400000 5400000 5400000 5400000
Expenses
Fixed Expenses 300000 300000 300000 300000
Variable Expenses 3600000 3600000 3600000 3600000
Total Expenses 3900000 3900000 3900000 3900000
EBITDA 1500000 1500000 1500000 1500000
Less: Depreciation 450000 450000 450000 450000
Gross Profit 1050000 1050000 1050000 1050000
Less: Tax 30% 315000 315000 315000 315000
Net Profit 735000 735000 735000 735000
Add back: Depreciation 450000 450000 450000 450000
Add: Residual Value 200000
Add: Working Capital 600000
CASH FLOW -2000000 1185000 1185000 1185000 1985000
PVIF 0.9091 0.8264 0.7513 0.683
Discounted Cash Flows -2000000 1077284 979284 890290.5 1355755
NPV 2302613
YEARS
A decrease of sales by 10% would result to NPV of $2,302,613.
b) Price per unit decreases by 10%
Paraphrase This Document
Need a fresh take? Get an instant paraphrase of this document with our AI Paraphraser
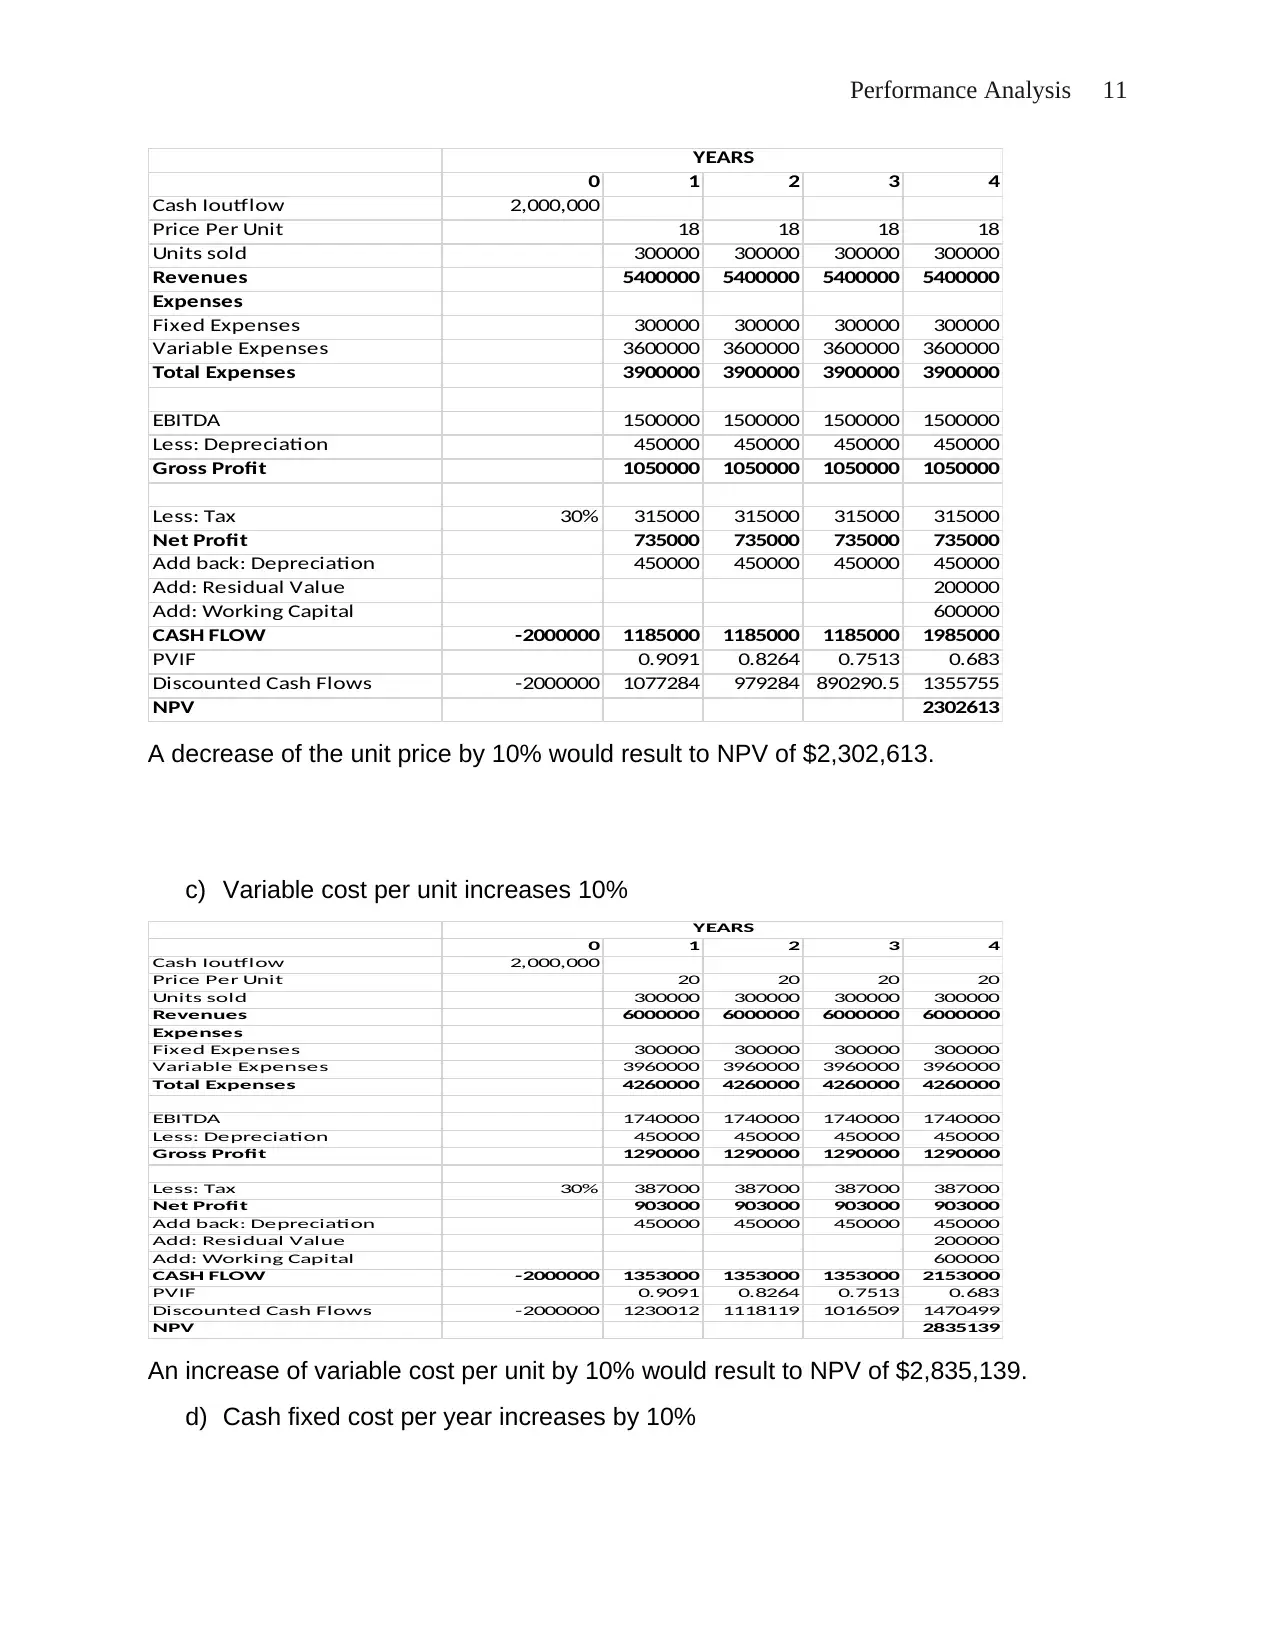
Performance Analysis 11
0 1 2 3 4
Cash Ioutflow 2,000,000
Price Per Unit 18 18 18 18
Units sold 300000 300000 300000 300000
Revenues 5400000 5400000 5400000 5400000
Expenses
Fixed Expenses 300000 300000 300000 300000
Variable Expenses 3600000 3600000 3600000 3600000
Total Expenses 3900000 3900000 3900000 3900000
EBITDA 1500000 1500000 1500000 1500000
Less: Depreciation 450000 450000 450000 450000
Gross Profit 1050000 1050000 1050000 1050000
Less: Tax 30% 315000 315000 315000 315000
Net Profit 735000 735000 735000 735000
Add back: Depreciation 450000 450000 450000 450000
Add: Residual Value 200000
Add: Working Capital 600000
CASH FLOW -2000000 1185000 1185000 1185000 1985000
PVIF 0.9091 0.8264 0.7513 0.683
Discounted Cash Flows -2000000 1077284 979284 890290.5 1355755
NPV 2302613
YEARS
A decrease of the unit price by 10% would result to NPV of $2,302,613.
c) Variable cost per unit increases 10%
0 1 2 3 4
Cash Ioutflow 2,000,000
Price Per Unit 20 20 20 20
Units sold 300000 300000 300000 300000
Revenues 6000000 6000000 6000000 6000000
Expenses
Fixed Expenses 300000 300000 300000 300000
Variable Expenses 3960000 3960000 3960000 3960000
Total Expenses 4260000 4260000 4260000 4260000
EBITDA 1740000 1740000 1740000 1740000
Less: Depreciation 450000 450000 450000 450000
Gross Profit 1290000 1290000 1290000 1290000
Less: Tax 30% 387000 387000 387000 387000
Net Profit 903000 903000 903000 903000
Add back: Depreciation 450000 450000 450000 450000
Add: Residual Value 200000
Add: Working Capital 600000
CASH FLOW -2000000 1353000 1353000 1353000 2153000
PVIF 0.9091 0.8264 0.7513 0.683
Discounted Cash Flows -2000000 1230012 1118119 1016509 1470499
NPV 2835139
YEARS
An increase of variable cost per unit by 10% would result to NPV of $2,835,139.
d) Cash fixed cost per year increases by 10%
0 1 2 3 4
Cash Ioutflow 2,000,000
Price Per Unit 18 18 18 18
Units sold 300000 300000 300000 300000
Revenues 5400000 5400000 5400000 5400000
Expenses
Fixed Expenses 300000 300000 300000 300000
Variable Expenses 3600000 3600000 3600000 3600000
Total Expenses 3900000 3900000 3900000 3900000
EBITDA 1500000 1500000 1500000 1500000
Less: Depreciation 450000 450000 450000 450000
Gross Profit 1050000 1050000 1050000 1050000
Less: Tax 30% 315000 315000 315000 315000
Net Profit 735000 735000 735000 735000
Add back: Depreciation 450000 450000 450000 450000
Add: Residual Value 200000
Add: Working Capital 600000
CASH FLOW -2000000 1185000 1185000 1185000 1985000
PVIF 0.9091 0.8264 0.7513 0.683
Discounted Cash Flows -2000000 1077284 979284 890290.5 1355755
NPV 2302613
YEARS
A decrease of the unit price by 10% would result to NPV of $2,302,613.
c) Variable cost per unit increases 10%
0 1 2 3 4
Cash Ioutflow 2,000,000
Price Per Unit 20 20 20 20
Units sold 300000 300000 300000 300000
Revenues 6000000 6000000 6000000 6000000
Expenses
Fixed Expenses 300000 300000 300000 300000
Variable Expenses 3960000 3960000 3960000 3960000
Total Expenses 4260000 4260000 4260000 4260000
EBITDA 1740000 1740000 1740000 1740000
Less: Depreciation 450000 450000 450000 450000
Gross Profit 1290000 1290000 1290000 1290000
Less: Tax 30% 387000 387000 387000 387000
Net Profit 903000 903000 903000 903000
Add back: Depreciation 450000 450000 450000 450000
Add: Residual Value 200000
Add: Working Capital 600000
CASH FLOW -2000000 1353000 1353000 1353000 2153000
PVIF 0.9091 0.8264 0.7513 0.683
Discounted Cash Flows -2000000 1230012 1118119 1016509 1470499
NPV 2835139
YEARS
An increase of variable cost per unit by 10% would result to NPV of $2,835,139.
d) Cash fixed cost per year increases by 10%
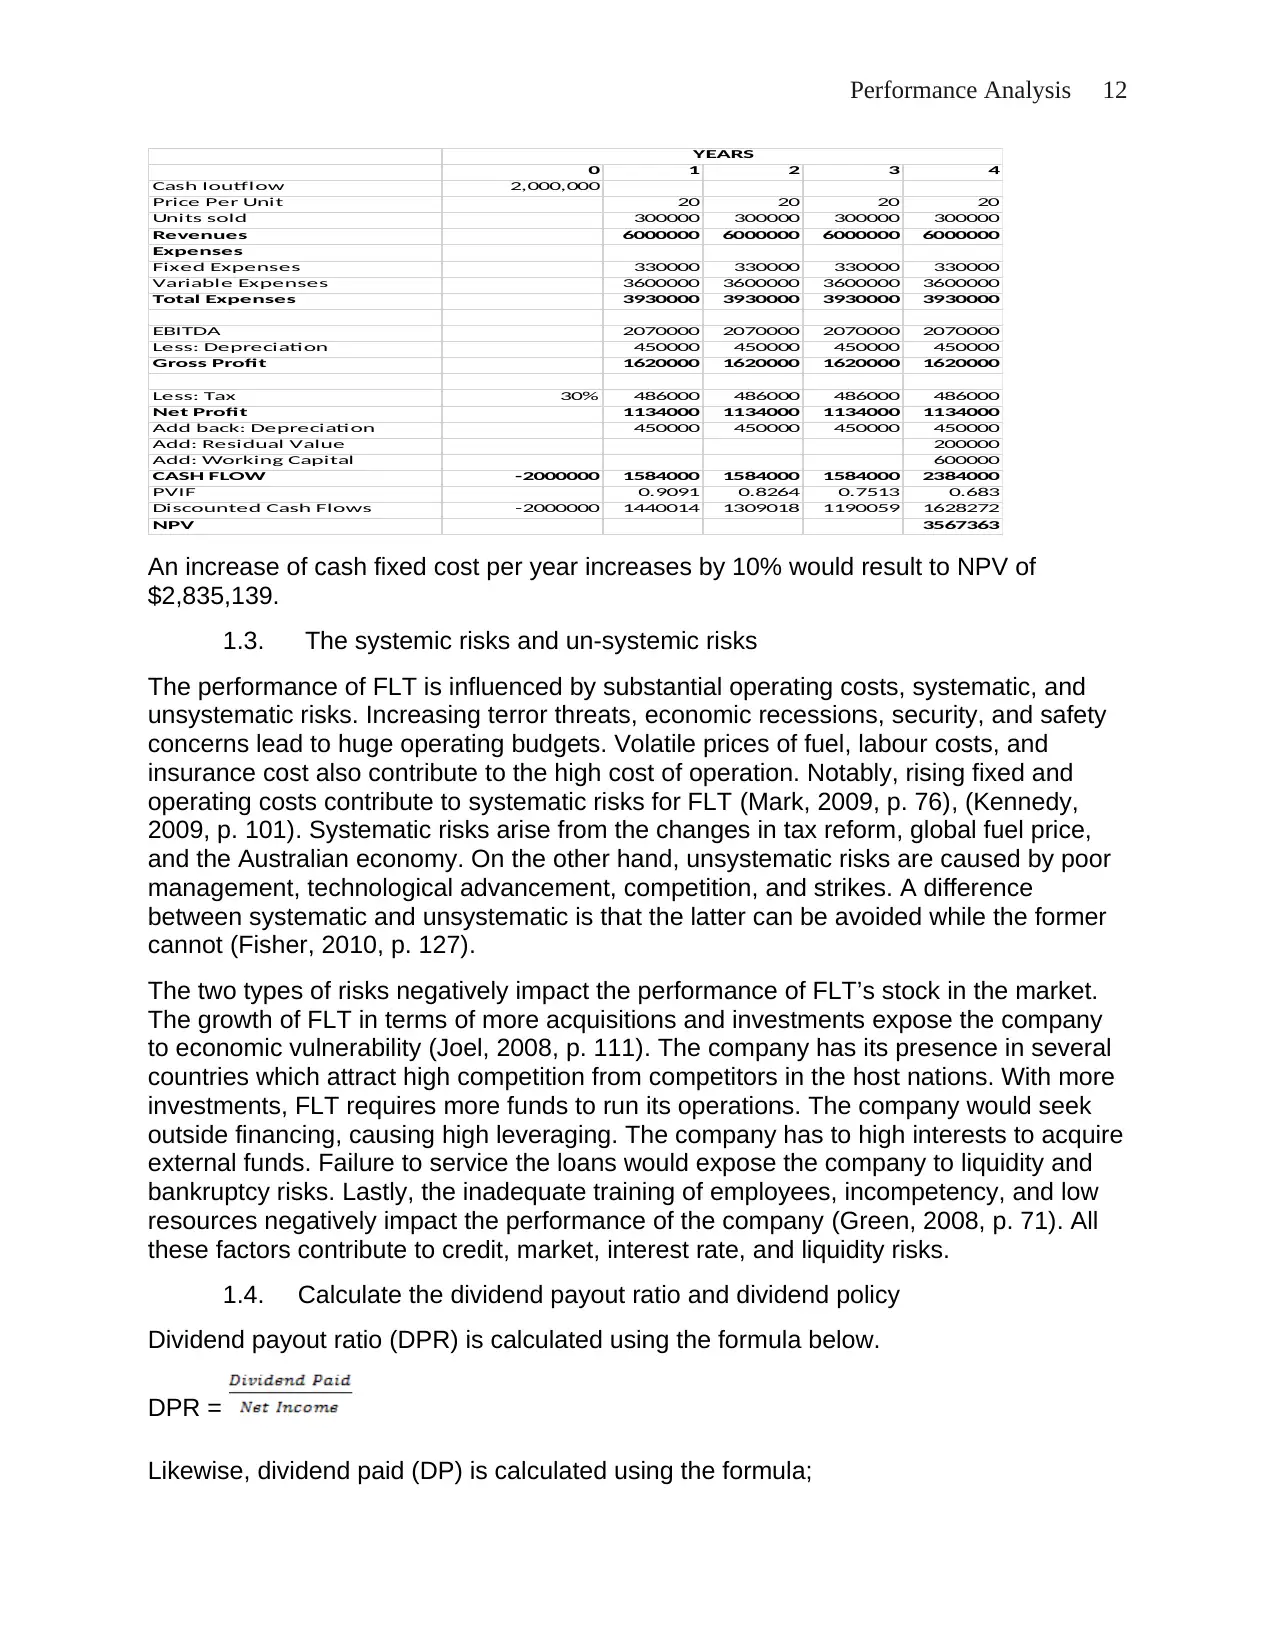
Performance Analysis 12
0 1 2 3 4
Cash Ioutflow 2,000,000
Price Per Unit 20 20 20 20
Units sold 300000 300000 300000 300000
Revenues 6000000 6000000 6000000 6000000
Expenses
Fixed Expenses 330000 330000 330000 330000
Variable Expenses 3600000 3600000 3600000 3600000
Total Expenses 3930000 3930000 3930000 3930000
EBITDA 2070000 2070000 2070000 2070000
Less: Depreciation 450000 450000 450000 450000
Gross Profit 1620000 1620000 1620000 1620000
Less: Tax 30% 486000 486000 486000 486000
Net Profit 1134000 1134000 1134000 1134000
Add back: Depreciation 450000 450000 450000 450000
Add: Residual Value 200000
Add: Working Capital 600000
CASH FLOW -2000000 1584000 1584000 1584000 2384000
PVIF 0.9091 0.8264 0.7513 0.683
Discounted Cash Flows -2000000 1440014 1309018 1190059 1628272
NPV 3567363
YEARS
An increase of cash fixed cost per year increases by 10% would result to NPV of
$2,835,139.
1.3. The systemic risks and un-systemic risks
The performance of FLT is influenced by substantial operating costs, systematic, and
unsystematic risks. Increasing terror threats, economic recessions, security, and safety
concerns lead to huge operating budgets. Volatile prices of fuel, labour costs, and
insurance cost also contribute to the high cost of operation. Notably, rising fixed and
operating costs contribute to systematic risks for FLT (Mark, 2009, p. 76), (Kennedy,
2009, p. 101). Systematic risks arise from the changes in tax reform, global fuel price,
and the Australian economy. On the other hand, unsystematic risks are caused by poor
management, technological advancement, competition, and strikes. A difference
between systematic and unsystematic is that the latter can be avoided while the former
cannot (Fisher, 2010, p. 127).
The two types of risks negatively impact the performance of FLT’s stock in the market.
The growth of FLT in terms of more acquisitions and investments expose the company
to economic vulnerability (Joel, 2008, p. 111). The company has its presence in several
countries which attract high competition from competitors in the host nations. With more
investments, FLT requires more funds to run its operations. The company would seek
outside financing, causing high leveraging. The company has to high interests to acquire
external funds. Failure to service the loans would expose the company to liquidity and
bankruptcy risks. Lastly, the inadequate training of employees, incompetency, and low
resources negatively impact the performance of the company (Green, 2008, p. 71). All
these factors contribute to credit, market, interest rate, and liquidity risks.
1.4. Calculate the dividend payout ratio and dividend policy
Dividend payout ratio (DPR) is calculated using the formula below.
DPR =
Likewise, dividend paid (DP) is calculated using the formula;
⊘ This is a preview!⊘
Do you want full access?
Subscribe today to unlock all pages.
Trusted by 1+ million students worldwide
1 out of 16
Related Documents


Your All-in-One AI-Powered Toolkit for Academic Success.
+13062052269
info@desklib.com
Available 24*7 on WhatsApp / Email
![[object Object]](/_next/static/media/star-bottom.7253800d.svg)
Unlock your academic potential
Copyright © 2020–2026 A2Z Services. All Rights Reserved. Developed and managed by ZUCOL.