MOD004944 Hydrology Project: Flood Management Analysis

Verified

Added on  2022/09/14

|5
|327
|17
Project
AI Summary
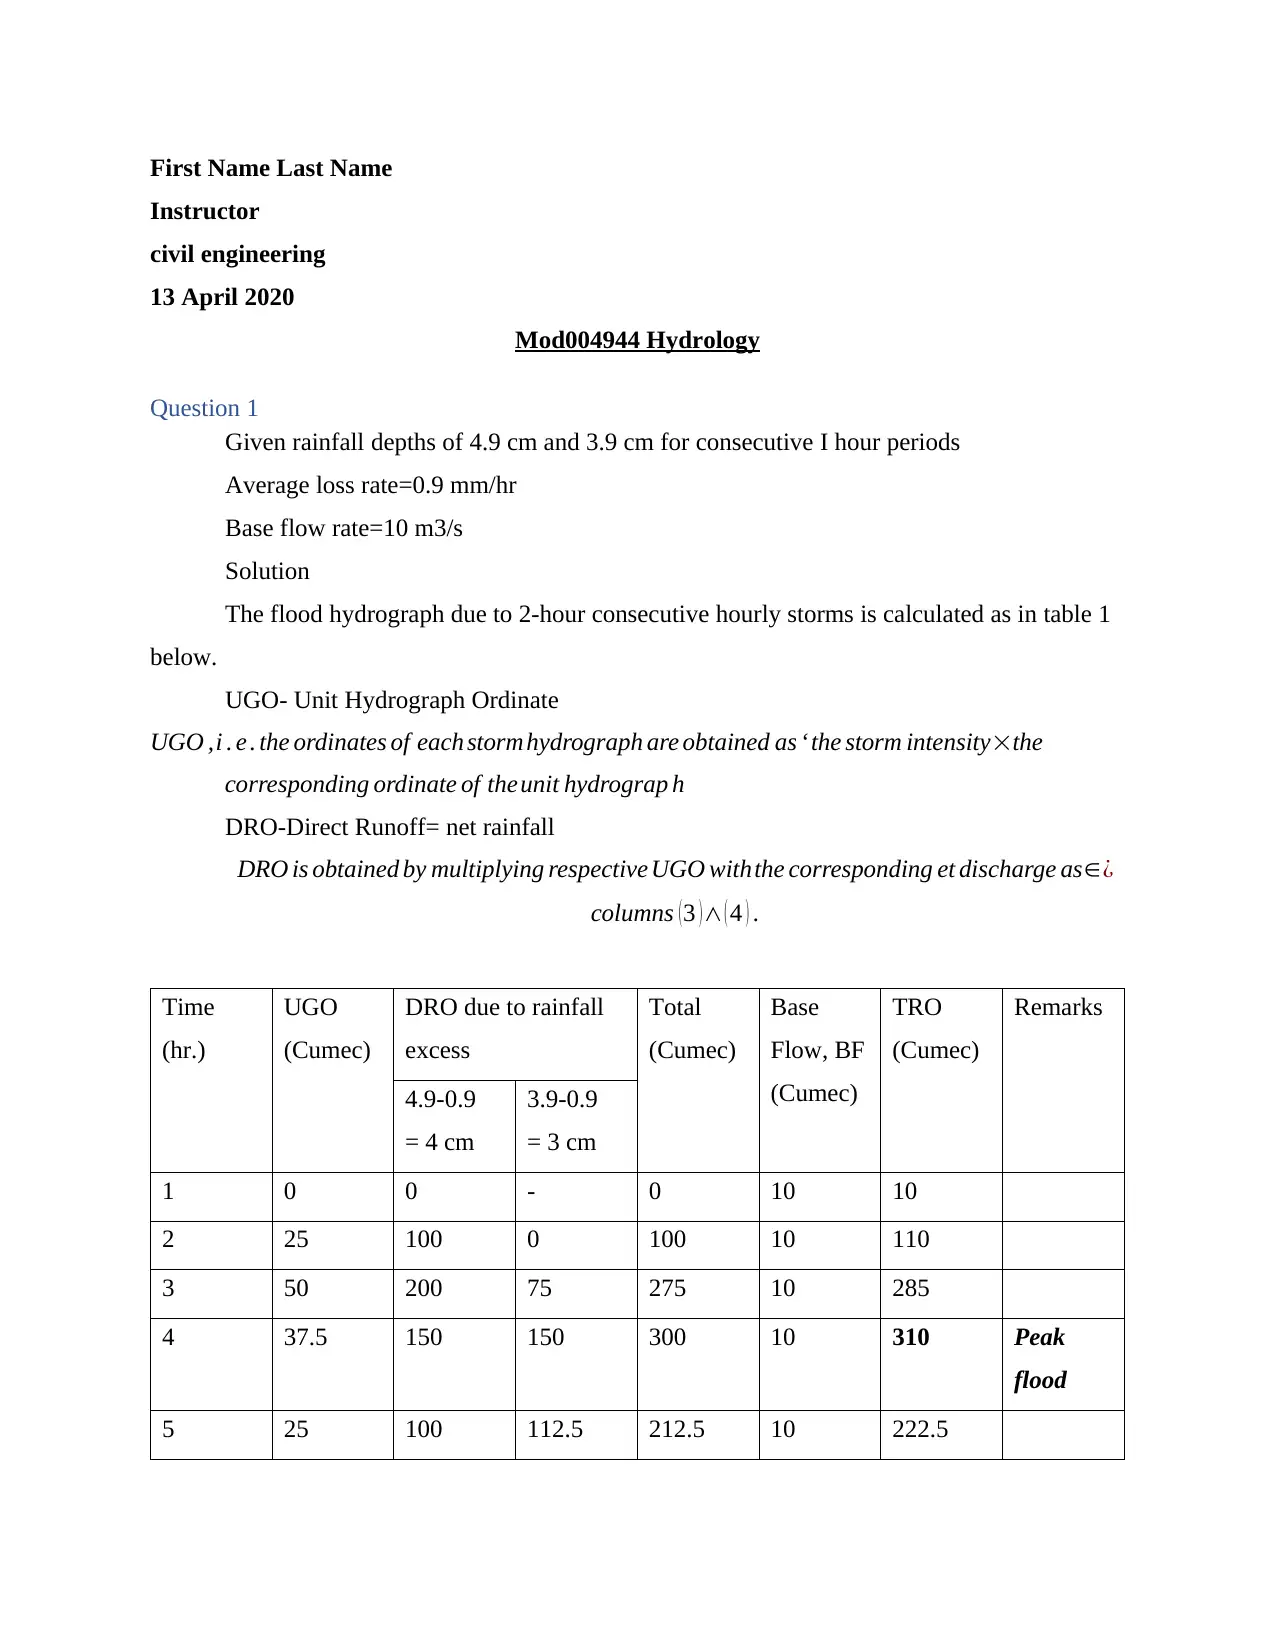
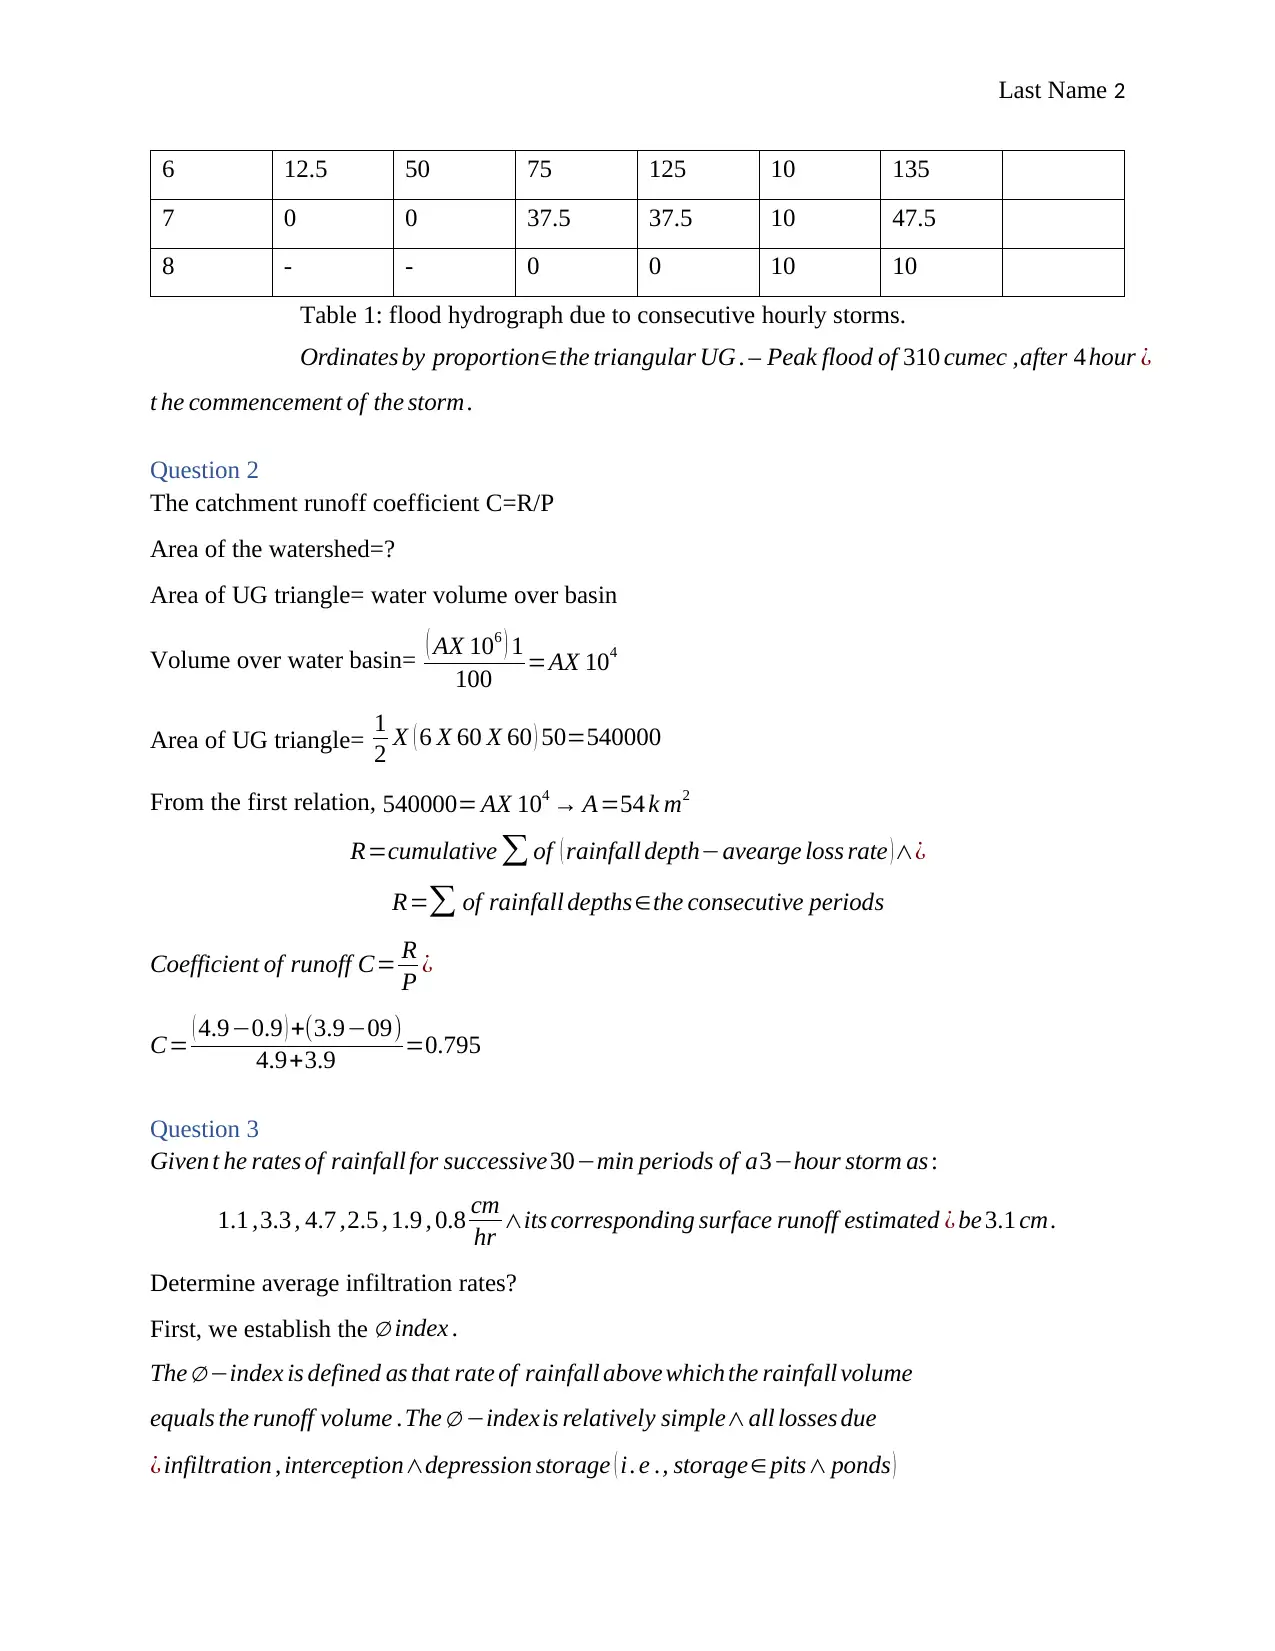
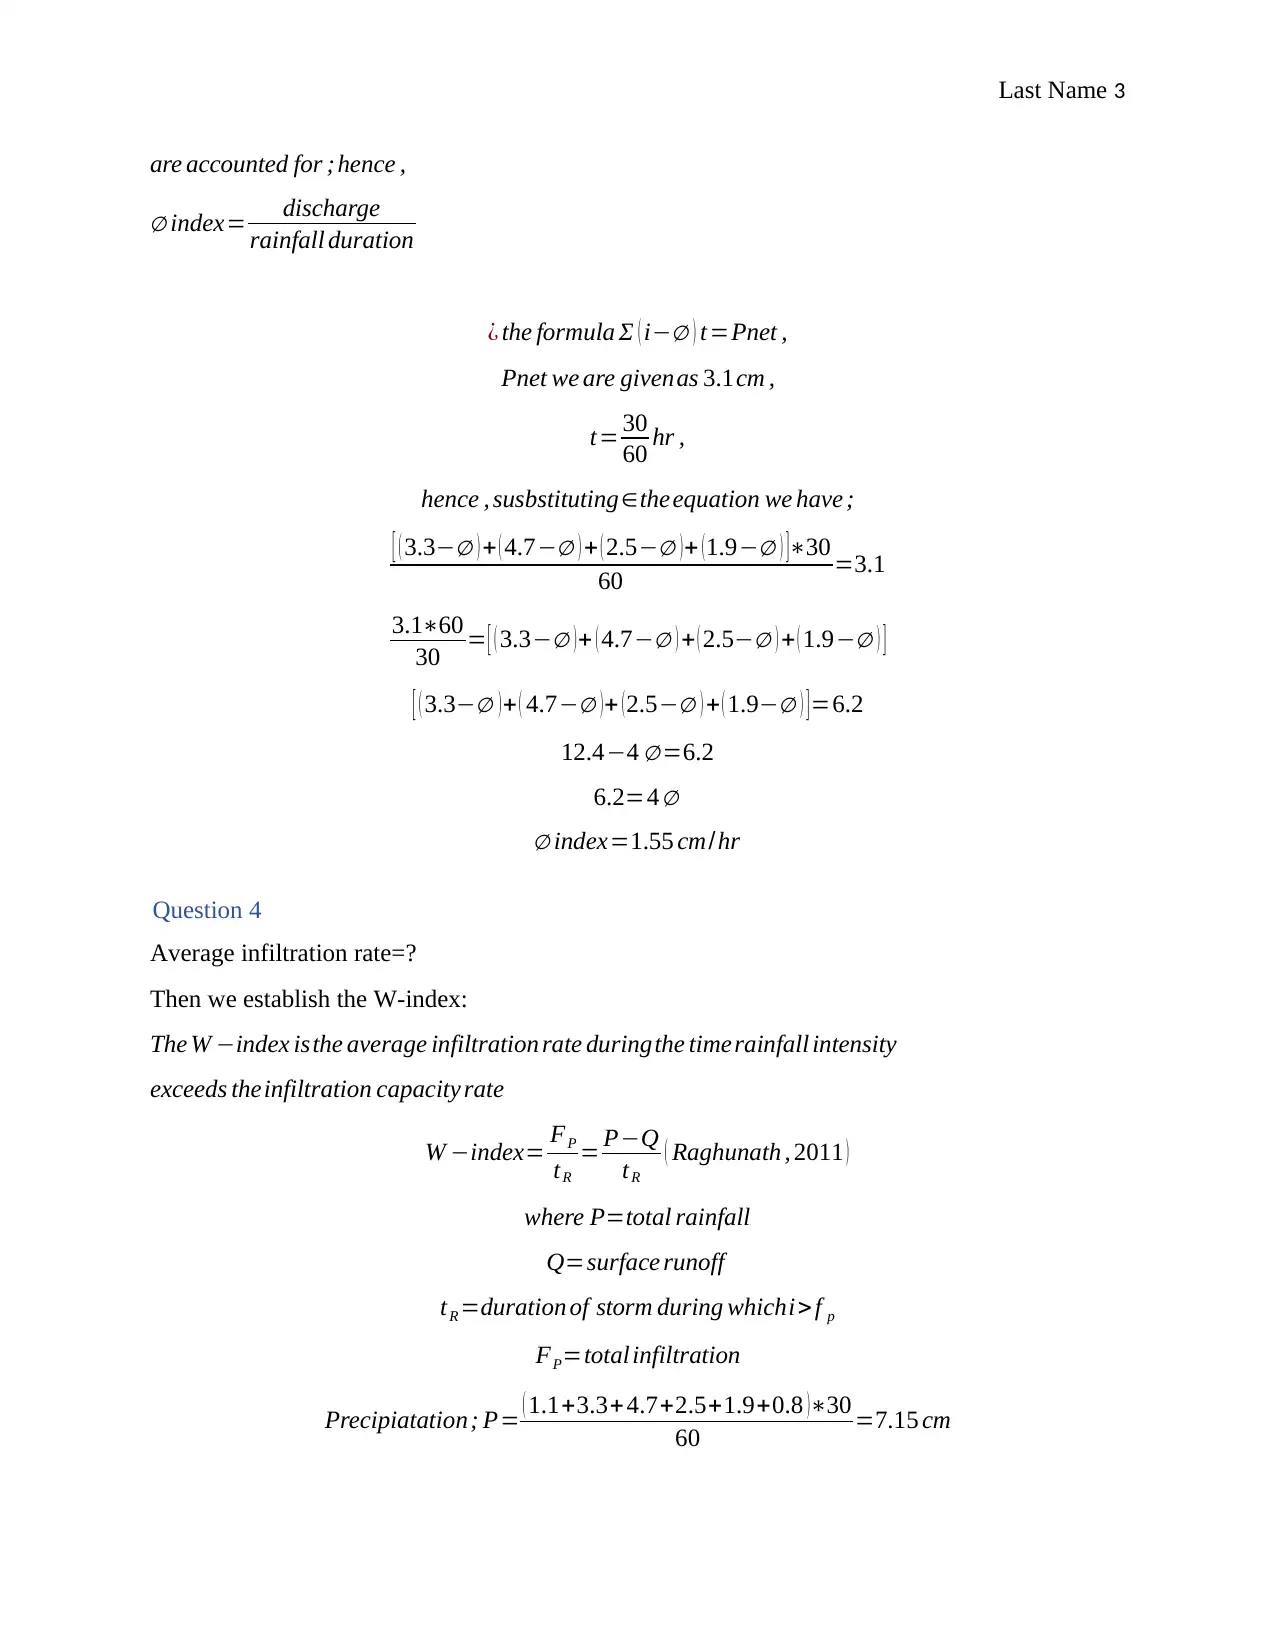
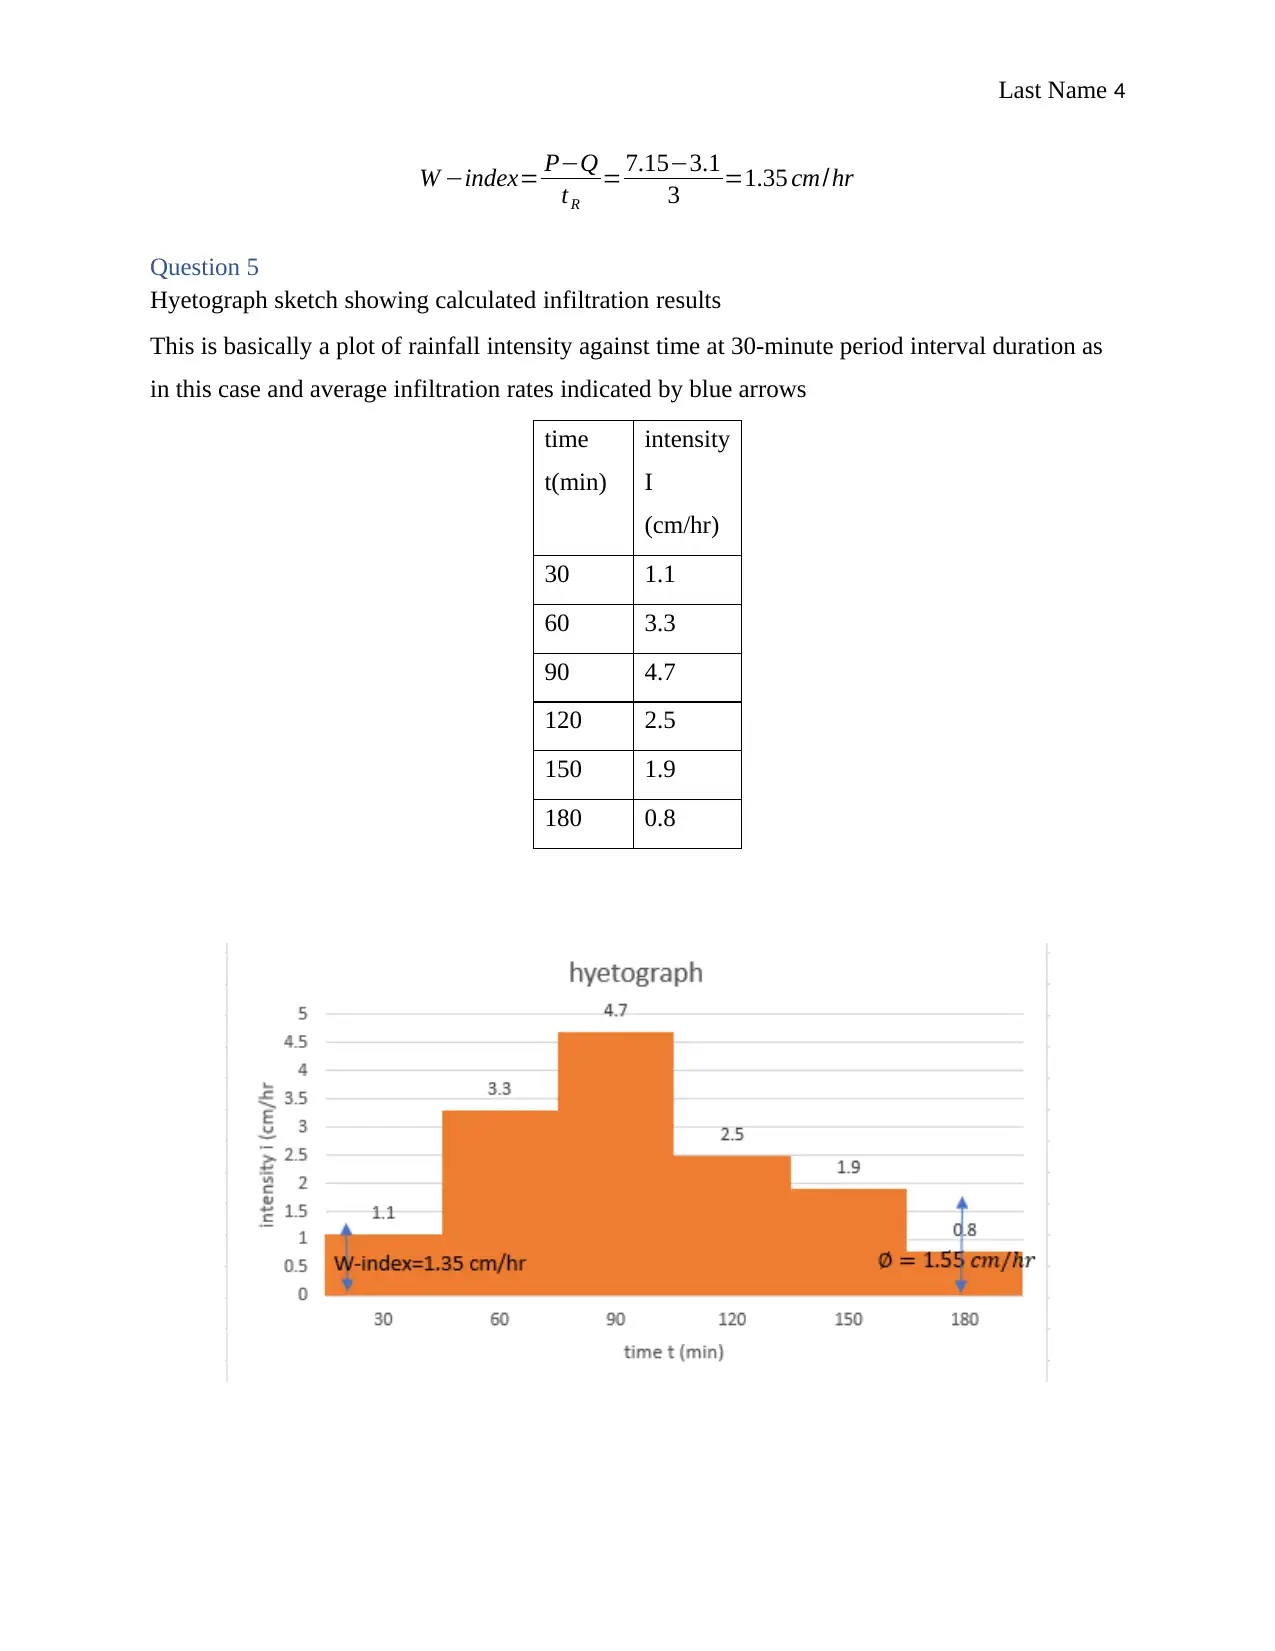
This hydrology project addresses flood management in an urban area, focusing on a semi-gauged catchment. The project utilizes given rainfall data, loss rates, and base flow to determine the flood hydrograph at the catchment outlet. It calculates the catchment runoff coefficient and analyzes rainfall data to determine average infiltration rates and create a hyetograph illustrating infiltration results. The solution employs a 1-hr Unit Hydrograph approximated by a triangle and provides detailed calculations for each task, including tables and explanations. The project aims to equip students with the skills to analyze flood events and understand the relationship between rainfall, runoff, and infiltration.
Document Page
First Name Last Name
Instructor
civil engineering
13 April 2020
Mod004944 Hydrology
Question 1
Given rainfall depths of 4.9 cm and 3.9 cm for consecutive I hour periods
Average loss rate=0.9 mm/hr
Base flow rate=10 m3/s
Solution
The flood hydrograph due to 2-hour consecutive hourly storms is calculated as in table 1
below.
UGO- Unit Hydrograph Ordinate
UGO ,i . e . the ordinates of each storm hydrograph are obtained as the storm intensity×the
corresponding ordinate of theunit hydrograp h
DRO-Direct Runoff= net rainfall
DRO is obtained by multiplying respective UGO withthe corresponding et discharge as¿
columns (3 ) ( 4 ) .
Time
(hr.)
UGO
(Cumec)
DRO due to rainfall
excess
Total
(Cumec)
Base
Flow, BF
(Cumec)
TRO
(Cumec)
Remarks
4.9-0.9
= 4 cm
3.9-0.9
= 3 cm
1 0 0 - 0 10 10
2 25 100 0 100 10 110
3 50 200 75 275 10 285
4 37.5 150 150 300 10 310 Peak
flood
5 25 100 112.5 212.5 10 222.5
tabler-icon-diamond-filled.svg

Paraphrase This Document

Need a fresh take? Get an instant paraphrase of this document with our AI Paraphraser
Document Page
Last Name 2
6 12.5 50 75 125 10 135
7 0 0 37.5 37.5 10 47.5
8 - - 0 0 10 10
Table 1: flood hydrograph due to consecutive hourly storms.
Ordinates by proportionthe triangular UG . Peak flood of 310 cumec ,after 4 hour ¿
t he commencement of the storm .
Question 2
The catchment runoff coefficient C=R/P
Area of the watershed=?
Area of UG triangle= water volume over basin
Volume over water basin= ( AX 106 ) 1
100 =AX 104
Area of UG triangle= 1
2 X ( 6 X 60 X 60 ) 50=540000
From the first relation, 540000= AX 104 A=54 k m2
R=cumulative of ( rainfall depthavearge loss rate ) ¿
R= of rainfall depthsthe consecutive periods
Coefficient of runoff C= R
P ¿
C= ( 4.90.9 ) +(3.909)
4.9+3.9 =0.795
Question 3
Given t he rates of rainfall for successive30min periods of a3hour storm as :
1.1 ,3.3 , 4.7 ,2.5 , 1.9 , 0.8 cm
hr its corresponding surface runoff estimated ¿ be 3.1 cm.
Determine average infiltration rates?
First, we establish the index .
The index is defined as that rate of rainfall above which the rainfall volume
equals the runoff volume .The indexis relatively simpleall losses due
¿ infiltration , interceptiondepression storage ( i. e ., storage pits ponds )
Document Page
Last Name 3
are accounted for ;hence ,
index= discharge
rainfall duration
¿ the formula Ʃ ( i ) t=Pnet ,
Pnet we are givenas 3.1cm ,
t= 30
60 hr ,
hence , susbstitutingtheequation we have ;
[ ( 3.3 ) + ( 4.7 ) + ( 2.5 )+ (1.9 ) ]30
60 =3.1
3.160
30 = [ ( 3.3 ) + ( 4.7 ) + ( 2.5 ) + ( 1.9 ) ]
[ ( 3.3 )+ ( 4.7 )+ (2.5 ) + ( 1.9 ) ]=6.2
12.44 =6.2
6.2=4
index=1.55 cm/hr
Question 4
Average infiltration rate=?
Then we establish the W-index:
The W index isthe average infiltration rate duringthe timerainfall intensity
exceeds theinfiltration capacity rate
W index= FP
tR
= PQ
tR
( Raghunath , 2011 )
where P=total rainfall
Q=surface runoff
tR =duration of storm during whichi>f p
FP=total infiltration
Precipiatation; P= ( 1.1+3.3+ 4.7+2.5+1.9+0.8 )30
60 =7.15 cm
Document Page
Last Name 4
W index= PQ
tR
= 7.153.1
3 =1.35 cm/hr
Question 5
Hyetograph sketch showing calculated infiltration results
This is basically a plot of rainfall intensity against time at 30-minute period interval duration as
in this case and average infiltration rates indicated by blue arrows
time
t(min)
intensity
I
(cm/hr)
30 1.1
60 3.3
90 4.7
120 2.5
150 1.9
180 0.8
tabler-icon-diamond-filled.svg

Paraphrase This Document

Need a fresh take? Get an instant paraphrase of this document with our AI Paraphraser
Document Page
Last Name 5
References
Raghunath, H.M. (2013) Hydrology: principles, analysis, and design. New Delhi, New Age
International.
Raghunath, H.M. (2011) Hydrology principles, analysis and design. New York, Wiley.
chevron_up_icon
1 out of 5
circle_padding
hide_on_mobile
zoom_out_icon
[object Object]