Flowchart Modeling and Order Processing: A System Analysis Report

Verified

Added on  2023/06/03

|5
|657
|196
Report
AI Summary
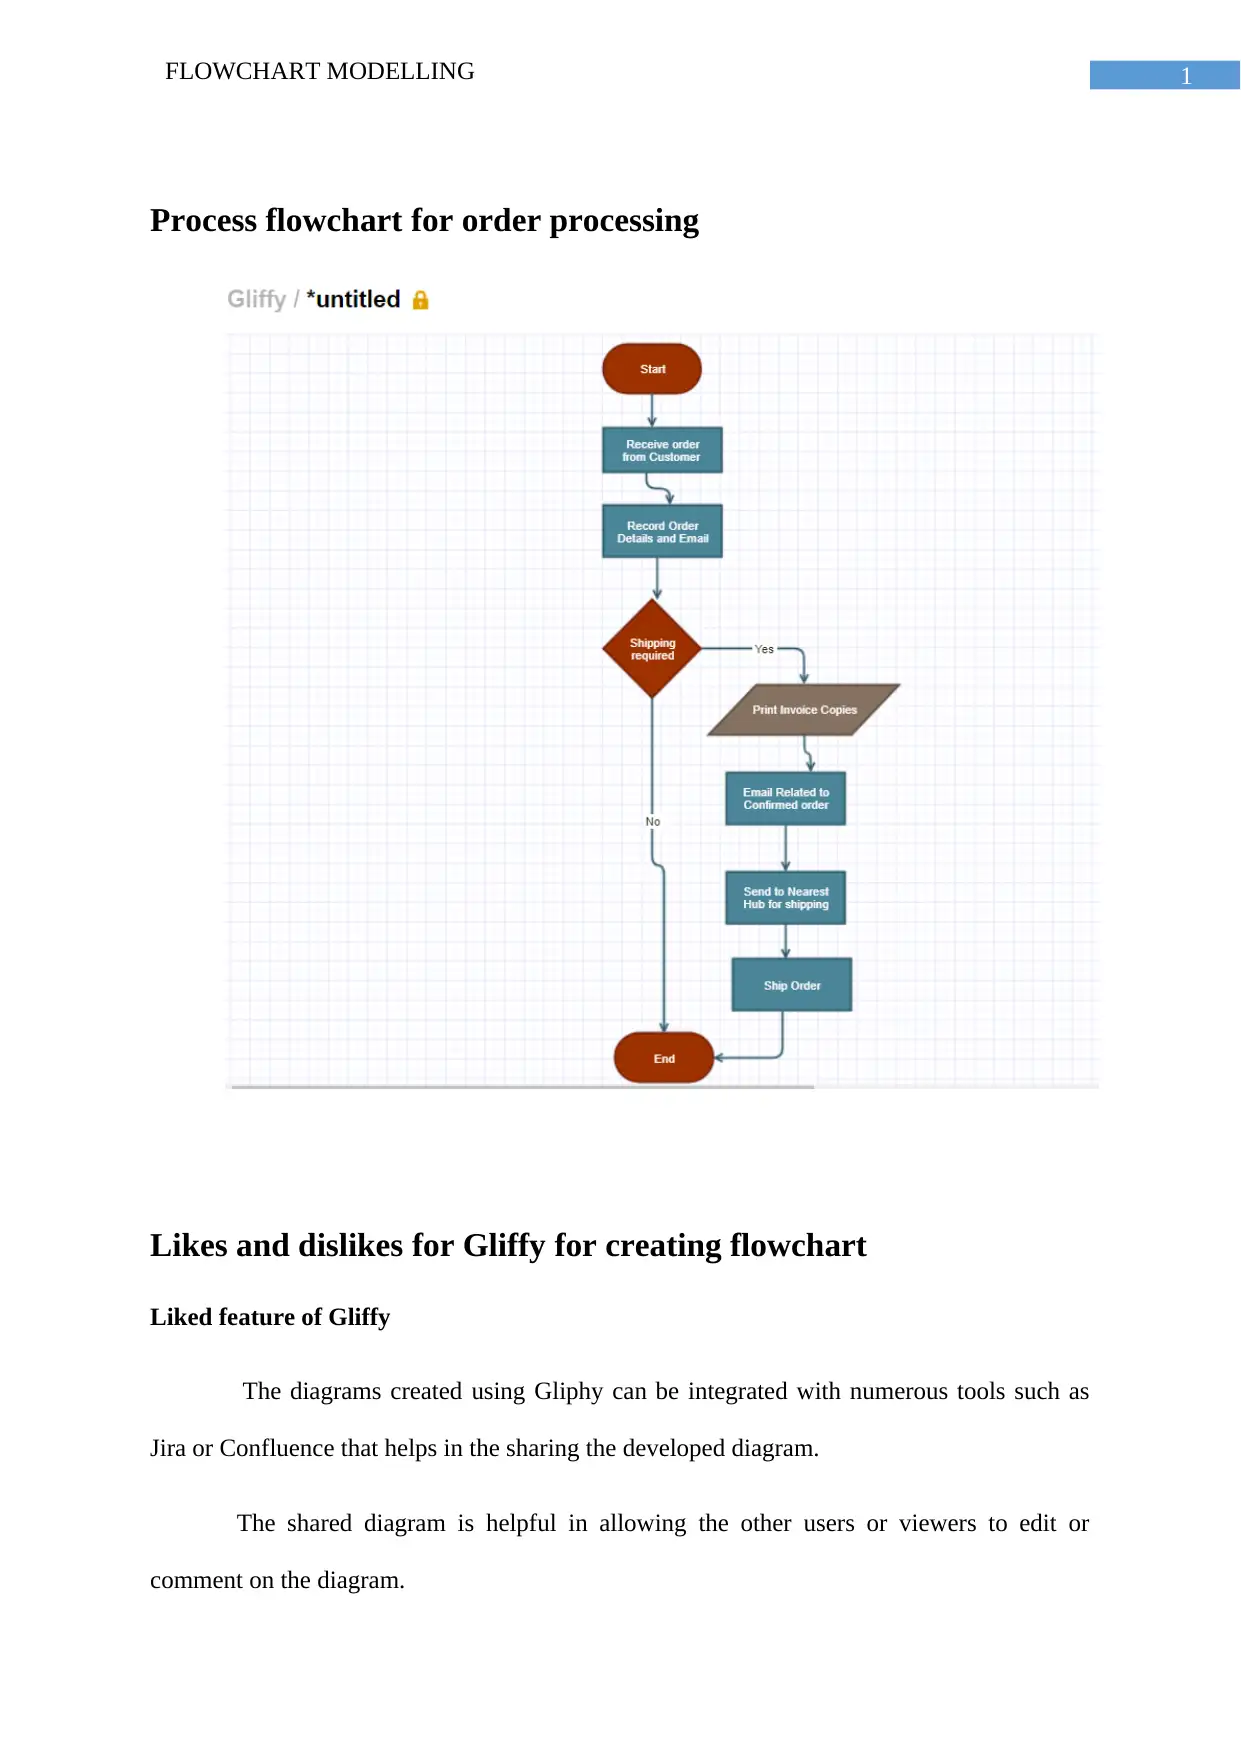
This report delves into flowchart modeling within the context of order processing, providing a system analysis perspective. It includes a process flowchart for order processing and an evaluation of Gliffy, a diagramming tool, highlighting its liked features such as integration with Jira and Confluence for collaborative editing and version tracking, while also noting dislikes such as limited templates, slow performance with complex diagrams, and costly licensing. Alternative diagramming tools like draw.io and Lucidchart are suggested due to their affordability and usability. The report emphasizes the importance of process diagramming from a management perspective, detailing how it aids in understanding system processes, documenting workflows, improving processes, and facilitating performance evaluation and decision-making. It also addresses how flowchart modeling assists in tracing information flow, identifying key decision points, and pinpointing potential system failures, referencing relevant academic sources to support its analysis. Desklib provides students access to this and other solved assignments.
tabler-icon-diamond-filled.svg

Contribute Materials

Your contribution can guide someone’s learning journey. Share your documents today.
Document Page
Running head: FLOWCHART MODELLING
Flowchart modelling
Name of the Student
Name of the University
Authors note
tabler-icon-diamond-filled.svg

Secure Best Marks with AI Grader

Need help grading? Try our AI Grader for instant feedback on your assignments.
Document Page
1FLOWCHART MODELLING
Process flowchart for order processing
Likes and dislikes for Gliffy for creating flowchart
Liked feature of Gliffy
The diagrams created using Gliphy can be integrated with numerous tools such as
Jira or Confluence that helps in the sharing the developed diagram.
The shared diagram is helpful in allowing the other users or viewers to edit or
comment on the diagram.
Document Page
2FLOWCHART MODELLING
Moreover, it also allows the users to view the previous versions of the diagram (when
the diagram is edited by the other team members).
Dislikes for Gliffy
This online tool does not provide enough number of templates to get started for the
new system analysts.
With the increasing number of objects, the online tool gets slowed down.
Users of Gliffy cannot export the created models to Visio, HTML or PDFs formats.
Collaboration features lack more advanced tools seen in other diagramming software.
Licencing of this tool is too costly for commercial use in diagram creation.
Program/applications that can be preferred over the mentioned
software
In order to develop process diagrams there are multiple other options that provides
better features compared to the Gliffy. Some of them are listed below; draw.io, SmartDraw,
Lucid chart and so on.
This tools provide much more affordable licencing cost compared to Gliffy’s one of
the most expensive add on for projects. Along with that large number of templates and
elements to draw the diagrams.
Moreover, the commercial use of diagrams developed using the Gliffy is also no
permitted by the Gliffy where as other platforms like draw.io provides better usability of the
developed diagrams.
Document Page
3FLOWCHART MODELLING
In terms of tracking the revision history of the created diagram, the draw.io provides
better coverages through the use of confluence. In case of the Gliffy, it can only track the
changes done using the same tool.
Purpose of diagramming a process and importance to have an
understanding of this from a management perspective
In order to develop a system, the process flowchart helps in analysis of the different
processes and modules of the system so that interaction can be understood. This can be
considered as a system design tool which is helpful in documenting a process, improve a
process one or model one. It is also useful for gathering information of a process as a utility
in performance evaluation or decision making for a system. With the sequence of activities
required for completing a process and the actors those are responsible for those activities.
From the management perspective, this helps in tracing the flow of information and
authority of a process in case something goes wrong. In addition to that, it also helps in
highlighting the key processing and decision points of a proposed system. This will help to
point out the point of failure.
tabler-icon-diamond-filled.svg

Secure Best Marks with AI Grader

Need help grading? Try our AI Grader for instant feedback on your assignments.
Document Page
4FLOWCHART MODELLING
Bibliography
Banjo, O. O. (2017). Software Bugs: Detection, Analysis and Fixing (Doctoral
dissertation).
Buede, D. M., & Miller, W. D. (2016). The engineering design of systems: models
and methods. John Wiley & Sons.
Robbins, H. A. (2017). U.S. Patent No. 9,672,010. Washington, DC: U.S. Patent and
Trademark Office.
Ryu, S., Tsuji, K., & Tominaga, H. (2017, July). Analysis of Modeling Design of
Control Java Programming Exercise for Game Subjects and a Traveling Machine with LEGO
Mindstorms. In The Third International Conference on Electronics and Software Science
(ICESS2017) (p. 110).
chevron_up_icon
1 out of 5
circle_padding
hide_on_mobile
zoom_out_icon
logo.png

Your All-in-One AI-Powered Toolkit for Academic Success.

Available 24*7 on WhatsApp / Email

[object Object]