Data Science Report: Analyzing FluffyGroco's Insect Infestation Data
VerifiedAdded on 2022/09/18
|18
|5256
|23
Report
AI Summary
This report provides a comprehensive analysis of FluffyGroco's data concerning Crackety Crickling insect infestations across their plantations. It begins with an assessment of FluffyGroco’s briefing note, evaluating the data collection process and outlining the steps of data analysis. The report then discusses the advantages of grouped data, standard deviation, and the mean, along with an overview of the investigation methods used, including fair testing, identifying and classifying, researching, pattern seeking, and modeling. The analysis includes data collected over two weeks from a tree plantation, calculating mean and standard deviation to understand the spread of infestation. The report explores data science methods like linear regression and predictive modeling to identify patterns. It also evaluates the use of Excel and SAS for data manipulation and presents ethical and security considerations. The conclusion outlines potential solutions, including targeted larvicidal treatments, and provides statistical methodologies and challenges encountered during the research.
Contents
Assessment of FluffyGroco’s Briefing Note............................................................................................2
Advantages of grouped data..........................................................................................................2
Overview of Investigation......................................................................................................................4
Fair testing.........................................................................................................................................4
Identifying and Classifying.................................................................................................................4
Researching.......................................................................................................................................4
Pattern Seeking..................................................................................................................................4
Modelling...........................................................................................................................................4
Analysis and Results..............................................................................................................................5
Advantages of Standard deviation.................................................................................................5
Advantages of the mean................................................................................................................5
Advantages of Clustered columns...............................................................................................10
Ethical and Security Considerations.....................................................................................................11
Data science in next steps and potential solutions..............................................................................12
i) Linear regression..........................................................................................................................12
ii) Graphs.........................................................................................................................................12
iii) Predictive modelling...................................................................................................................12
Excel................................................................................................................................................13
Advantages of excel.....................................................................................................................13
SAS...................................................................................................................................................13
Advantages of SAS.......................................................................................................................13
Appendix: Statistics and methodology................................................................................................14
Challenges of Researching...........................................................................................................14
References...........................................................................................................................................16
1
Paraphrase This Document
Need a fresh take? Get an instant paraphrase of this document with our AI Paraphraser
Assessment of FluffyGroco’s Briefing Note.
FluffyGroco has collected data across their plantations; Nextafoo, Randndoo, and uptagoo.
The data collected can be analyzed following the five steps of data analysis outlined;
Transcribe the data, Immersion, Coding, Grouping, and Making meaning.
Data science is a subject that employs and requires the use of systems such as software,
processes, algorithms, and scientific methods to get meaning or value from either grouped or
ungrouped data. So from the data provided by FluffyGroCo’s company can also be
manipulated following the above steps until it gives a desirable meaning. Given that
FluffyGroco’s has the aim of rolling out targeted larvicidal bacterial treatments that are
triggered by the presence of very high-risk environmental conditions. Such a role would need
to be monitored and carefully planned because there is large amount of risk and cost required
for interventions of timing treatment or inappropriate intensity. The aim of the FluffyGroCo’s
is a valid one and can be achieved after through experimentations have been done on the
collected data found to determine whether the possibility of the application working or not.
Using data science, the following aims can be achieved on the grounds of
Advantages of data science (Duit, R., 2011).
i) Data science deals with the art of making information or data better and quality for their
company.
ii) Data science makes presentations look better. It is designed to make appropriate products
or explanations that aim at providing a solution or satisfying the customer requirements
(Garfield, J.B., 2013).
ii) Data science makes an individual a better person since it involves both management and
information technology (Nielsen, J.A., 2013).
From the above advantages, data provided from FluffyGroCo’s can be manipulated and made
better for applications. The data set provided by the company contains four columns
containing date, field, infestation, rainy and temperature. The data is for the three plantations
in FluffyGroco’s; Nextafoo, uptagoo, and Rondadoo. The information is ungrouped data, so
in the process of analyzing the data, and the following challenges might be faced.
i) Grouped data can be quite expensive to implement.
ii) Grouped data is always not useful when it has homogenous subgroups.
Advantages of grouped data.
i) The data always ignores irrelevant ideas and focuses on the actual required data.
ii) Grouped data always is efficiencies in estimation activities.
iii) Grouped data is measuring the median, mode, and mean it is straightforward whether a
large sample is involved or when the small sample size is involved (Duschl, R., and J.
Osborne. 2012).
Grouped data is data that has already been classified as called classes. A class interval is
always the range from the lowest value indicated to the highest number provided in the data
set in each category (Duit, R., 2011)
The data sets provided by FluffyGroCo’s can be easily transformed into admirable data by
use of statistical techniques, equations, construction of tables, and testing of the null
hypothesis. The methods can be used to satisfy and show whether the activities to be
practiced by the company can work effectively
2

3
⊘ This is a preview!⊘
Do you want full access?
Subscribe today to unlock all pages.
Trusted by 1+ million students worldwide
Overview of Investigation.
An investigation was conducted on the Crackety Crickling insect to determine the
environmental factors it enjoyed staying in and also found the successful methods that had
been employed in curbing the number of Crackety crickling in most tree firms. The following
investigation methods were used: modeling, pattern-seeking, and researching, regular testing
and identifying and classifying.
Fair testing.
This method involves finding the relationship between variables. The technique does not
apply to technology investigations (Driver, R., P. Newton, and J. Osborne, 2010).
Identifying and Classifying.
This method involves grouping and sorting of information or data into groups. Criteria must
always be developed and applied effectively. The data that is continuously collected must
have keys to enhance the classification method. Example micro-organisms are divided into
five kingdoms that are known and commonly accepted (De Vreese, L., 2006).
Researching.
This is a process that involves the act of acquiring other individual’s opinions and research
ideas to enable a person to solve a problem or get relevant information that can accelerate the
study (Driver, R., P. Newton, and J. Osborne, 2010).
Pattern Seeking.
This an experimentation method that involves the act of observation and recording or helps in
carrying out experiments where the factors involved cannot be easily controlled. In the
application of this method, it is always advisable to record the findings to enable an
individual predict the patterns employed by each variable. The technique is suited when
studying subjects of ecology, geology, and astronomy (Clark, D., V. Sampson, A.
Weinberger, and G. Erkens, 2017)
Modeling.
The method can be used to help individuals understand how an idea or process can be
applied. In explaining different factors or variable, more than one model can be used to
ensure efficiency (Clark, D., V. Sampson, A. Weinberger, and G. Erkens, 2017)
The above-detailed methods were used in the investigations. Data was acquired from already
done researches and scientists. The data involved different factors that enhanced the growth
of the Crackety Crackling insect. A tree plantation was used for the investigation whereby
some Crackety crackling insect was brought and put to some section of the farm that
contained about 20 trees. The insects were observed on a daily basis with experienced
individuals who recorded different findings every day for two weeks.
4
Paraphrase This Document
Need a fresh take? Get an instant paraphrase of this document with our AI Paraphraser
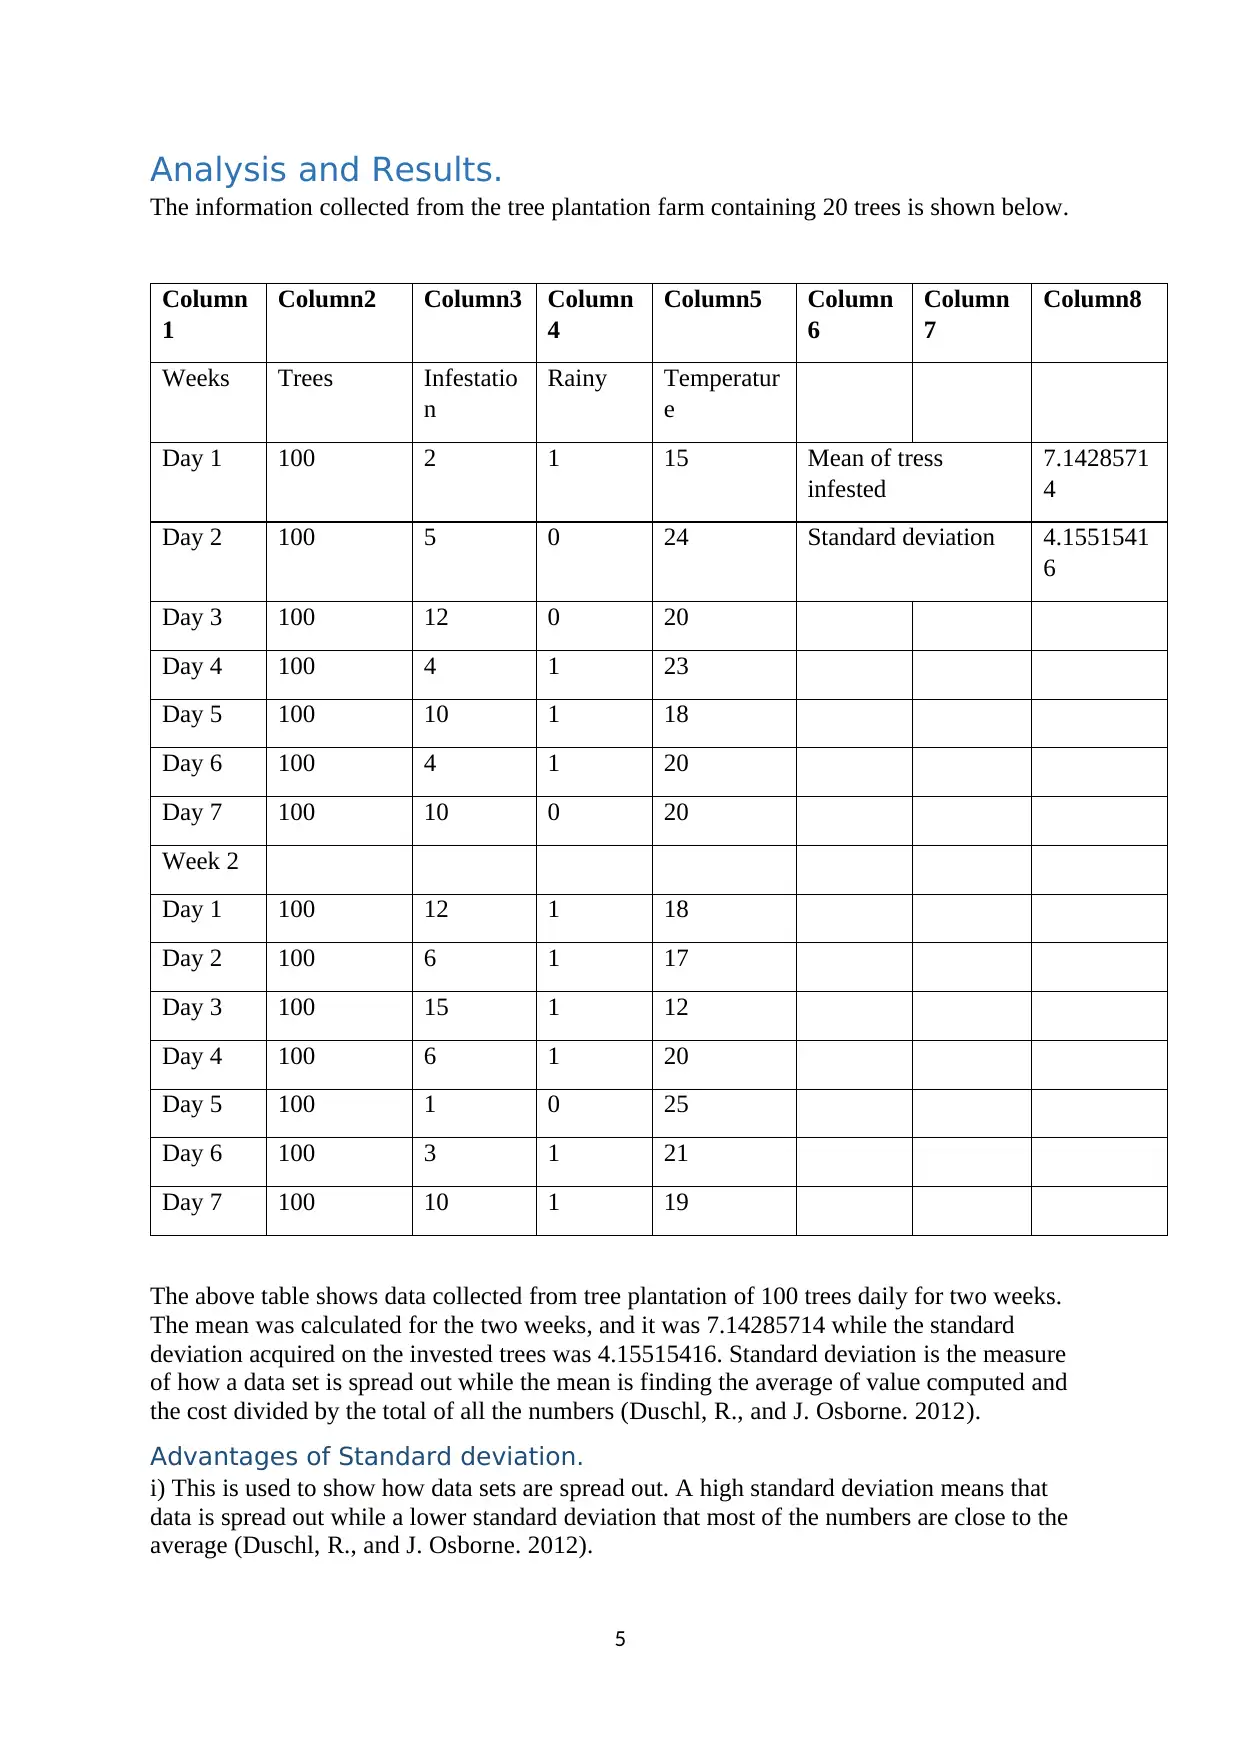
Analysis and Results.
The information collected from the tree plantation farm containing 20 trees is shown below.
Column
1
Column2 Column3 Column
4
Column5 Column
6
Column
7
Column8
Weeks Trees Infestatio
n
Rainy Temperatur
e
Day 1 100 2 1 15 Mean of tress
infested
7.1428571
4
Day 2 100 5 0 24 Standard deviation 4.1551541
6
Day 3 100 12 0 20
Day 4 100 4 1 23
Day 5 100 10 1 18
Day 6 100 4 1 20
Day 7 100 10 0 20
Week 2
Day 1 100 12 1 18
Day 2 100 6 1 17
Day 3 100 15 1 12
Day 4 100 6 1 20
Day 5 100 1 0 25
Day 6 100 3 1 21
Day 7 100 10 1 19
The above table shows data collected from tree plantation of 100 trees daily for two weeks.
The mean was calculated for the two weeks, and it was 7.14285714 while the standard
deviation acquired on the invested trees was 4.15515416. Standard deviation is the measure
of how a data set is spread out while the mean is finding the average of value computed and
the cost divided by the total of all the numbers (Duschl, R., and J. Osborne. 2012).
Advantages of Standard deviation.
i) This is used to show how data sets are spread out. A high standard deviation means that
data is spread out while a lower standard deviation that most of the numbers are close to the
average (Duschl, R., and J. Osborne. 2012).
5
Advantages of the mean.
i) In the calculation of mean, all the numbers acquired can be used to calculate the average
since very large or small values can affect the way (Nielsen, J.A., 2013)
ii) Mean can be used to show the overall information in a data set.
So from our mean and standard deviation, we can argue that the tree plantation infestation is
mostly spread out this is because the standard deviation is larger than the mean.
From our investigation, the following information was acquired on how the Crackety
Crickling would be controlled.
Keep the tree plantation as clean as possible. Dead branches, stumps, and litter should
be appropriately discarded; this is because the female crackety crickling insect can likely
lay eggs on the bedding that can, later on, affect the trees (Kim, M., R. Anthony, and D.
Blades,2014).
The Crackety crickling trap can be used to monitor the population growth of the insect
whereby the male crackety crickling insects can be prevented from reproducing with the
females (Kim, M., R. Anthony, and D. Blades. 2012).
Monterey garden insect spray can be used on the infected trees or leaves to kill the
crackery crickling larvae or insects. This method can be useful if it can be used when the
insects are small less than one inch and in places where the populations are very high
two or more one week or two sprayings of the parts might be recommended (Loui, R.P.,
2015).
Use of chemicals such as AzaMax that contains azadirachtin an essential insecticide
ingredient that is always found in neem oil can be adviced.The insecticide contains
elements that can disrupt the development and size of insects. The chemical also
includes anti feed ant and repellent features (Khine, M.S., 2012).
Insecticides that have less harmful sides such as least-toxic botanical can be used.
6
⊘ This is a preview!⊘
Do you want full access?
Subscribe today to unlock all pages.
Trusted by 1+ million students worldwide
Column1 Column2 Column3 Column4 Column5 Column6 Column7 Column8 Column9
Column1 Column2 Column3 Column4 Column5 Column6 Column7 Column8 Column9
Weeks DATA
Day 1
Week(days
) lag 1 lag 2 lag 3
Day 2 2 4 12 0 15
Day 3 5 1 5 4 0 24
Day 4 12 0 15 6 10 1 20
Day 5 4 0 24 7 4 1 23
Day 6 10 1 20 1 10 1 18
Day 7 4 1 23 2 12 0 20
Day1 10 1 18 3 6 1 20
Day 2 12 0 20 4 15 1 18
Day 3 6 1 20 5 6 1 17
Day 4 15 1 18 6 1 1 12
Day 5 6 1 17 7 3 0 20
Day 6 1 1 12
Day 7 3 0 20
10 1 25
1 21
7
Paraphrase This Document
Need a fresh take? Get an instant paraphrase of this document with our AI Paraphraser
19
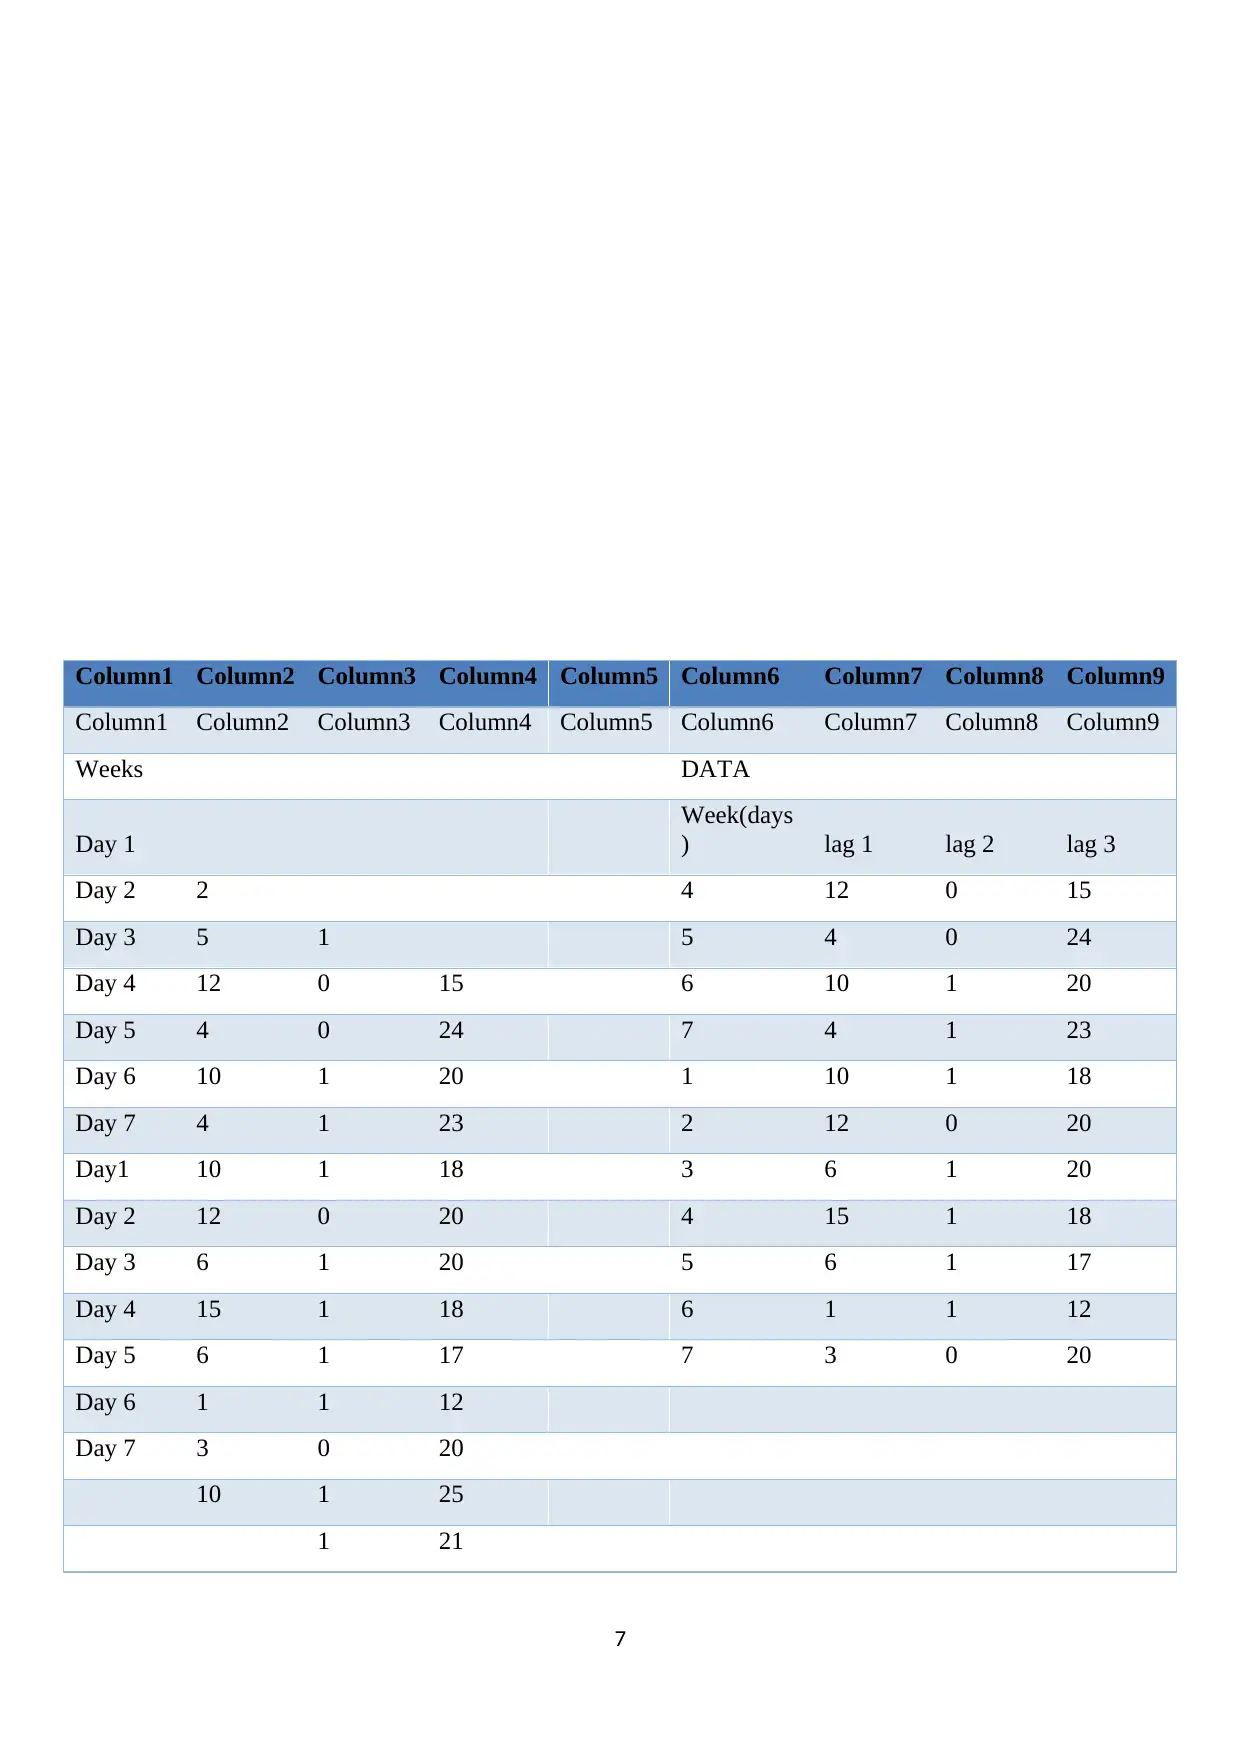
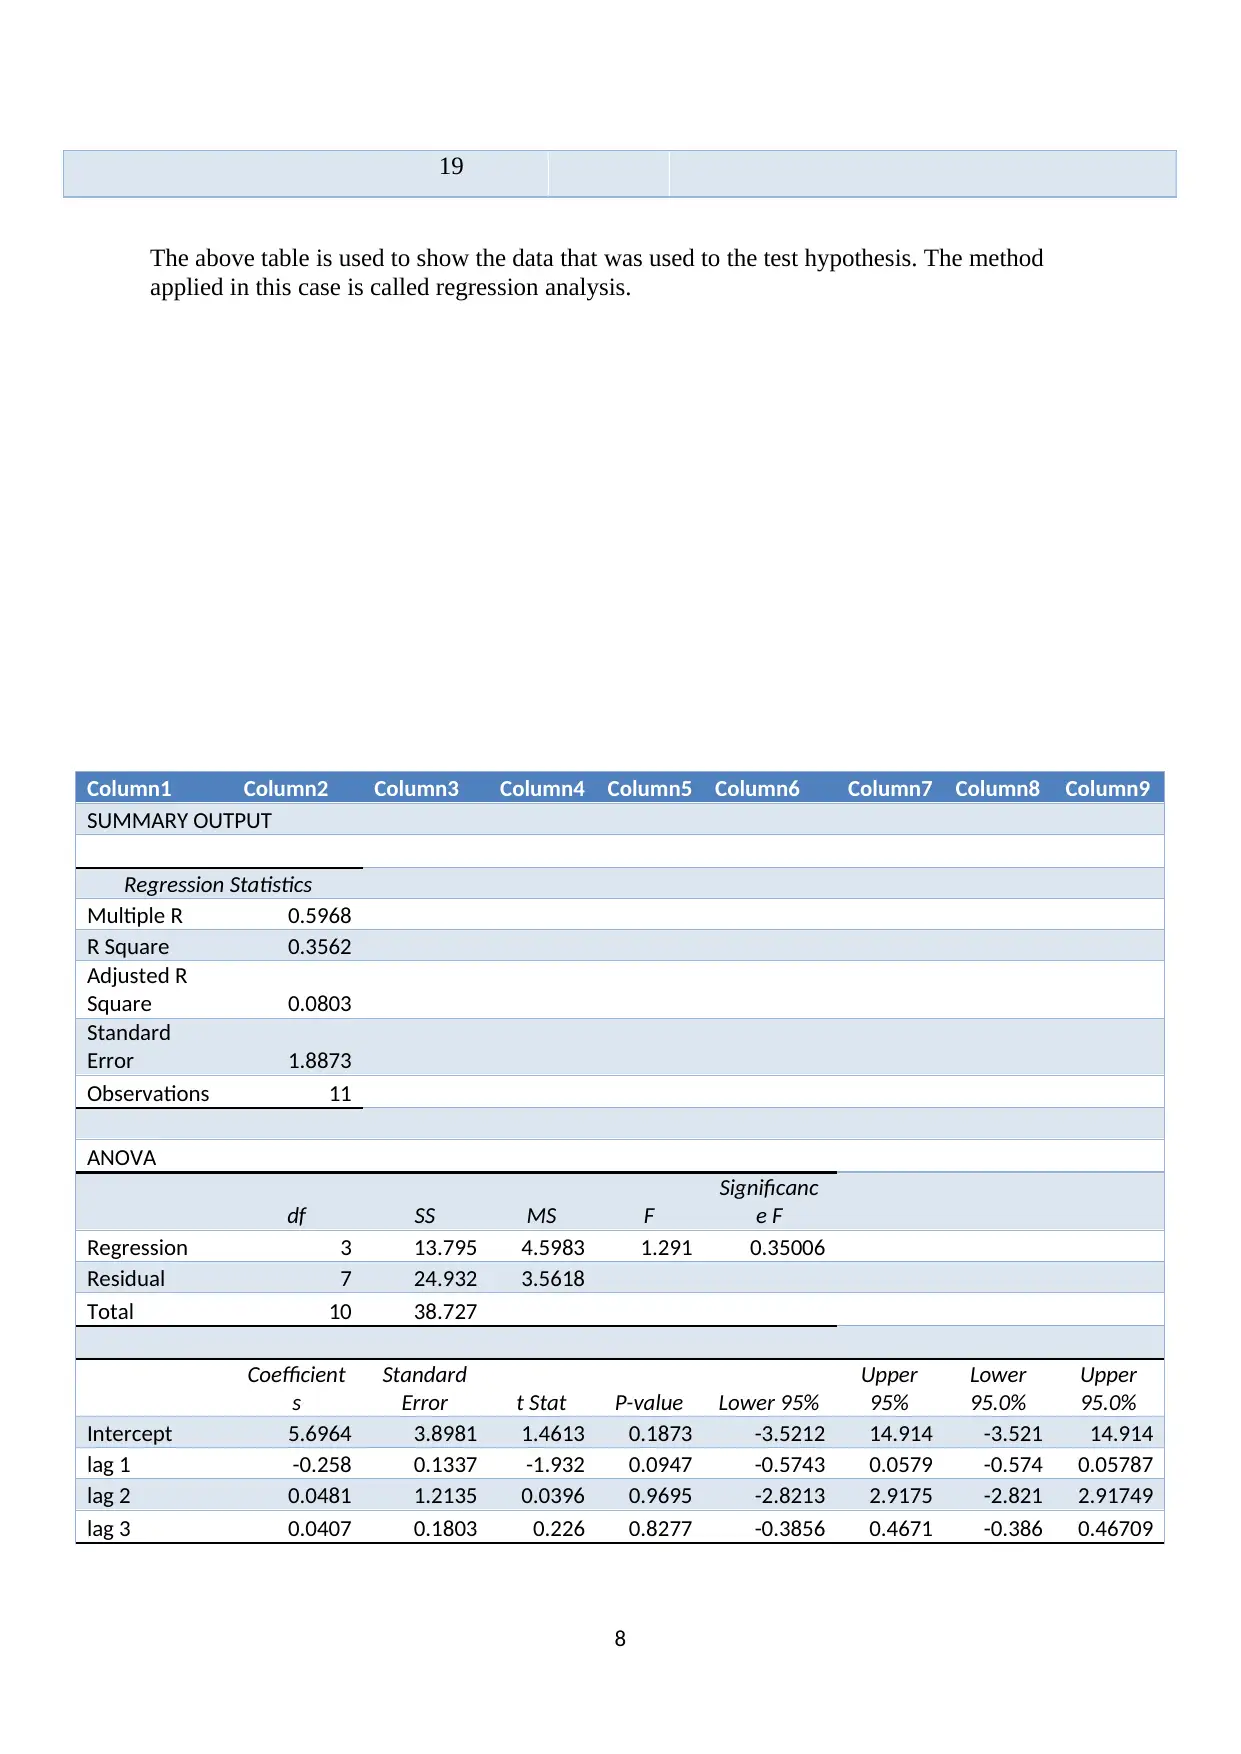
The above table is used to show the data that was used to the test hypothesis. The method
applied in this case is called regression analysis.
Column1 Column2 Column3 Column4 Column5 Column6 Column7 Column8 Column9
SUMMARY OUTPUT
Regression Statistics
Multiple R 0.5968
R Square 0.3562
Adjusted R
Square 0.0803
Standard
Error 1.8873
Observations 11
ANOVA
df SS MS F
Significanc
e F
Regression 3 13.795 4.5983 1.291 0.35006
Residual 7 24.932 3.5618
Total 10 38.727
Coefficient
s
Standard
Error t Stat P-value Lower 95%
Upper
95%
Lower
95.0%
Upper
95.0%
Intercept 5.6964 3.8981 1.4613 0.1873 -3.5212 14.914 -3.521 14.914
lag 1 -0.258 0.1337 -1.932 0.0947 -0.5743 0.0579 -0.574 0.05787
lag 2 0.0481 1.2135 0.0396 0.9695 -2.8213 2.9175 -2.821 2.91749
lag 3 0.0407 0.1803 0.226 0.8277 -0.3856 0.4671 -0.386 0.46709
8
From the above table showing lag 1, 2 and three the best lag that was chosen was lag two this
is because it had a p-value of 0.0946838 and this meant that the result achieved from our
investigation was replicable. Therefore it meant that if the insect's attacks were not controlled
early, the same infestation would occur on the tree plantation attacked now and again (Fullan,
M., 2009).
Nextafoo Rondadoo Uptagoo
36840
36860
36880
36900
36920
36940
36960
36980
37000
Sum of temperature by field
field Sum of
temperature
Nextafoo 36898
Rondadoo 36992
Uptagoo 36908
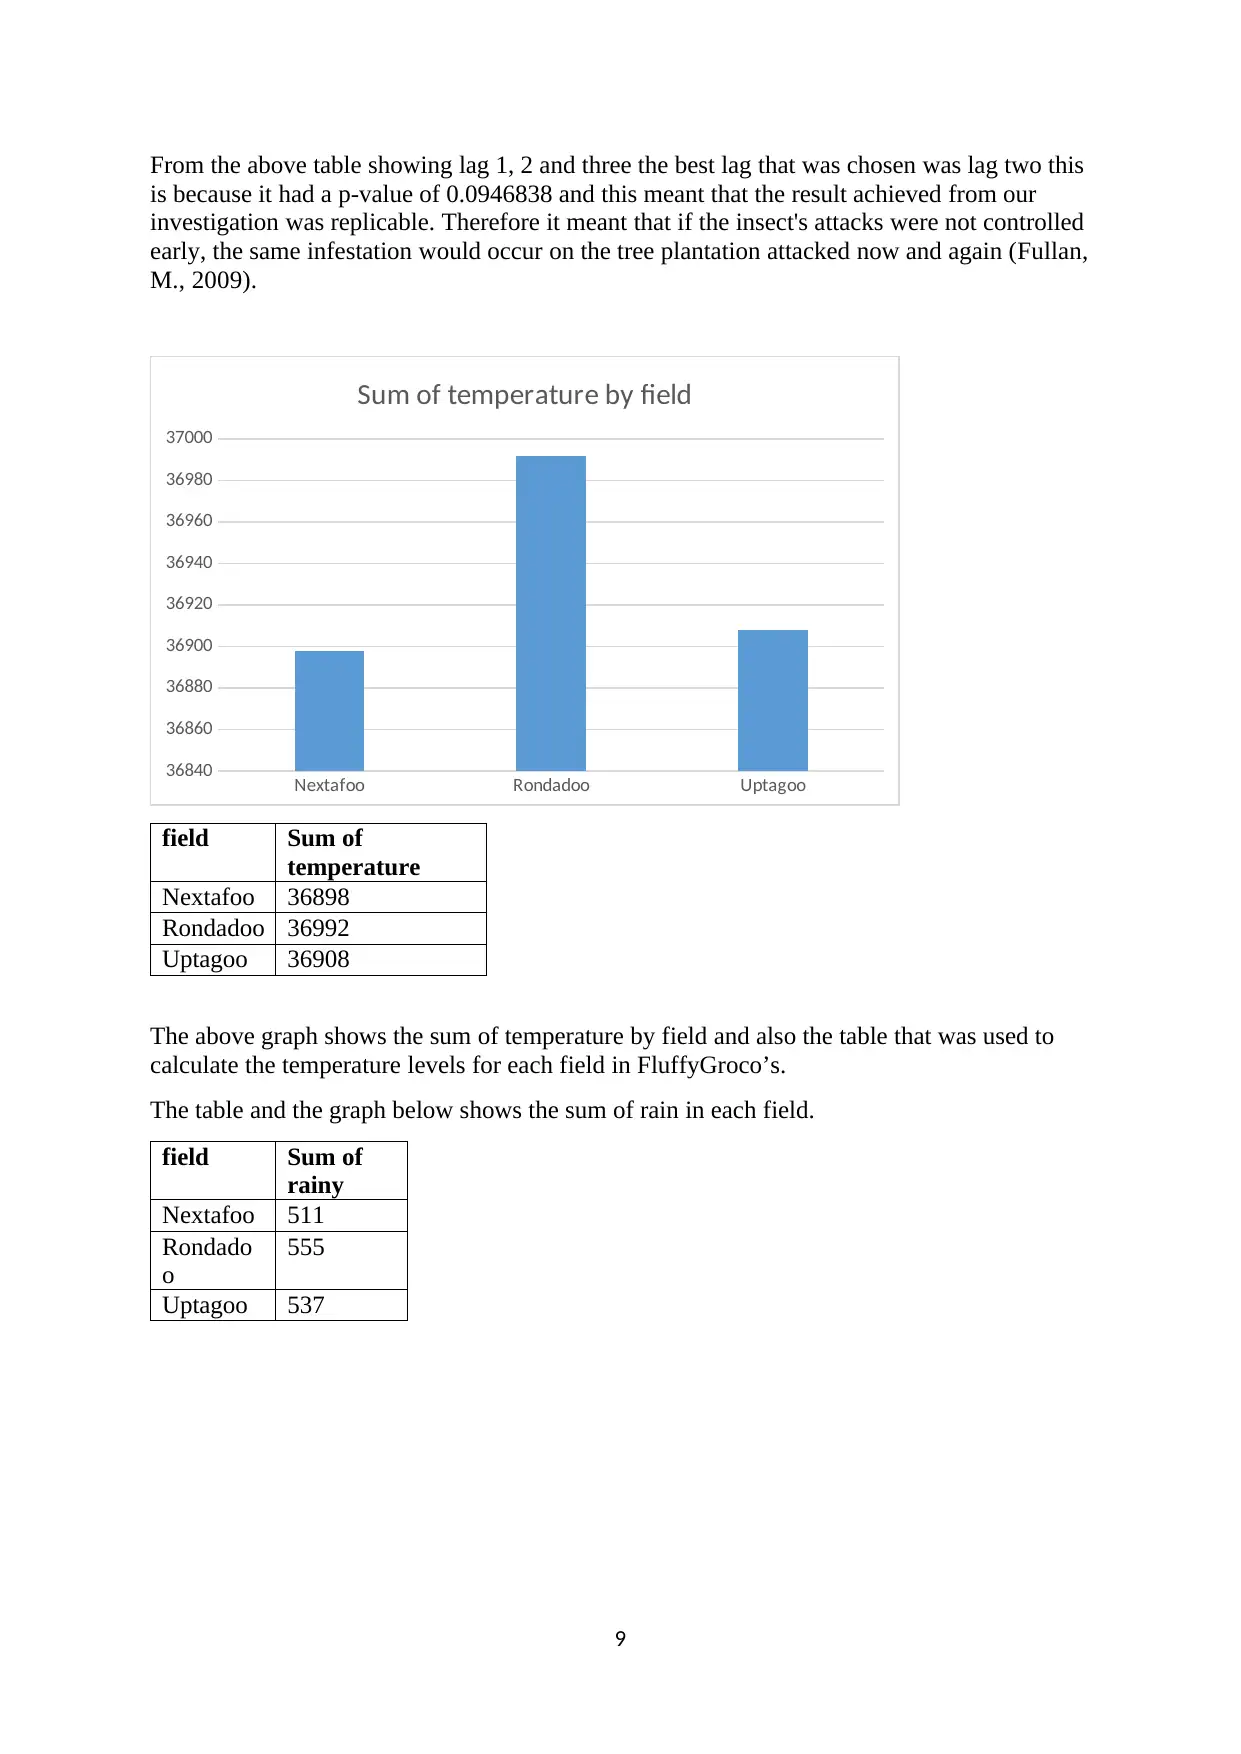
The above graph shows the sum of temperature by field and also the table that was used to
calculate the temperature levels for each field in FluffyGroco’s.
The table and the graph below shows the sum of rain in each field.
field Sum of
rainy
Nextafoo 511
Rondado
o
555
Uptagoo 537
9
is because it had a p-value of 0.0946838 and this meant that the result achieved from our
investigation was replicable. Therefore it meant that if the insect's attacks were not controlled
early, the same infestation would occur on the tree plantation attacked now and again (Fullan,
M., 2009).
Nextafoo Rondadoo Uptagoo
36840
36860
36880
36900
36920
36940
36960
36980
37000
Sum of temperature by field
field Sum of
temperature
Nextafoo 36898
Rondadoo 36992
Uptagoo 36908
The above graph shows the sum of temperature by field and also the table that was used to
calculate the temperature levels for each field in FluffyGroco’s.
The table and the graph below shows the sum of rain in each field.
field Sum of
rainy
Nextafoo 511
Rondado
o
555
Uptagoo 537
9
⊘ This is a preview!⊘
Do you want full access?
Subscribe today to unlock all pages.
Trusted by 1+ million students worldwide
Nextafoo Rondadoo Uptagoo
480
490
500
510
520
530
540
550
560
Sum of rainy by field
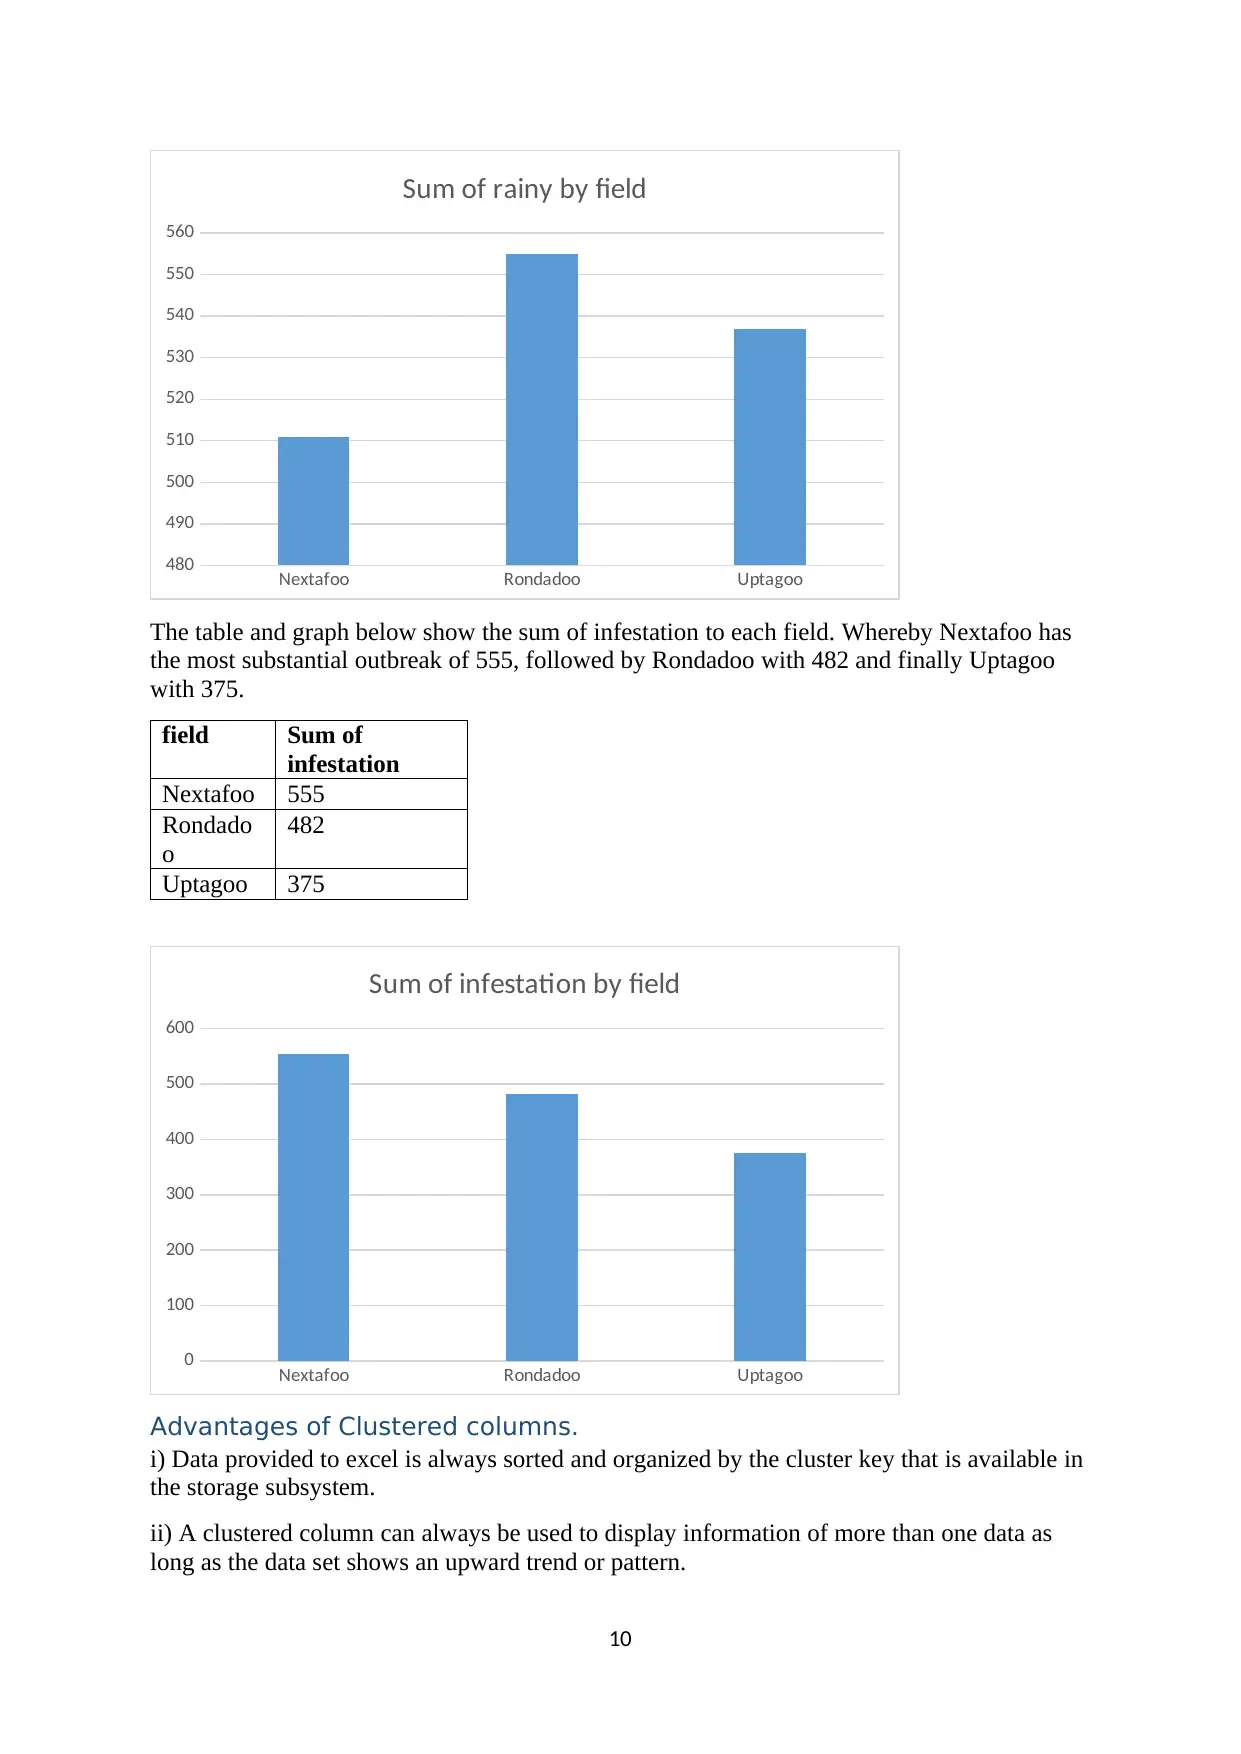
The table and graph below show the sum of infestation to each field. Whereby Nextafoo has
the most substantial outbreak of 555, followed by Rondadoo with 482 and finally Uptagoo
with 375.
field Sum of
infestation
Nextafoo 555
Rondado
o
482
Uptagoo 375
Nextafoo Rondadoo Uptagoo
0
100
200
300
400
500
600
Sum of infestation by field
Advantages of Clustered columns.
i) Data provided to excel is always sorted and organized by the cluster key that is available in
the storage subsystem.
ii) A clustered column can always be used to display information of more than one data as
long as the data set shows an upward trend or pattern.
10
480
490
500
510
520
530
540
550
560
Sum of rainy by field
The table and graph below show the sum of infestation to each field. Whereby Nextafoo has
the most substantial outbreak of 555, followed by Rondadoo with 482 and finally Uptagoo
with 375.
field Sum of
infestation
Nextafoo 555
Rondado
o
482
Uptagoo 375
Nextafoo Rondadoo Uptagoo
0
100
200
300
400
500
600
Sum of infestation by field
Advantages of Clustered columns.
i) Data provided to excel is always sorted and organized by the cluster key that is available in
the storage subsystem.
ii) A clustered column can always be used to display information of more than one data as
long as the data set shows an upward trend or pattern.
10
Paraphrase This Document
Need a fresh take? Get an instant paraphrase of this document with our AI Paraphraser
Ethical and Security Considerations.
In data science, particular ethical consideration should be put in place to ensure that data
acquired is manipulated well and understand. Individuals such as researchers can follow three
main points that are outlined below;
1) Collect minimal data. Only the data that is required show be collected by a researcher for
later interpretation (Martin, A.M., and B. Hand. 2017).
2) Identify and delete data that is not needed.
3) Have a plan that is outlined in case the findings develop backfire or in case you can
adequately support the arguments advanced (Martin, A.M., and B. Hand. 2017).
The above three ethics and security considerations when managing collected data should be
followed appropriately to ensure that the data gives out the right meaning. In the event
whereby a large amount of data are required the ethics should be adhered to enable useful
classification or grouping of the data. In data collection some quality dimensions must also be
subscribed to ensure quality. The dimensions are accuracy, consistency, validity, timeliness,
uniqueness, and completeness. This same case should be applied in the event where large
data volumes are to be collected. The ethics should be adhered to strictly to avoid gathering
and collection of the wrong or minimal data (Cameron, L., 2002).
In the collection of large scale data in data science, different considerations should be made
on the data to be collected. A researcher should identify and define the question he/she has a
problem with, set clear measurement priorities, collect the required data using different
acceptable methods, analyze the collected data and finally interpret the data collected. This
five considerations will lead to better decision making that will improve an organization rank
or solve any environmental problem (Cameron, L., 2002).
11
Data science in next steps and potential solutions.
FluffyGroCo can employ different strategies to curb the crackety crickling infestations on the
tree plantations. The company can use different data science techniques, practices, concepts,
and techniques. Example FluffyGroco’s can employ the following different methods used in
data science to help reduce the insect’s infestations.
i) Linear regression.
In statistics, linear regression is a one-dimensional method that shows the relationship across
the independent and dependent factors.
FluffyGroCo can use the linear regression method to predict the value of the dependent
factor. Also, if two or more variables of dependant and independent are required to be used in
prediction of the conditional variable multiple linear regression can be applied. The
difference between direct and multiple regression is the number of independent factors
available in each case (Çakmakci, G. and Taşar, M.F, 2010).
ii) Graphs.
Graphs are structures of data that always do consist of edges and nodes. The edges in graphs
in some cases they are called the lines while the nodes can be sometimes referred to as
vertices (Godden, D., and D. Walton, 2017).
FluffyGroCo can use charts and graphs because the structures display a lot of information in
a way that not literate and illiterate individuals can understand. Example, a line graph can be
used by a company to show it is trending over a long time (Çakmakci, G. and Taşar, M.F,
2010).
iii) Predictive modeling
This is a data science technique that involves the use of probability and data collection or
mining to predict the outcomes of an event. In the method, the ach model consists of several
predictors that are factors which might influence the future results and after relevant
information has been collected a statistics model can be made (Çakmakci, G. and Taşar,
M.F, 2010).
12
⊘ This is a preview!⊘
Do you want full access?
Subscribe today to unlock all pages.
Trusted by 1+ million students worldwide
1 out of 18
Related Documents


Your All-in-One AI-Powered Toolkit for Academic Success.
+13062052269
info@desklib.com
Available 24*7 on WhatsApp / Email
![[object Object]](/_next/static/media/star-bottom.7253800d.svg)
Unlock your academic potential
Copyright © 2020–2026 A2Z Services. All Rights Reserved. Developed and managed by ZUCOL.