Practical Investigation: Measuring Fluid Flow with Orifice Meter
VerifiedAdded on 2023/06/03
|8
|1805
|325
Practical Assignment
AI Summary
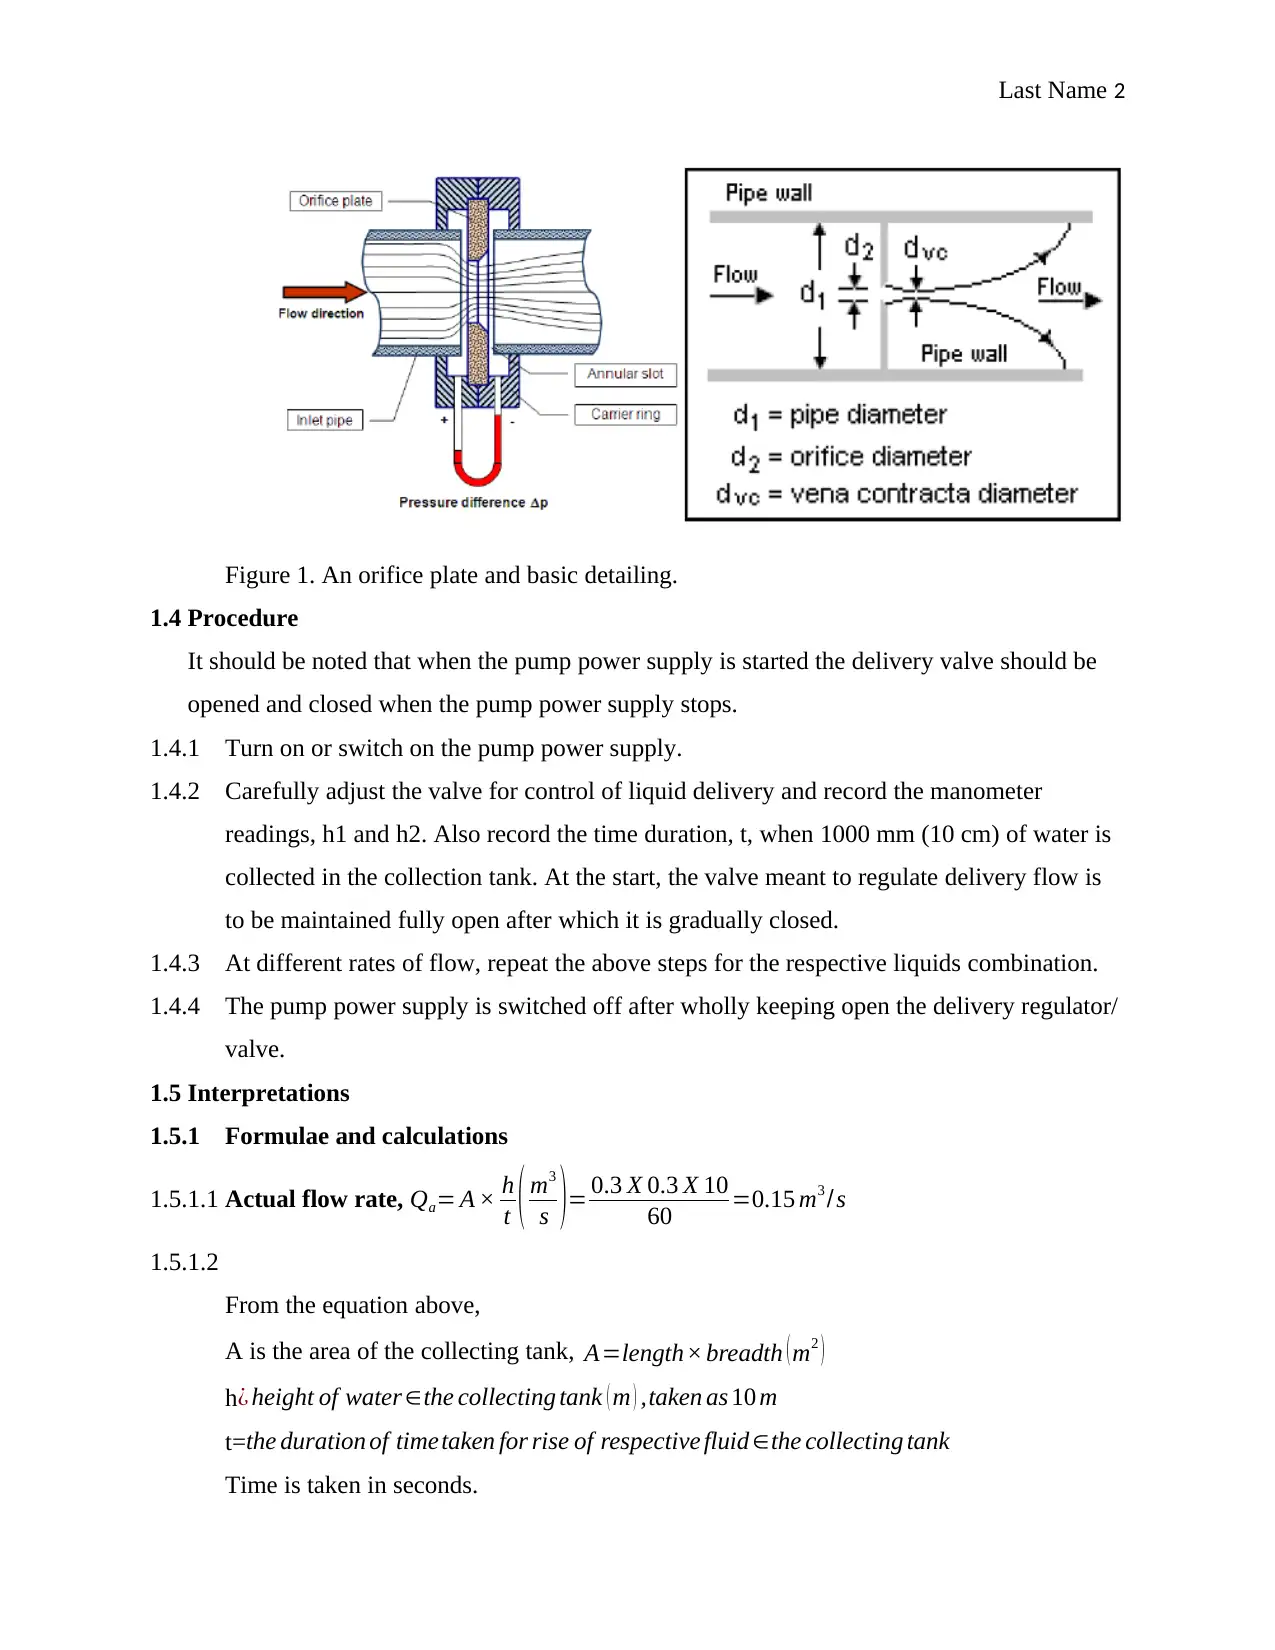
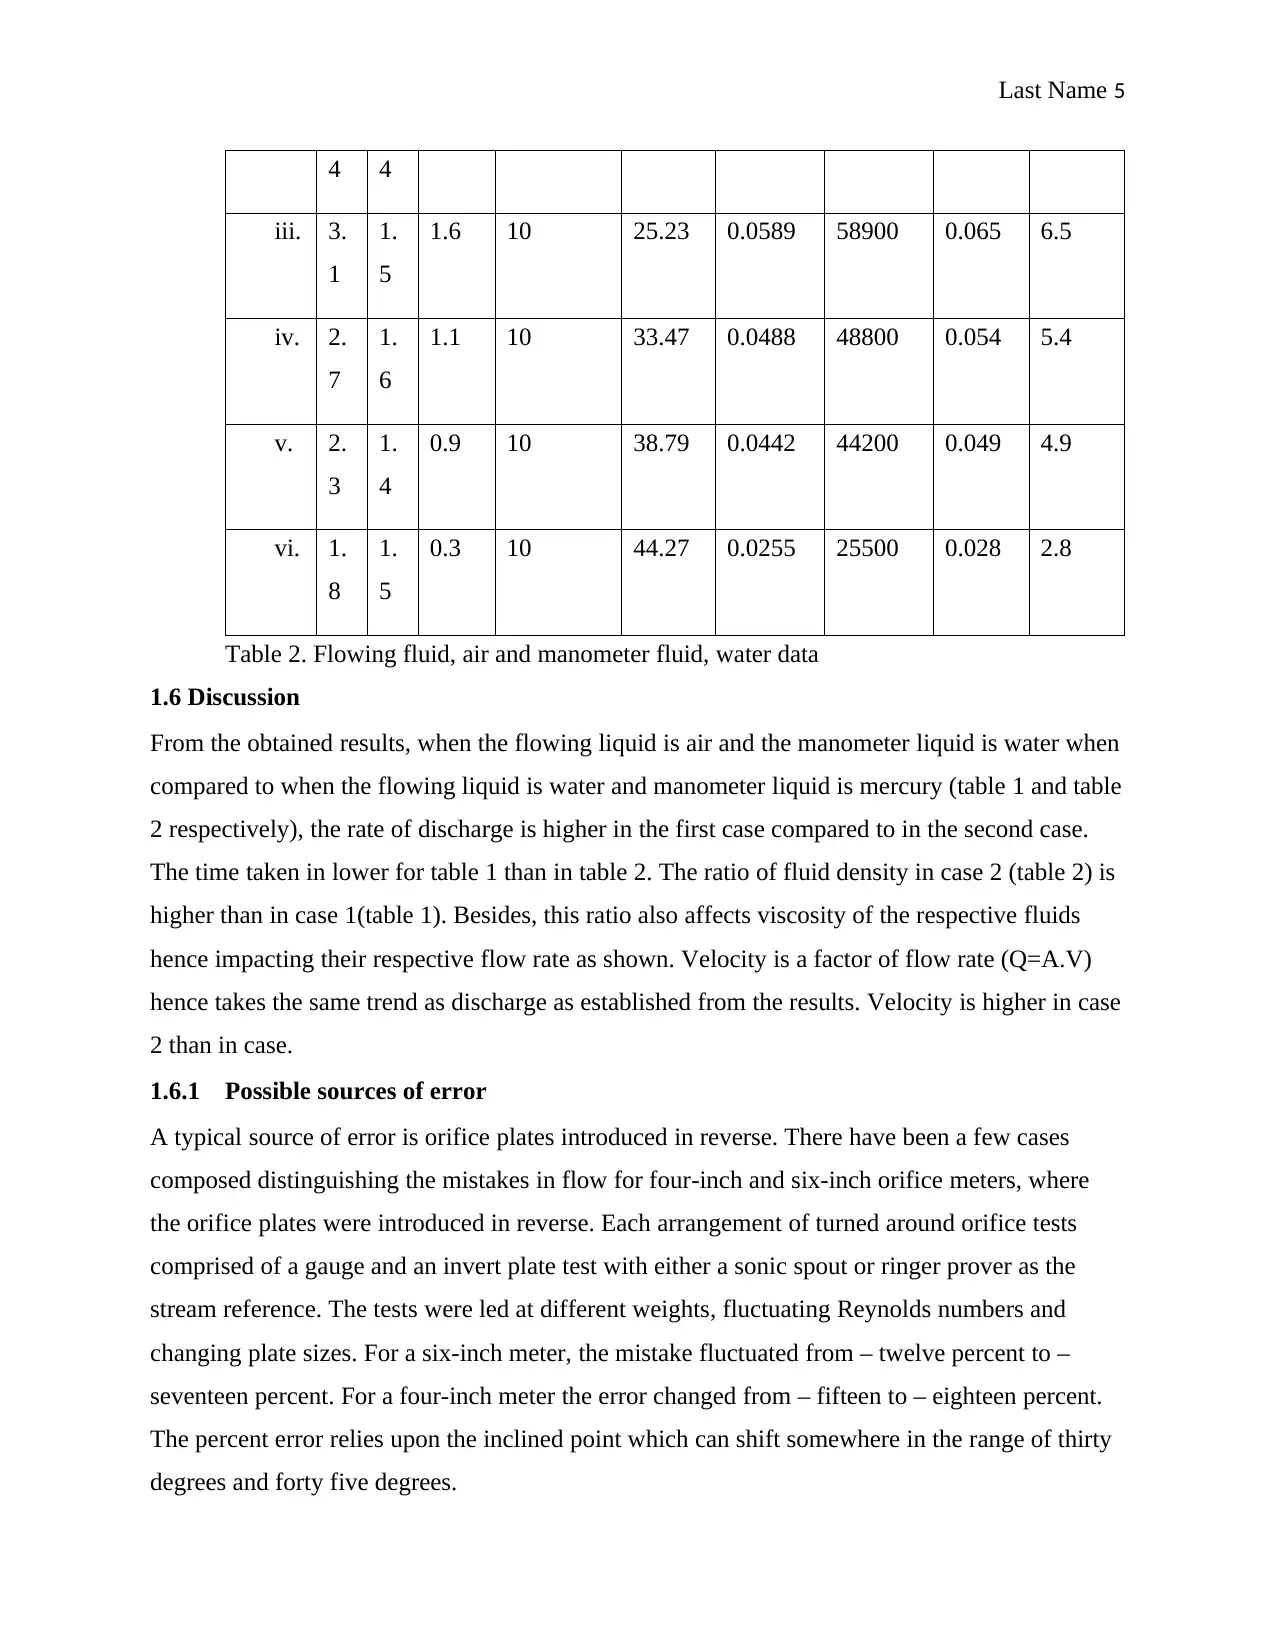
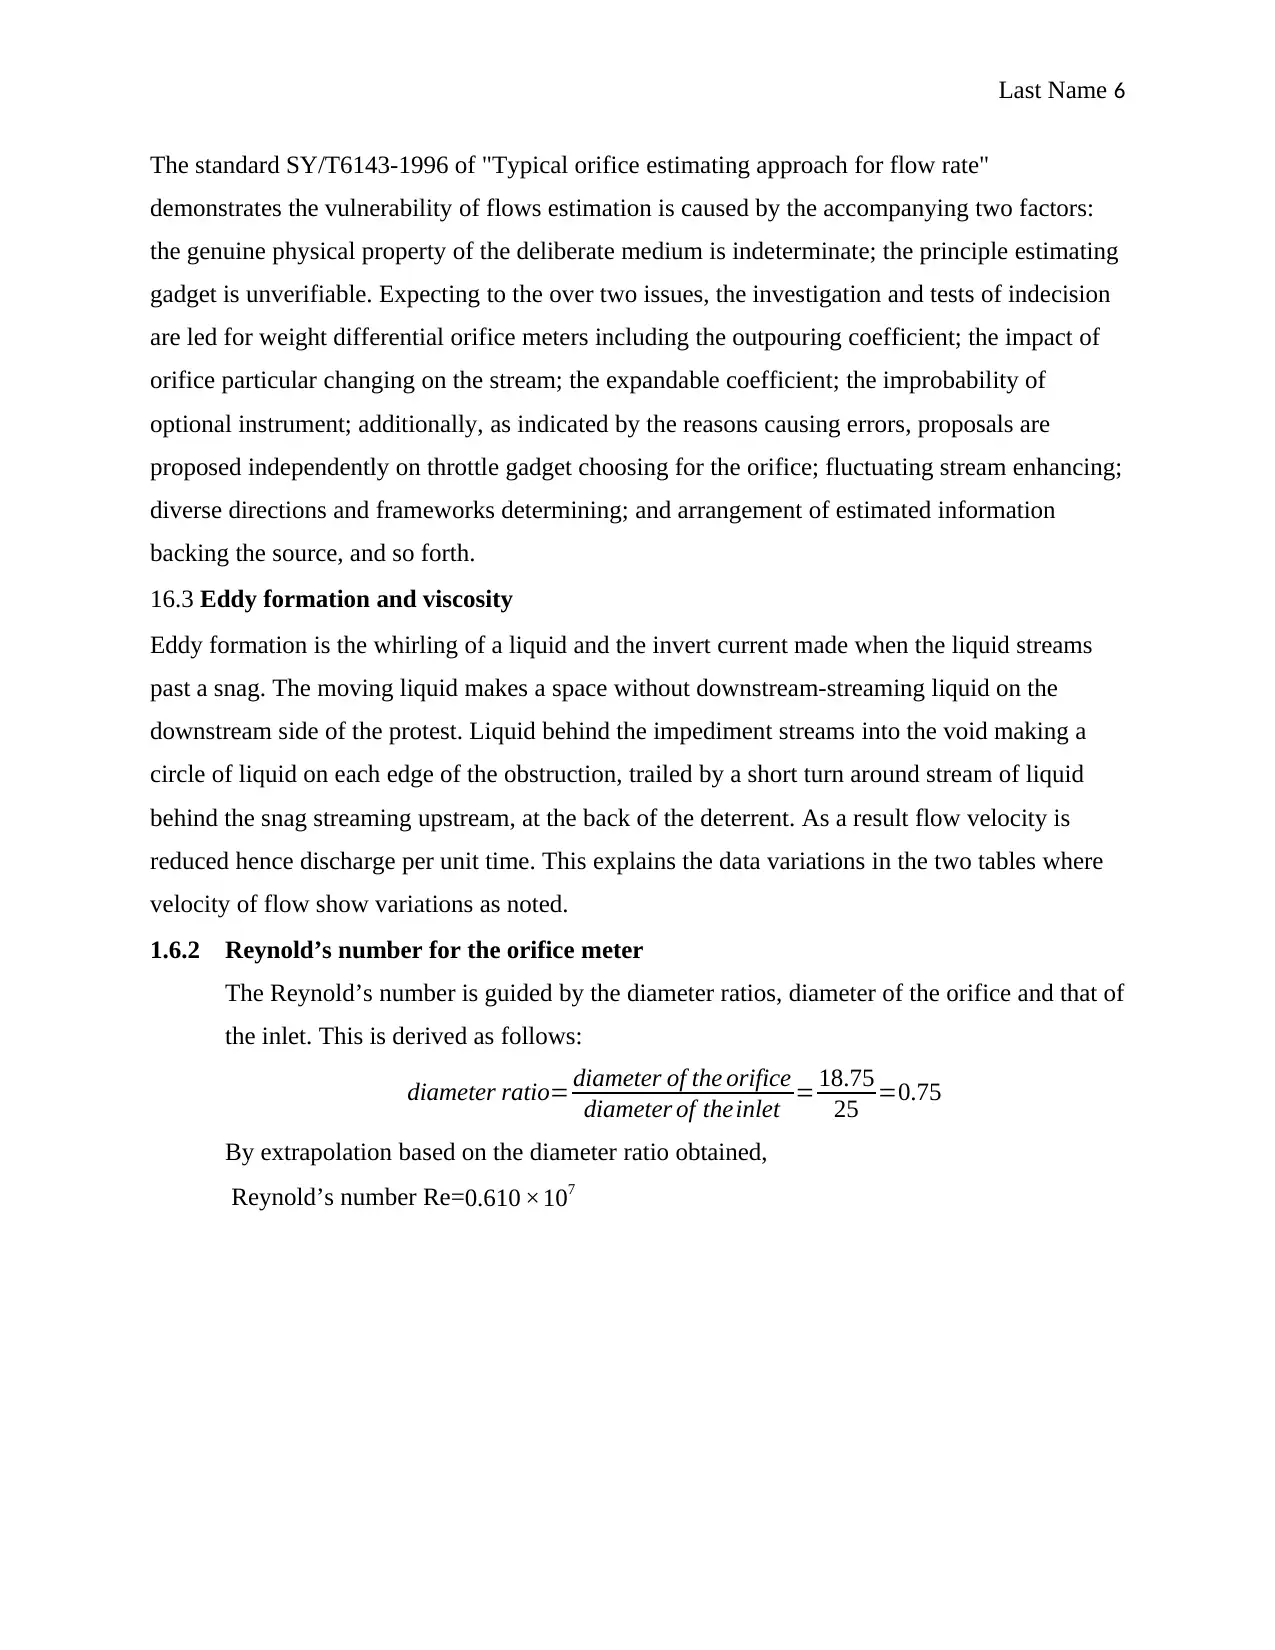
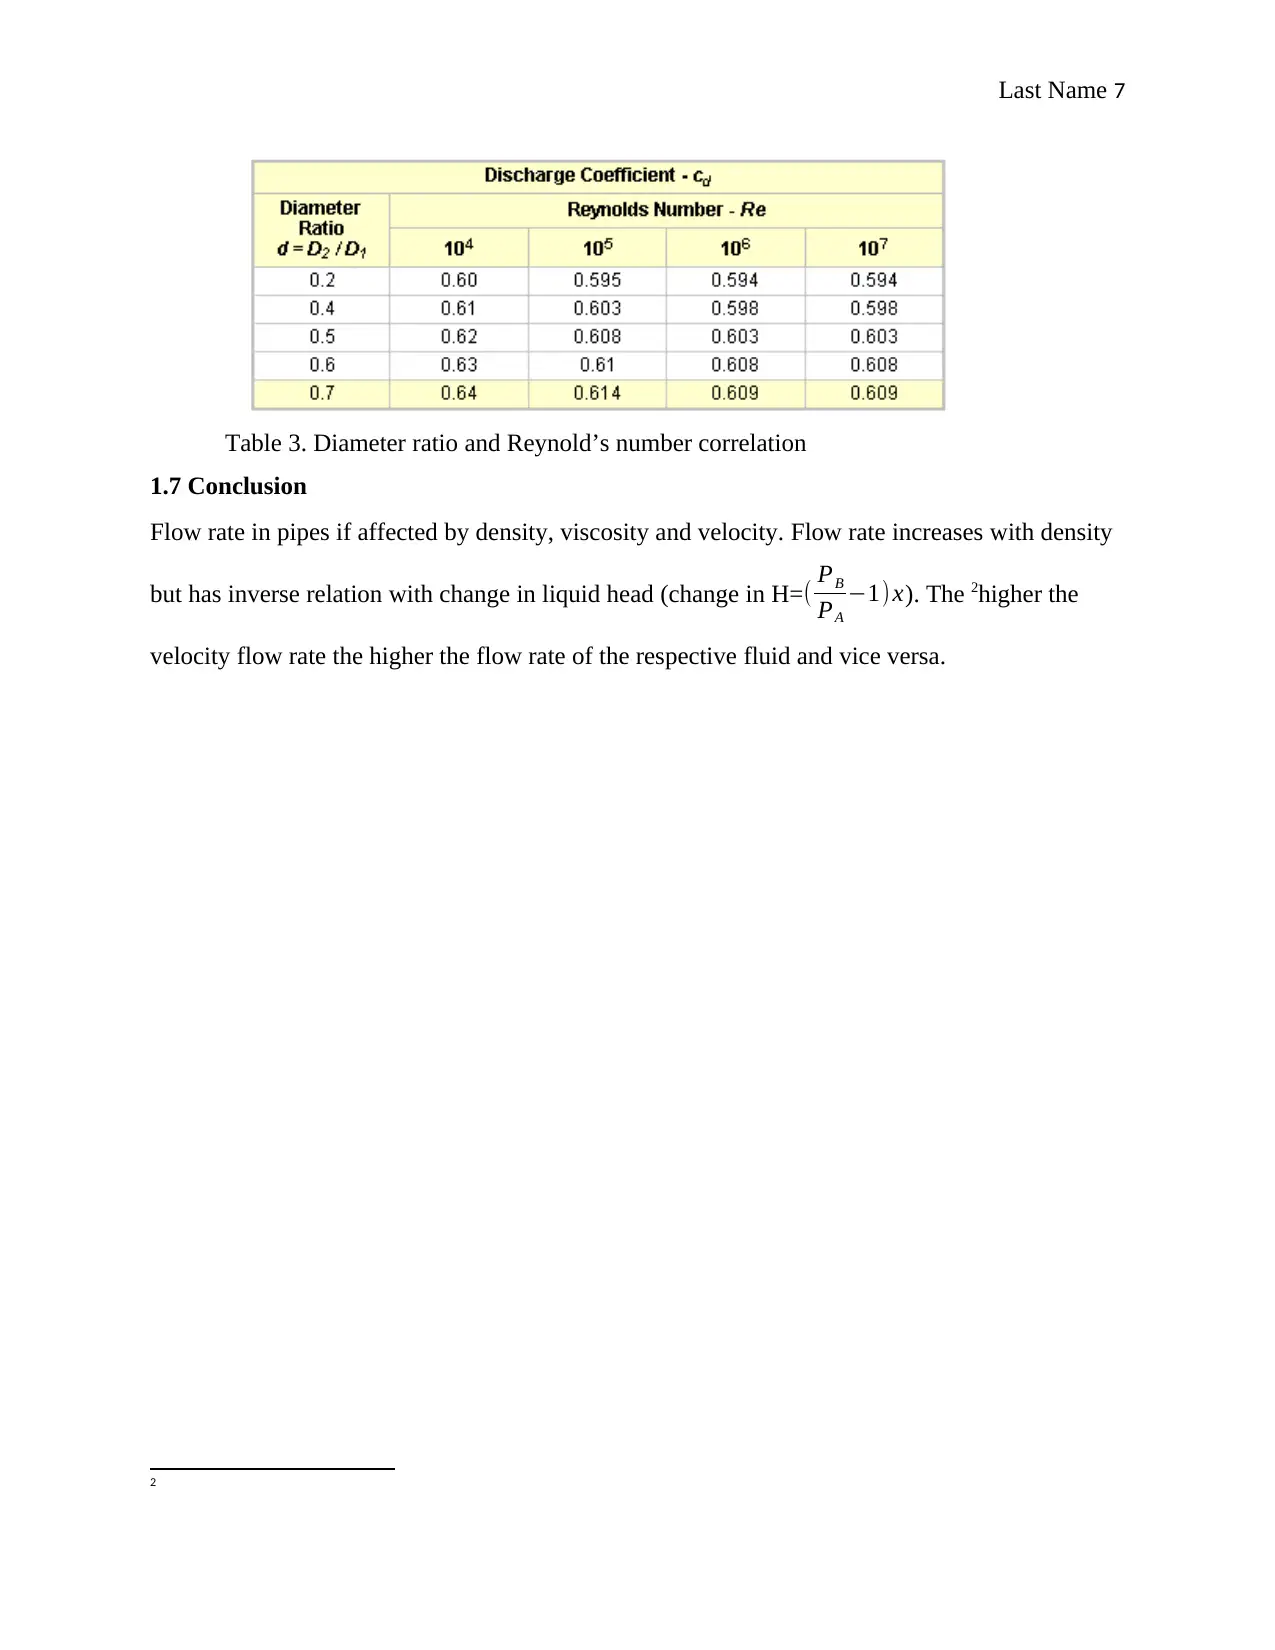
This practical assignment focuses on determining the flow rate of a fluid in a pipe using an orifice meter. The methodology involves understanding the concept of an orifice plate and its application based on Bernoulli's principle. The experiment details the apparatus required, including a stop watch and an orifice meter test rig, and outlines a step-by-step procedure for data collection. The collected data, including manometer readings and time taken to collect a specific volume of fluid, is then used to calculate the actual and theoretical flow rates, as well as the coefficient of discharge and velocity of flow. The discussion section analyzes the results, comparing the flow rates of air and water with different manometer fluids, and addresses potential sources of error such as reversed orifice plates and the impact of viscosity and eddy formation. The Reynold’s number is also calculated to provide further insight into the flow characteristics. The experiment concludes that flow rate is affected by fluid density, viscosity, and velocity, emphasizing the inverse relationship between flow rate and liquid head.

First Name Last Name
Instructor
Course
10 December 2018
Measurement of Flow Rate of Fluid in a Pipe Using an Orifice Meter
1.1 AIM: To determining flow rate (Q) of liquids
1.2 APPARATUS REQUIRED: stop watch, orifice meter test rig.
1.3 METHODOLOGY
1.3.1 CONCEPT
An orifice plate is a gadget utilized for estimating the volumetric stream rate, also known
as discharge/ flow rate designated as Q. It operates indistinguishable standard from a Venturi
spout, precisely Bernoulli's rule. The rule articulates that there exist a correlation concerning the
liquid pressure and the velocity/speed of the liquid. At the point when the speed expands, the
weight diminishes and the other way around. An orifice plate consist of a thin plate having an
opening at the center. It is typically put in a pipe in which liquid streams. At the point when the
liquid achieves the opening plate, with the gap in the center, the liquid is compelled to join to
experience the little gap; the purpose of most extreme convergence really happens without
further ado downstream of the physical hole, at the alleged vena contracta point. In the interim,
the speed and the pressure fluctuates. Past the vena contracta, the liquid grows and the speed and
weight/pressure adjusts yet again. By estimating the distinction in liquid pressure concerning the
ordinary pipe segment besides at the vena contracta, the volumetric as well as mass stream rates
are obtained based on Bernoulli's condition. Orifice plates are normally regularly utilized for
persistent estimation of liquid stream through funnels. The laboratory experimentation is an
alignment procedure of the specified orifice meter.1
1 Orifice plates are most regularly utilized for persistent estimation of liquid stream/ flow in funnels
Paraphrase This Document
Need a fresh take? Get an instant paraphrase of this document with our AI Paraphraser

Last Name 2
Figure 1. An orifice plate and basic detailing.
1.4 Procedure
It should be noted that when the pump power supply is started the delivery valve should be
opened and closed when the pump power supply stops.
1.4.1 Turn on or switch on the pump power supply.
1.4.2 Carefully adjust the valve for control of liquid delivery and record the manometer
readings, h1 and h2. Also record the time duration, t, when 1000 mm (10 cm) of water is
collected in the collection tank. At the start, the valve meant to regulate delivery flow is
to be maintained fully open after which it is gradually closed.
1.4.3 At different rates of flow, repeat the above steps for the respective liquids combination.
1.4.4 The pump power supply is switched off after wholly keeping open the delivery regulator/
valve.
1.5 Interpretations
1.5.1 Formulae and calculations
1.5.1.1 Actual flow rate, Qa= A × h
t ( m3
s )= 0.3 X 0.3 X 10
60 =0.15 m3 /s
1.5.1.2
From the equation above,
A is the area of the collecting tank, A=length× breadth ( m2 )
h¿ height of water ∈the collecting tank ( m ) ,taken as 10 m
t=the duration of timetaken for rise of respective fluid ∈the collecting tank
Time is taken in seconds.

Last Name 3
1.5.1.3 The theoretical discharge through orifice meter,
Qt = a1 a2 √ 2 gH
a1
2−a2
2
m3
s ,
this equation cab rewritten as :
Q=C Ao { √2 gH
1− [ A1
A1 ]2
From the above equation,
H= manometer differential head in meters
In this case, H=( PB
PA
−1)x
For table 1, H= ( 3600
1000 −1) x=2.6 x
For table 2, H= ( 1000
1.225 −1 ) x=815 x
Orifice meter size and / dimensions:
Office diameter, d2=18.75 mm
Diameter of the inlet, d1=25 mm
Inlet area of the orifice given in square meters, a0= π d1
2
4 ,=a0 =π × 2 52
4 =491 mm2
Area of the orifice, also known to be the throat, a1= π d2
2
4 =π × 18.752
4 =276 m m2
And g is the gravitational acceleration taken as 9.81 m/s2
1.5.1.4 The coefficient of discharge, Cd
Cd= actual discaharge
theoretical discharge =0.6 (assumed value as provided)
1.5.1.5 velocity of flow
Velocity= discharge/ area,
velocity ,V = Q
A
1.5.2 Data tabulation
Measuring area in the collecting A= 0.3 ×0.3=0.9 m2=9000 c m2
⊘ This is a preview!⊘
Do you want full access?
Subscribe today to unlock all pages.

Trusted by 1+ million students worldwide

Last Name 4
S1
numbe
r
Manometer
readings
Manomet
er head
Time
for 10
cm
rise
Actual
discharg
e Q
Actual
discharg
e
velocit
y
velocit
y
H
1
H
2
x=h1
-h2
m second
s
m3 /s c m3 /s m/s cm/ s
i. 6.
2
1.
5
4.7 10 24.08 0.0057 5700 0.0063 0.63
ii. 5.
8
1.
7
4.1 10 29.36 0.0054 5400 0.0060 0.60
iii. 5.
3
1.
5
3.8 10 35.79 0.0051 5100 0.0057 0.57
iv. 5.
0
1.
4
3.6 10 40.53 0.0050 5000 0.0056 0.56
v. 4.
5
1.
3
3.2 10 46.22 0.0047 4700 0.0052 0.52
vi. 4.
1
1.
4
2.7 10 50.62 0.0043 4300 0.0048 0.48
Table 1. Flowing fluid, water and manometer fluid, mercury data
S1
numbe
r
Manometer
readings
Manomet
er head
Time
for 10
cm
rise
Actual
discharg
e Q
Actual
discharg
e Q
velocit
y
velocit
y
H
1
H
2
x=h1
-h2
m second
s
m3 /s c m3 /s m/s cm/ s
i. 3.
8
1.
6
2.2 10 14.24 0.0691 69100 0.077 7.7
ii. 3. 1. 2.0 10 19.61 0.0659 65900 0.073 7.3
S1
numbe
r
Manometer
readings
Manomet
er head
Time
for 10
cm
rise
Actual
discharg
e Q
Actual
discharg
e
velocit
y
velocit
y
H
1
H
2
x=h1
-h2
m second
s
m3 /s c m3 /s m/s cm/ s
i. 6.
2
1.
5
4.7 10 24.08 0.0057 5700 0.0063 0.63
ii. 5.
8
1.
7
4.1 10 29.36 0.0054 5400 0.0060 0.60
iii. 5.
3
1.
5
3.8 10 35.79 0.0051 5100 0.0057 0.57
iv. 5.
0
1.
4
3.6 10 40.53 0.0050 5000 0.0056 0.56
v. 4.
5
1.
3
3.2 10 46.22 0.0047 4700 0.0052 0.52
vi. 4.
1
1.
4
2.7 10 50.62 0.0043 4300 0.0048 0.48
Table 1. Flowing fluid, water and manometer fluid, mercury data
S1
numbe
r
Manometer
readings
Manomet
er head
Time
for 10
cm
rise
Actual
discharg
e Q
Actual
discharg
e Q
velocit
y
velocit
y
H
1
H
2
x=h1
-h2
m second
s
m3 /s c m3 /s m/s cm/ s
i. 3.
8
1.
6
2.2 10 14.24 0.0691 69100 0.077 7.7
ii. 3. 1. 2.0 10 19.61 0.0659 65900 0.073 7.3
Paraphrase This Document
Need a fresh take? Get an instant paraphrase of this document with our AI Paraphraser

Last Name 5
4 4
iii. 3.
1
1.
5
1.6 10 25.23 0.0589 58900 0.065 6.5
iv. 2.
7
1.
6
1.1 10 33.47 0.0488 48800 0.054 5.4
v. 2.
3
1.
4
0.9 10 38.79 0.0442 44200 0.049 4.9
vi. 1.
8
1.
5
0.3 10 44.27 0.0255 25500 0.028 2.8
Table 2. Flowing fluid, air and manometer fluid, water data
1.6 Discussion
From the obtained results, when the flowing liquid is air and the manometer liquid is water when
compared to when the flowing liquid is water and manometer liquid is mercury (table 1 and table
2 respectively), the rate of discharge is higher in the first case compared to in the second case.
The time taken in lower for table 1 than in table 2. The ratio of fluid density in case 2 (table 2) is
higher than in case 1(table 1). Besides, this ratio also affects viscosity of the respective fluids
hence impacting their respective flow rate as shown. Velocity is a factor of flow rate (Q=A.V)
hence takes the same trend as discharge as established from the results. Velocity is higher in case
2 than in case.
1.6.1 Possible sources of error
A typical source of error is orifice plates introduced in reverse. There have been a few cases
composed distinguishing the mistakes in flow for four-inch and six-inch orifice meters, where
the orifice plates were introduced in reverse. Each arrangement of turned around orifice tests
comprised of a gauge and an invert plate test with either a sonic spout or ringer prover as the
stream reference. The tests were led at different weights, fluctuating Reynolds numbers and
changing plate sizes. For a six-inch meter, the mistake fluctuated from – twelve percent to –
seventeen percent. For a four-inch meter the error changed from – fifteen to – eighteen percent.
The percent error relies upon the inclined point which can shift somewhere in the range of thirty
degrees and forty five degrees.

Last Name 6
The standard SY/T6143-1996 of "Typical orifice estimating approach for flow rate"
demonstrates the vulnerability of flows estimation is caused by the accompanying two factors:
the genuine physical property of the deliberate medium is indeterminate; the principle estimating
gadget is unverifiable. Expecting to the over two issues, the investigation and tests of indecision
are led for weight differential orifice meters including the outpouring coefficient; the impact of
orifice particular changing on the stream; the expandable coefficient; the improbability of
optional instrument; additionally, as indicated by the reasons causing errors, proposals are
proposed independently on throttle gadget choosing for the orifice; fluctuating stream enhancing;
diverse directions and frameworks determining; and arrangement of estimated information
backing the source, and so forth.
16.3 Eddy formation and viscosity
Eddy formation is the whirling of a liquid and the invert current made when the liquid streams
past a snag. The moving liquid makes a space without downstream-streaming liquid on the
downstream side of the protest. Liquid behind the impediment streams into the void making a
circle of liquid on each edge of the obstruction, trailed by a short turn around stream of liquid
behind the snag streaming upstream, at the back of the deterrent. As a result flow velocity is
reduced hence discharge per unit time. This explains the data variations in the two tables where
velocity of flow show variations as noted.
1.6.2 Reynold’s number for the orifice meter
The Reynold’s number is guided by the diameter ratios, diameter of the orifice and that of
the inlet. This is derived as follows:
diameter ratio= diameter of the orifice
diameter of theinlet = 18.75
25 =0.75
By extrapolation based on the diameter ratio obtained,
Reynold’s number Re=0.610 ×10⁷
⊘ This is a preview!⊘
Do you want full access?
Subscribe today to unlock all pages.

Trusted by 1+ million students worldwide

Last Name 7
Table 3. Diameter ratio and Reynold’s number correlation
1.7 Conclusion
Flow rate in pipes if affected by density, viscosity and velocity. Flow rate increases with density
but has inverse relation with change in liquid head (change in H= ( PB
PA
−1) x). The 2higher the
velocity flow rate the higher the flow rate of the respective fluid and vice versa.
2
Paraphrase This Document
Need a fresh take? Get an instant paraphrase of this document with our AI Paraphraser

Last Name 8
Bibliography
Giles, R.V., Evett, J.B., and Liu, C., 2014. Fluid mechanics and hydraulics. New York, NY:
McGraw-Hill.
Jain, S.R., 2015. Fluid Mechanics. Mechanics, Waves and Thermodynamics, 142–152.
Bibliography
Giles, R.V., Evett, J.B., and Liu, C., 2014. Fluid mechanics and hydraulics. New York, NY:
McGraw-Hill.
Jain, S.R., 2015. Fluid Mechanics. Mechanics, Waves and Thermodynamics, 142–152.
1 out of 8
Your All-in-One AI-Powered Toolkit for Academic Success.
+13062052269
info@desklib.com
Available 24*7 on WhatsApp / Email
Unlock your academic potential
Copyright © 2020–2025 A2Z Services. All Rights Reserved. Developed and managed by ZUCOL.

