Detailed Financial and Economic Analysis of FMG's FY2019 Performance
VerifiedAdded on 2022/09/30
|5
|1206
|24
Report
AI Summary
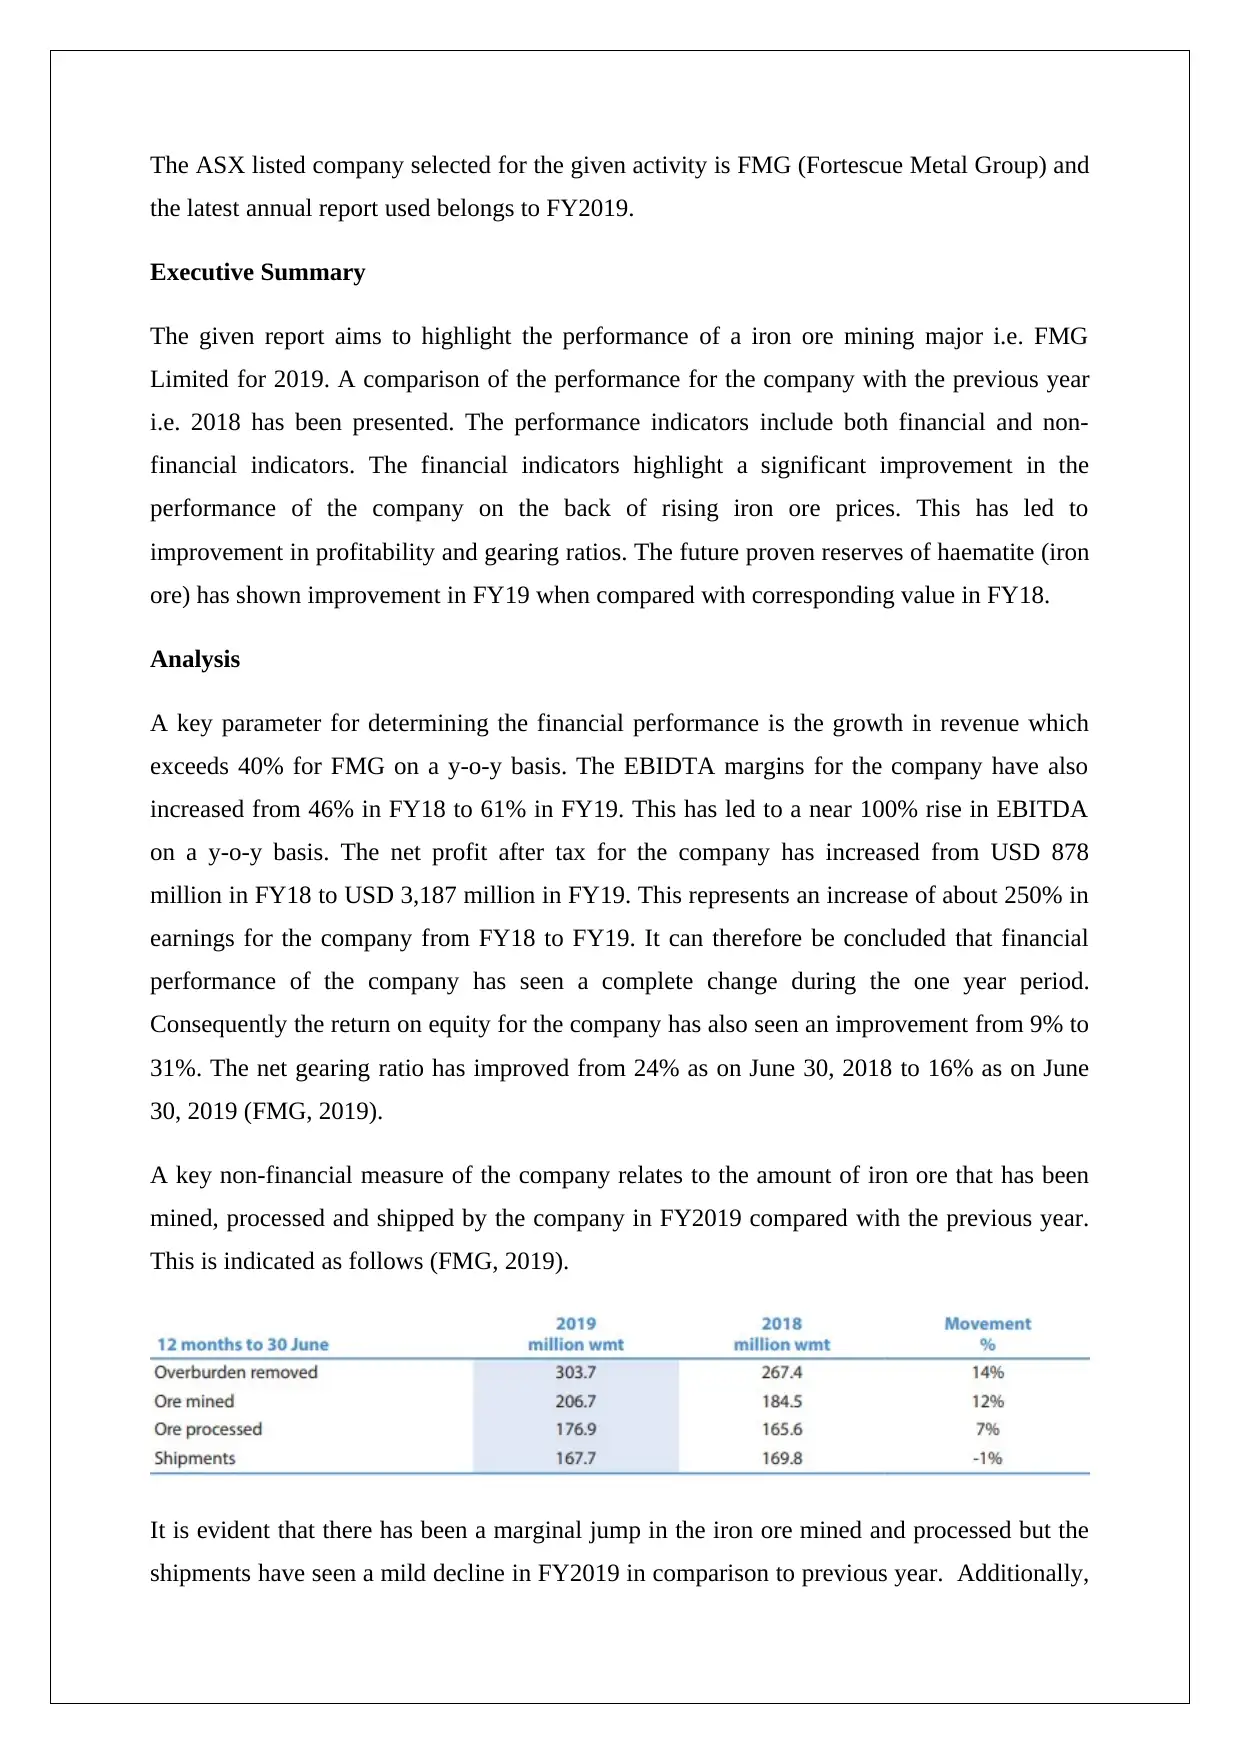
This report provides a comprehensive analysis of FMG's financial performance in FY2019, comparing it to FY2018. The report highlights the significant improvement in FMG's financial performance, driven by rising iron ore prices. Key financial indicators such as revenue, EBITDA margins, and net profit after tax are examined, revealing substantial growth. The analysis also includes non-financial indicators like iron ore mined, processed, shipped, and the proven reserves of haematite. The interpretation section attributes the improved profitability to the increase in iron ore prices and discusses the impact on the company's financial ratios and dividend payouts. The report concludes that FMG's financial performance underwent a complete transformation in FY19, emphasizing the importance of both financial and non-financial performance indicators, and the role of iron ore price trends in shaping the company's future. The report references FMG's annual report and several academic sources to support its analysis.

FINANCIAL AND ECONOMIC INTERPRETATION
STUDENT ID:
[Pick the date]
STUDENT ID:
[Pick the date]
Paraphrase This Document
Need a fresh take? Get an instant paraphrase of this document with our AI Paraphraser

The ASX listed company selected for the given activity is FMG (Fortescue Metal Group) and
the latest annual report used belongs to FY2019.
Executive Summary
The given report aims to highlight the performance of a iron ore mining major i.e. FMG
Limited for 2019. A comparison of the performance for the company with the previous year
i.e. 2018 has been presented. The performance indicators include both financial and non-
financial indicators. The financial indicators highlight a significant improvement in the
performance of the company on the back of rising iron ore prices. This has led to
improvement in profitability and gearing ratios. The future proven reserves of haematite (iron
ore) has shown improvement in FY19 when compared with corresponding value in FY18.
Analysis
A key parameter for determining the financial performance is the growth in revenue which
exceeds 40% for FMG on a y-o-y basis. The EBIDTA margins for the company have also
increased from 46% in FY18 to 61% in FY19. This has led to a near 100% rise in EBITDA
on a y-o-y basis. The net profit after tax for the company has increased from USD 878
million in FY18 to USD 3,187 million in FY19. This represents an increase of about 250% in
earnings for the company from FY18 to FY19. It can therefore be concluded that financial
performance of the company has seen a complete change during the one year period.
Consequently the return on equity for the company has also seen an improvement from 9% to
31%. The net gearing ratio has improved from 24% as on June 30, 2018 to 16% as on June
30, 2019 (FMG, 2019).
A key non-financial measure of the company relates to the amount of iron ore that has been
mined, processed and shipped by the company in FY2019 compared with the previous year.
This is indicated as follows (FMG, 2019).
It is evident that there has been a marginal jump in the iron ore mined and processed but the
shipments have seen a mild decline in FY2019 in comparison to previous year. Additionally,

the haematite proved reserves have also witnessed an increase of 8% during the year which
augers well for future earnings growth.
Interpretation
The significant jump in profitability of the company is attributed to the nature of the business.
The company is one of the largest iron ore miners in the world. As a result, the profitability of
the company is driven by the underlying price of iron ore in the international markets. There
has been an increase in the realised price of iron ore from USD 44/dmt (FY18) to USD
65/dmt (FY19). This has led to a boost in the revenue of the company despite the amount
shipped being marginally lower in FY2019. The lower shipped quantity may be attributed to
cyclonic activity which delayed the shipping. The jump in EBITDA has been quite significant
since the cost has remained almost the same and hence all the incremental revenue has got
reflected in the profits (FMG, 2019).
The nature of the mining industry is such that any incremental increase or decrease in the
price tends to be reflected in the profitability. As a result, the change in revenue on account of
commodity price change is always lower than the corresponding percentage change in
downstream income statement items such as EBITDA and net profits (Petty et. al.,2016).
The higher profits have led to a surge in the return on equity and have also resulted in higher
dividend being paid to the shareholders (FMG, 2019). Another positive aspect is that the
company has used this opportunity in order to reduce the net gearing thereby improving the
financial position which is of importance when the prices of iron ore would head lower. As a
result, it would be appropriate to conclude on back of higher iron ore prices, the company has
witnessed significant improvement in the financial performance over the given one year
period.
It is imperative that emphasis should also be paid on the non-financial performance indicators
along with financial performance indicators. One of these has been chosen as the quantity
mined, processed and shipped since the revenues and profitability of the company are driven
by this. If the quantity of ore which is mined or shipped goes down, it would have adverse
influence on the financial performance of the company (Parrino and Kidwell, 2014). Yet
another pivotal non-financial indicator is the extent of reserves of haematite which essentially
is pivotal to ensure the continuity of future returns. This is because as the company is mining
iron ore from the existing mines which depletes the amount of reserves and therefore
jeopardises the future earnings if more reserves are not created (Brealey, Myers and Allen,
⊘ This is a preview!⊘
Do you want full access?
Subscribe today to unlock all pages.

Trusted by 1+ million students worldwide

2014). Going forward, the performance of the company would be dependent on the price of
iron ore which in turn would be driven based on demand from China which is the main
consumer of iron ore produced by FMG (FMG, 2019).
Conclusion
There has been a complete transformation of FMG’s financial performance in FY19 when
compared to the previous year. The main contributor of this has been the rising prices of iron
ore in the international markets which has led to rising revenues for the company despite the
volumes remaining static. Considering similar volumes and no incremental costs, large
portion of the higher revenues has been transformed into profits which has caused the
profitability ratios to soar in FY19 when compared with FY18. The company has also used
the stellar performance of the company to deleverage the balance sheet and reduce the net
gearing. The non-financial indicators of performance also reflect that the proven reserves of
haematite have shown marginal improvement during the given period which augers well for
the future growth of the company. The future performance of the company would be guided
by the trends in the iron ore price movement.
.
Paraphrase This Document
Need a fresh take? Get an instant paraphrase of this document with our AI Paraphraser

References
FMG (2019), Annual Report FY2019, [online] Available at
https://www.fmgl.com.au/docs/default-source/annual-reporting-suite/fy19-annual-report.pdf
[Assessed October 5 2019]
Brealey, R.A., Myers, S.C. and Allen, F. (2014) Principles of corporate finance. 2nd ed. New
York: McGraw-Hill Inc.
Parrino, R. and Kidwell, D. (2014) ,Fundamentals of Corporate Finance,4th ed., London:
Wiley Publications
Petty, J.W., Titman, S., Keown, A.J., Martin, P., Martin J.D. and Burrow, M.(2016),
Financial Management: Principles and Applications 6th ed. Sydney: Pearson Australia
1 out of 5
Related Documents

Your All-in-One AI-Powered Toolkit for Academic Success.
+13062052269
info@desklib.com
Available 24*7 on WhatsApp / Email
Unlock your academic potential
Copyright © 2020–2025 A2Z Services. All Rights Reserved. Developed and managed by ZUCOL.